Create a Report Using Crystal Reports Report Expert
Bạn đang xem bản rút gọn của tài liệu. Xem và tải ngay bản đầy đủ của tài liệu tại đây (33.51 KB, 12 trang )
10.1 Create a Report Using Crystal Reports Report Expert
I have created quite a few applications that allow the users to manipulate data in various
ways. Now I need to create some reports so that I can present information for my clients
and users. How do I create a report with Crystal Reports using one of these Experts I
have heard about?
Technique
You can create a report and include it in your projects as needed.
Getting Started Creating a Crystal Report
After right-clicking on your project in the Solution Explorer, you need to choose Add
New Item from the Add menu item. You then can pick Crystal Report from the templates
and name it appropriately.
Note
If you name your reports with the prefix of rptReportName, you will be
able to find all your reports in one location.
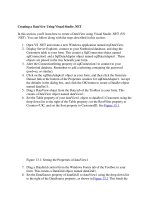
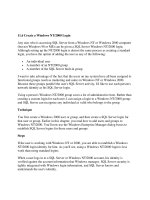
After you have clicked the Open button on the dialog box, you are presented with the
Crystal Report Gallery dialog box, shown here in Figure 10.1.
Figure 10.1. These Experts can save you time when you're creating reports.
Crystal Reports includes wizards called Experts. These Experts assist you in performing
certain tasks, from creating a whole report to creating an individual formula for a field.
Experts are actually made up of other Experts. For instance, the Report Expert utilizes the
Formula Expert within itself; however, you also can take advantage of the Formula
Expert from within the Report Designer.
Types of Reports You Can Create with the Report Expert
This How-To will discuss the Report Expert. This Expert creates various types of reports,
listed in Table 10.1, in alphabetical order.
Table 10.1. Types of Reports Created by the Report Expert
Report
Type
Description
Crosstab Crosstab reports give you a cross-tabulation of your data, such as sales of
customers by years.
Drill
Down
This report is broken down into sections that start out as hidden, and then
allow the user to "drill down" further into the information. An example of
this would be a report that lists customers. When the user clicks on a
particular customer, the invoices for that customer are displayed. Next,
when you click on a particular invoice, its line items (or details) can be
displayed.
Form This report helps to create preprinted forms that use company logos and
forms. Examples of this type include invoices.
Form
Letter
Forms letters, such as late notices and sales letters, are created using this
expert.
Labels
This expert allows you to create mailing labels that are any size and any
number of columns.
Standard The standard report is just that-a standard list report that lists your
information. It allows you to group and sort information, include formulas,
and set an overall format for the report. This is the report that will be
demonstrated for this How-To.
SubReport This report helps you to create main reports that utilize subreports. An
example is invoices for customers.
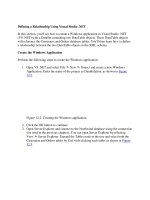
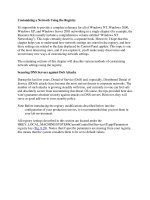
If the Standard report type is highlighted, click OK, and the Standard Report Expert
dialog opens, as shown in Figure 10.2.
Figure 10.2. The tabs on this dialog box are actually experts in their own rights.
Tabs Included in the Standard Report Wizard
Included on the Standard Report Wizard are the following tabs:
•
Data. Specify the database and table that you will be using for this report. You will
have a number of different choices from datasets within the current application to
OLEDB connections. For this chapter, you will be creating an OLEDB connection
to the Northwind database.
•
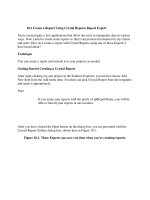
Fields. After you have selected your record source, you then get a list of the fields
from within your record source (see Figure 10.3).
Figure 10.3. Besides fields from your table, you can create formulas
(expressions) as well.
In addition to creating formulas, you can view the data using the Browse Data
option and locate fields using the Find Field option.
•
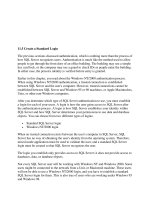
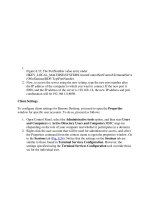
Group. This tab allows you to specify the group levels you want to include. An
example you will see here groups the customer by region (see Figure 10.4).
Figure 10.4. It is often useful to be able to organize your reports based on
groupings, such as the Region field in this report.