Reporting on Other Data Sources.
Bạn đang xem bản rút gọn của tài liệu. Xem và tải ngay bản đầy đủ của tài liệu tại đây (893.24 KB, 30 trang )
Reporting on Other
Data Sources
S
o far, we have done all our reporting projects using SQL Server data. But let me ask you a
question here; can we only develop reports using SQL Server data? I’m sure your answer is
“No” if you recall one of my notes from Chapter 1. There, I mentioned that it is a common
misconception that RS can only use SQL Server data.
All right, if SQL Server data is not the only data source available to us, which other data
sources can we use? In this chapter, we’ll explore those other data sources, and we will develop
reporting projects using data sources other than SQL Server.
In this chapter, you will
• Learn about data sources other than SQL Server
• Develop a report using Microsoft Access data
• Develop a report using XML data
• Develop a report using Oracle data
Exploring Other Data Sources
I
n r
eal-life business
scenarios, we have to deal with all sorts of different data sources. No mat-
ter if you are a small- or medium-sized company or a corporate giant, chances are you deal
with more than one data source. In such a challenging environment, you need a tool versatile
enough to seamlessly r
eport from all available data sources. The good news is that client-side
RS does just that.
You might be wondering how client-side RS does the job. Well, the answer is as simple as
the follo
wing statement: RS can use and report on data from any source that ADO.NET can
access.
Many different data sources qualify. Trust me, the list is exhaustive. Some are generic,
and some are proprietary. Covering every other data source that ADO.NET can connect to is
beyond the reach of this book. So, to illustrate reporting on other data sources, I picked three
of the most common ones:
329
CHAPTER 10
8547ch10final.qxd 8/30/07 3:44 PM Page 329
• Microsoft Access
• XML
•
Oracle
It is good to know that even though the data sources are different, the report development
process stays the same; you’ll only need to tweak the C# code according to the type of data
source you are using. Once the dataset is ready with data, every other step to develop reports
stays the same.
Before we start developing our reporting projects, I’d like to encourage you to learn the
techniques from this chapter and then try them with your favorite data source. So, if you have
a question like, “Can I report on data from a MySQL database?” Then my answer to you is,
“Yes.” Please check the following link for instructions to access MySQL with ADO.NET:
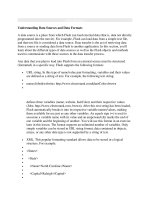
/>Reporting with MS Access Data
Let’s start with developing a simple tabular format report using MS Access data. Many small
applications still use this database as a data repository. It is also a favorite choice for tempo-
rary storage while further processing data gathered from large databases.
For the benefit of readers who have no knowledge of this software, Access is a relational
database management system from Microsoft. It was a stand-alone product in the beginning,
and later, it started to appear packaged with Microsoft Office. It combines the Jet relational
database engine with a graphical interface. The development environment provides
productivity-enhancing features for both advanced developers and beginning users. Please
check the following link for more information:
/>■
Note
JET stands for Joint Engine Technology. It is also referred as Microsoft JET Engine or simply Jet.
S
o
, what
r
eport would you like to develop using MS Access data? Well, the easy choice is to
use the famous
NorthWind sample that comes with Access. So here is the deal—to make this
section interesting, we’ll mimic the Alphabetical List of Products report, shown in Figure 10-1.
I
f y
ou
’
ve worked with MS Access previously, this is your chance to see how to develop the
same report using client-side RS.
So, the challenge is to produce a report that is similar to the one in Figure 10-1. Before we
mo
v
e on to dev
elop the client and report, let’s get hold of the
NorthWind sample database
.
Y
ou
can download the sample database from here:
/>➥
C6661372-8DBE-422B-8676-C632D66C529C&displaylang=EN
CHAPTER 10
■
REPORTING ON OTHER DATA SOURCES330
8547ch10final.qxd 8/30/07 3:44 PM Page 330
Figure 10-1. The Alphabetical List of Products report from the sample MS Access database
■
Note
You’ll need MS Access if you would like to see the report in Figure 10-1 in action.
Creating a Windows Forms Project
Please open Visual Studio, and use the following steps, illustrated in Figure 10-2, to create a
Windows application project:
1. Click F
ile
➤
N
ew
➤
P
r
oject, or pr
ess the hot keys Ctrl+S
hift+N.
2. I
n the
“
P
roject types” pane of the New Project dialog box, select Visual C#
➤
W
indo
ws.
3. In the Templates pane, select Windows Application.
4. Please give the application a name; I’ve called the project AccessReport. You may
choose a differ
ent location for stor
ing the application files according to your
pr
efer
ence
.
5. Click the OK button to finish the pr
ocess
. After y
ou click OK, Visual Studio will create a
new Windows application project. You’ll also notice that a new form with the name
Form1 is part of the project.
CHAPTER 10
■
REPORTING ON OTHER DATA SOURCES 331
8547ch10final.qxd 8/30/07 3:44 PM Page 331
Figure 10-2. Creating a new Windows application
If you have difficulty creating a Windows Forms project, then I’d advise you to revisit
Chapter 4 for detailed instructions. Let’s move on and add the dataset and ReportViewer to the
project. Let’s start by selecting the project in Solution Explorer; right-click it and select Add
➤
New Item
➤
DataSet. Please name the dataset dsAccess. Before you add the ReportViewer,
please make sure
Form1 is open in designer. Now, let’s add the ReportViewer to the project
from the drag and drop toolbox by selecting Data
➤
ReportViewer.
Please make sure you set the properties listed in Table 10-1. After you specify all the prop-
erties, your
Form1 should look similar to Figure 10-3.
Table 10-1. Property Settings for the Access Project
Object Property Value
Form1
Text
Reporting on MS Access Data
Form1
Size
790, 500
reportViewer1
Dock
Fill
CHAPTER 10
■
REPORTING ON OTHER DATA SOURCES332
8547ch10final.qxd 8/30/07 3:44 PM Page 332
Figure 10-3. The project after adding the dataset and ReportViewer
Step 1: Creating a Data Table
Since we already have the dataset in the project, it’s time to add a data table to it. Please use
the following steps to add a data table inside the dataset:
1. You can go to the dataset designer in two ways: double-click dsAccess inside Solution
Explorer, or right-click the
dsAccess node and select View Designer.
2. Let’s add the data table by right-clicking the design surface and selecting Add
➤
DataTable.
3. Click the header of the newly created data table, and name it dtAccess. Let’s start
adding columns to
dtAccess b
y r
ight-clicking the data table and selecting A
dd
➤
C
olumn.
4. P
lease add the follo
wing columns into the data table
, which should then look similar to
Figure 10-4:
•
ProductName (System.String)
•
CategoryName (System.String)
•
QuantityPerUnit (System.String)
•
UnitsInStock (System.Int32)
CHAPTER 10
■
REPORTING ON OTHER DATA SOURCES 333
8547ch10final.qxd 8/30/07 3:44 PM Page 333
Figure 10-4. Final look of the dtAccess data table
Step 2: Designing the Report Layout
Before we start with the layout design for the report, let’s take a moment to analyze the MS
Access report layout in Figure 10-1. What type of report items do you find in this report? Well,
as you know, there are different approaches to developing the report. I think we can replicate
this report by using a text box for the header, and for the body section, we can use a table. If
you have a different idea, give it a try after you practice this exercise.
All right, we have our dataset in place, with the data table and all necessary columns.
We’re all set to start working on designing the report layout. Add the report by selecting the
project in Solution Explorer and right-clicking it; select Add
➤
New Item, and select Report
from the Add New Item dialog box. Please name the report
rptAccess.rdlc. Click the Add but-
ton to complete the process and make the new report part of the project. You’ll also notice that
a new toolbox called Data Sources is available with our dataset information inside.
Adding a Header
Let’s add the header to the report; although the MS access report in Figure 10-1 also has a
footer, we’ll skip it in our report. As usual, adding a header is simple: right-click the open area
inside the report designer and select Page Header. Your report design surface should look sim-
ilar to Figure 10-5.
Figure 10-5. The report design surface with header and body sections
CHAPTER 10
■
REPORTING ON OTHER DATA SOURCES334
8547ch10final.qxd 8/30/07 3:44 PM Page 334
Setting Up the Page
According to the report’s needs, let’s set up the page. We need to make sure the report is letter-
s
ized and has a portrait page orientation. Right-click the open area inside the design surface,
and select Properties, where you may wish to put your name as the Author and add any infor-
mation about the report in Description. I’d advise you to let all other choices stay at the
defaults.
■
Note
Please make sure to set the properties Page Width to 8.5 inches and Page Height to 11 inches for a
letter-sized, portrait report.
Designing the Page Header
Now, we have added the header and the body sections to our report. As usual, you may start to
work on either of them first, but as we always do in this book, let’s work on the header first.
Please drag and drop the following report items inside the header section:
• A text box item for the report title
• A text box item for the report date
Report item properties are changed in one of the following two ways: by selecting the
report item, right-clicking it, and selecting Properties or by accessing the general properties
toolbox. Let’s change the properties; select each of the text box items in turn, and specify the
values for each report item’s properties according to Table 10-2.
Table 10-2. Report Item Properties for the Header
Report Item Property Value
textbox1
Name
txtReportTitle
Value
Alphabetical List of Products
Font
Normal, Arial, 10pt, Bold
textbox2
N
ame
txtDate
V
alue
=Today
Format
dd-MMM-yy
CHAPTER 10
■
REPORTING ON OTHER DATA SOURCES 335
8547ch10final.qxd 8/30/07 3:44 PM Page 335
Designing the Body Section
Let’s start working on this section by selecting Toolbox
➤
Report Items
➤
Table and dragging
a
nd dropping it inside the body section in the report designer. A new table item is part of the
report now, and it has the default name of
table1. To add one more column, right-click the
right-most column header on the table item, and select “Insert Column to the Right”.
You may choose your favorite method to map the data table’s column to the text box’s
report item(s): type an expression or drag and drop from the data source. Select Data Source
➤
dsAccess
➤
ProductName and drag and drop it inside the first column of the table item’s detail
section. Repeat this task for the rest of the columns in
dsAccess. Make sure your report design
surface looks similar to the one in Figure 10-6.
Figure 10-6. The report designer after adding the header and body sections
Even after adding the table item, we haven’t quite finished mimicking the MS Access
report. If you look at Figure 10-1 carefully, you may notice that the alphabetical list is reported
with the help of data grouping in the
ProductName column. You’ll also notice that the column
headers are repeated with every new letter of the alphabet.
So, now is the time to test the versatility of the table report item. We have to perform a
series of steps to change the table so it’ll mimic the output in Figure 10-1. Let’s begin by
adding a group. Select the Detail row, right-click it, and select Insert Group; the Grouping and
Sorting Properties dialog box will appear. Please make sure to select the General tab, and type
the following into the Expression field:
=LEFT(Fields!ProductName.Value,1). Please see
Figure 10-7 for an illustration of these steps.
CHAPTER 10
■
REPORTING ON OTHER DATA SOURCES336
8547ch10final.qxd 8/30/07 3:44 PM Page 336
Figure 10-7. Steps to add the first character from ProductName as an alphabetical data group
To match our desired report output, we need to remove a few rows from the table item
and introduce a few too. First, let’s talk about getting rid of rows. Because of the Insert Group
action, a group header and footer are part of the table now. Look at Figure 10-8; we need to
copy the content of the row labeled “a” to the row labeled “b,” because we want to repeat the
column headers with each new letter of the alphabet when the group change occurs. After the
copy, you’ll notice that a new group header is inserted with the same content as row “a”.
Next, select rows “a,” “d,” and “e,” and delete them.
Figure 10-8. Steps to add and remove the rows from the table report item
CHAPTER 10
■
REPORTING ON OTHER DATA SOURCES 337
8547ch10final.qxd 8/30/07 3:44 PM Page 337
A group can have more than one header and footer row. If you look at the MS Access
r
eport, each letter of the alphabet displays as a group title. To replicate in our report, we need
to add the title to the group’s first row. Click the first cell of the first row, and type the following
in the Expression field: =UCASE(LEFT(Fields!ProductName.Value,1)). You may also notice
that this is the same expression we used to group the data. The only difference here is the use
of the
UCASE() function to convert the output to uppercase letters. Figure 10-9 shows how to
add a title to a group header and verify that you’ve removed unwanted rows.
Figure 10-9. Steps to add the title to the group’s row header and verify the removal of rows
If you look at the title’s header expression, it is very simple. It takes the first character of
ProductName, by using the LEFT() function, and converts it to uppercase with the help of the
UCASE() function. To left indent the ProductName column, you’ll need to set the padding as
shown in Figure 10-9. I’ve also changed the font to make sure our output looks 100 percent
the same as the Access report.
Step 3: Writing the C# Code
Well, that’s all we need on the front end of the report design. Now, let’s add the following code
behind
Form1.cs to get data and see if we managed to mimic the report:
using System;
using System.Collections.Generic;
using System.ComponentModel;
using System.Data;
using System.Drawing;
using System.Text;
using System.Windows.Forms;
using System.Data.OleDb;
using Microsoft.Reporting.WinForms;
namespace AccessReport
{
public partial class Form1 : Form
{
CHAPTER 10
■
REPORTING ON OTHER DATA SOURCES338
8547ch10final.qxd 8/30/07 3:44 PM Page 338
public Form1()
{
InitializeComponent();
}
private void Form1_Load(object sender, EventArgs e)
{
// connection string
string cnString = @"Provider=Microsoft.Jet.OLEDB.4.0; Data
➥
Source=C:\Apress\chapter10\nwind.mdb;User Id=admin;Password=;";
// string builder for query text
StringBuilder sb = new StringBuilder();
sb.Append("SELECT Products.ProductName, Categories.CategoryName,
➥
Products.QuantityPerUnit, Products.UnitsInStock ");
sb.Append("FROM Categories INNER JOIN Products ON
➥
Categories.CategoryID = Products.CategoryID ");
sb.Append("ORDER BY Products.ProductName");
OleDbConnection conReport = new OleDbConnection(cnString);
OleDbCommand cmdReport = new OleDbCommand();
OleDbDataReader drReport;
DataSet dsReport = new dsAccess();
try
{
// open connection
conReport.Open();
cmdReport.CommandType = CommandType.Text;
cmdReport.Connection = conReport;
// get query string from string builder
cmdReport.CommandText = sb.ToString();
// execute query and load result to dataset
drReport = cmdReport.ExecuteReader();
dsReport.Tables[0].Load(drReport);
// close connection
drReport.Close();
conReport.Close();
// prepare report for view
reportViewer1.LocalReport.ReportEmbeddedResource
➥
CHAPTER 10
■
REPORTING ON OTHER DATA SOURCES 339
8547ch10final.qxd 8/30/07 3:44 PM Page 339
= "AccessReport.rptAccess.rdlc";
ReportDataSource rds = new ReportDataSource();
rds.Name = "dsAccess_dtAccess";
rds.Value = dsReport.Tables[0];
reportViewer1.LocalReport.DataSources.Add(rds);
// preivew the report
reportViewer1.RefreshReport();
}
catch (Exception ex)
{
MessageBox.Show(ex.Message);
}
finally
{
if (conReport.State == ConnectionState.Open)
{
conReport.Close();
}
}
}
}
}
■
Note
I used
Source=C:\Apress\chapter10\nwind.mdb
in the connection string; please change this to
the correct path of
nwind.mdb
on your local drive.
This code is almost the same as we’ve used in past reporting projects. However, the
main difference here is the use of
System.Data.OleDb. ADO.NET uses this connectivity to get
data from the A
ccess database.
You’ll also notice the use of
StringBuilder, which I used to
break the large
SELECT statement into smaller segments. This approach is preferred to
improve the string concatenation efficiency. Please check the following Web site for more
on
StringBuilder:
/>➥
en-us/cpref/html/frlrfsystemtextstringbuilderclasstopic.asp
Building the Project
It’s time to build the project now. You can click the small, green Play button in the main tool-
box or press F5 on the keyboard to start the application in run-time mode. If the program
compiles without any errors, you will see the form with the report in preview mode. Please
make sure the report looks similar to Figure 10-10.
CHAPTER 10
■
REPORTING ON OTHER DATA SOURCES340
8547ch10final.qxd 8/30/07 3:44 PM Page 340