Reporting with Visual Studio 2008 Windows Forms
Bạn đang xem bản rút gọn của tài liệu. Xem và tải ngay bản đầy đủ của tài liệu tại đây (950.91 KB, 24 trang )
Reporting with Visual Studio
2008 Windows Forms
I
n the past 13 chapters, you saw RS in action with a variety of different clients and learned
various techniques for developing cool reports. Chapter 13 concluded our discussion of
client-side RS, but there is one last topic we still have to look into—developing reports with
Visual Studio 2008 (yes, the release after VS 2005).
“Orcas” was the codename for the upcoming release of Visual Studio. As I was working on
this book, VS 2008 was still in community preview, and stable client-side RS functionality was
provided in the beta 1 release of VS 2008. Therefore, I decided to include two chapters to let
you know how VS 2008 interacts with client-side RS.
I’m sure many questions might be popping up in your mind now. How different is report
development in VS 2008 compared with VS 2005? Can I use the knowledge from the past 13
chapters to my advantage and develop similar reports with VS 2008? Not to worry! The good
news is almost all the reports we developed so far can be created with VS 2008 in a similar
fashion. To prove it, I’ll show you how to develop VS 2008 reports with Windows Forms in this
chapter, and in the last chapter of this book, you’ll learn to develop reports with VS 2008 using
ASP.NET Web Forms.
This chapter will cover
• Developing VS 2008 reports using Windows Forms
• Developing reports using Report Wizard
Developing VS 2008 Reports Using
Windows Forms
The steps needed
to create a Windows Forms client with VS 2008 are similar to those for
creating with one with VS 2005. Sure, there will be some product enhancements in VS 2008.
However, both the IDEs are much the same when it comes to developing the client-side
r
eports. One cool addition to VS 2008 is Report Wizard; the next section of this chapter
shows Report Wizard in action!
407
CHAPTER 14
8547ch14final.qxd 8/30/07 3:36 PM Page 407
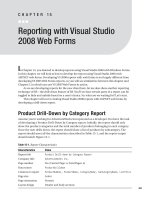
Product Profitability Report
You’re working for AdventureWorks, Incorporated as a developer. You have the task of develop-
ing a Product Profitability report. Along with product pricing details, you also need to show
p
rofit on each product as an individual pie chart. The report should meet all the characteris-
tics described in Table 14-1, and the report output should match Figure 14-1.
Table 14-1. Report Characteristics
Characteristics Value
Report title Product Profitability Report
Company title AdventureWorks Inc.
Print date Yes
Page number Yes (Page: n/n)
Data source
tblProductProfit
Columns to report ProductName, ListPrice, CostPrice, ProfitAmount
Page siz
e Letter
Page orientation Portrait
Layout design Header and body sections
Figure 14-1. The Product Profitability report
CHAPTER 14
■
REPORTING WITH VISUAL STUDIO 2008 WINDOWS FORMS408
8547ch14final.qxd 8/30/07 3:36 PM Page 408
Business Case
We know the prime objective of business is to make a profit. Every product has a base cost,
which is the cost of the purchase, the cost of the manufacturing, or both. Businesses must set
a
list price for the product that includes the profit markup on top of the cost.
Folks in sales and marketing departments especially look for reports like the Product Prof-
itability report to check on how much profit margin each product contributes. This report also
helps them to make important decisions, like adjusting the list price for big orders to attain a
suitable profit.
Getting the Windows Forms Application Ready
Please open Visual Studio, and use the following steps, illustrated in Figure 14-2, to create a
Windows application project:
1. Click File
➤
New
➤
Project, or press the hot keys Ctrl+Shift+N.
2. In the “Project types” pane of the New Project dialog box, select Visual C#
➤
Windows.
3. In the Templates pane, select Windows Forms Application.
4. Please give the application a name; I’ve called the project ProductProfit. You may
choose a different location for storing the application files according to your prefer-
ence. Visual Studio 2008 lets you choose your target .NET Framework; I want you to
select .NET Framework 2.0, as we have used this framework through this book (it is OK
to choose 3.0 or 3.5 also if you wish to create the Windows Forms application).
5. Click the OK button to finish the process. After you click OK, Visual Studio will create a
new Windows Forms application project. You’ll also notice that a new form with the
name
Form1 is part of the project.
Similar to the way we did in the past reporting projects, its time to add the dataset and
ReportViewer. Let’s start by selecting the project in Solution Explorer, right-clicking it, and
selecting Add
➤
New Item
➤
DataSet. Please name the dataset dsProductProfit. Before you
add the ReportViewer, please make sure that
Form1 is open in the designer. Now, add the
ReportViewer to the project by dragging Data
➤
ReportViewer from the toolbox and dropping
it onto the design surface.
CHAPTER 14
■
REPORTING WITH VISUAL STUDIO 2008 WINDOWS FORMS 409
8547ch14final.qxd 8/30/07 3:36 PM Page 409
Figure 14-2. Creating a new Windows application
Please make sure you set the properties in Table 14-2. After you specify all the properties,
your
Form1 should look similar to Figure 14-3.
Table 14-2. Property Settings for ProductProfit Project
Object Property Value
Form1 Text Product Profitability Report
Form1
Size 790, 500
reportViewer1 Dock Fill
CHAPTER 14
■
REPORTING WITH VISUAL STUDIO 2008 WINDOWS FORMS410
8547ch14final.qxd 8/30/07 3:36 PM Page 410
Figure 14-3. The project after adding the dataset and ReportViewer
Step 1: Creating a Data Table
Since we already have the dataset in the project, it’s time to add a data table to it. Please use
the following steps to add a data table inside the dataset:
1. You can go to the dataset designer in two ways: double-click dsProductProfit inside
Solution Explorer, or right-click the
dsProductProfit node and select View Designer.
2. Let’s add the data table by right-clicking the design surface and selecting Add
➤
DataTable.
3. Click the header of the newly created data table, and name it dtProductProfit. Let’s
start adding columns to
dtProductProfit by right-clicking the data table and selecting
A
dd
➤
C
olumn.
4. Please add the following columns into the data table, which should then look similar to
Figure 14-4:
•
ProductName (System.String)
•
ListPrice (System.Double)
•
CostPrice (System. Double)
•
ProfitAmount (System. Double)
CHAPTER 14
■
REPORTING WITH VISUAL STUDIO 2008 WINDOWS FORMS 411
8547ch14final.qxd 8/30/07 3:36 PM Page 411
Figure 14-4. Final look of the data table dtProductProfit
Step 2: Designing the Report Layout
Before we start with the layout design for the report, let’s take a moment to analyze the report
layout shown in Figure 14-1. The report lists information consisting of four different columns.
What makes this report interesting are the individual pie charts showing the profit ratio for
each of the products.
We’re all set to work on designing the report layout. Let’s start adding the report by select-
ing the project in Solution Explorer, right-clicking it, and selecting Add
➤
New Item. Select
Report in the Add New Item dialog box
. Please name the report rptProductProfit.rdlc. Click
the Add button to complete the process and add a new report to the project.
Adding a Header
Let’s add the header to the report. As usual, adding a header is simple; all you have to do is
right-click the open area inside the report designer and select Page Header. After completing
the action, your report design surface should look similar to the one shown in Figure 14-5.
Figure 14-5. The report designer with header and body sections
Setting Up the Page
According to the report’s needs, let’s set up the page. We need to make sure the report is letter
size and has a portrait page orientation. Right-click the open area inside the design surface,
and select P
roperties; you may wish to put your name in the Author field and information
about the report in the Description field.
CHAPTER 14
■
REPORTING WITH VISUAL STUDIO 2008 WINDOWS FORMS412
8547ch14final.qxd 8/30/07 3:36 PM Page 412
Designing the Page Header
Now, we have the header and the body sections added to our report. As usual, you may decide
t
o work on any of them first; but as we do always, let’s work on the header first. Please drag the
following report items from the toolbox and drop them inside the header section:
• TextBox item for the report title
• TextBox item for the company title
• TextBox item for the report date
• TextBox item for the page number
• TextBox item for the product name heading
• TextBox item for the list price heading
• TextBox item for the cost price heading
• TextBox item for the profit amount heading
• TextBox item for the graph heading
Report item properties are changed by right-clicking the report item and selecting Prop-
erties or by accessing the general properties toolbox. Let’s start changing the properties; after
selecting each of the text boxes, please specify the values for each according to Table 14-3.
Table 14-3. Report Item Properties for the Header
Report Item Property Value
textbox1
Value Product Profitability Report
Font Italic, Arial, 10pt, Bold
textbox2
Value AdventureWorks Inc.
TextAlign Right
textbox3
Value = "Print Date: " & Today
textbox4
—
— Value
="Page: " & Globals!PageNumber & "/" & Globals!TotalPages
— TextAlign Right
textbox5
——
—
V
alue
Product Name
textbox6
—
—
— Value
List Price
textbox7
——
Continued
CHAPTER 14
■
REPORTING WITH VISUAL STUDIO 2008 WINDOWS FORMS 413
8547ch14final.qxd 8/30/07 3:36 PM Page 413
Table 14-3. Continued
Report Item Property Value
—
Value
C
ost Price
textbox8
——
— Value
Profit Amount
textbox9
——
—
Value
G
raph
— Format N
textbox6
to textbox9 ——
— TextAlign
Right
textbox6
to textbox8 ——
Format N
Designing the Body Section
A table report item is the usual choice for tabular reports like this. However, this time, I’ll show
you how you can use a list report item for a tabular format report. Let’s start by dragging
Report Items
➤
List from the toolbox and dropping it inside the body section on the report
designer to add a new list item with the default name of
list1 to the report.
When you use a list item, all you get is a container into which you can drop other report
items for the list. Therefore, to display a list of products and prices, we need a text box inside
the newly added list. As you did for this report header, drag and drop four text boxes inside
list1. Please make sure to align them according to their headings, which we already put in the
header section. Your report design should look similar to the one shown in Figure 14-6.
Figure 14-6. The report designer after adding the list and its text boxes
You’re probably wondering where the pie chart is. Well, in the next section we are going to
add the pie char
t. F
irst, let’s properly set all properties of the text boxes inside
list1. P
lease
make sure all text box values match those in Table 14-4.
CHAPTER 14
■
REPORTING WITH VISUAL STUDIO 2008 WINDOWS FORMS414
8547ch14final.qxd 8/30/07 3:36 PM Page 414
Table 14-4. Text Box Values Inside list1
List Detail Textbox Value
P
roduct Name
=
Fields!ProductName.Value
List Price =Fields!ListPrice.Value
Cost Price =Fields!CostPrice.Value
Profit Amount =Fields!ProfitAmount.Value
Add a Chart Report Item to list1
Adding chart items is easy and is the same as adding the text boxes. So, let’s drag and drop a
chart item inside
list1. The first time you drop the chart item, it will increase the size of the
Detail section, and it will have a Column type setting. You can change the type by right-
clicking the chart item and selecting Chart Type
➤
Pie
➤
Simple Pie.
We need both the List Price and Profit Amount columns’ data as plot data for our pie
chart. Let’s start by dragging Data Source
➤
dsProductProfit
➤
ListPrice from the toolbox
and dropping it at the “Drop data fields here” prompt. Please repeat for the
ProfitAmount col-
umn; make sure your report design surface looks like the one shown in Figure 14-7 after you
drop the plotting data on the chart item.
Figure 14-7. The report designer after specifying plot data on the chart
When we add the chart item, the legend appears automatically. For this report, we don’t
need the legend, as the siz
e of chart is small. We can hide the legend by right-clicking the chart
item and selecting Properties. Next, select the Legend tab, uncheck “Show legend,” and click
OK to complete the process. Please see Figure 14-8 for an illustration of these steps.
CHAPTER 14
■
REPORTING WITH VISUAL STUDIO 2008 WINDOWS FORMS 415
8547ch14final.qxd 8/30/07 3:36 PM Page 415