Socioeconomic and demographic correlates of self rated health among adults in Alkharj Area KSA, 2017
Bạn đang xem bản rút gọn của tài liệu. Xem và tải ngay bản đầy đủ của tài liệu tại đây (183.61 KB, 9 trang )
International Journal of Management (IJM)
Volume 11, Issue 3, March 2020, pp. 166–174, Article ID: IJM_11_03_018
Available online at />Journal Impact Factor (2020): 10.1471 (Calculated by GISI) www.jifactor.com
ISSN Print: 0976-6502 and ISSN Online: 0976-6510
© IAEME Publication
Scopus Indexed
SOCIOECONOMIC AND DEMOGRAPHIC
CORRELATES OF SELF RATED HEALTH
AMONG ADULTS IN ALKHARJ AREA KSA, 2017
Dr. Ayman Mahgoub
College of Business Administration
Prince Sattam Bin Abdulaziz University, Saudi Arabia
ABSTRACT
Aim: Self Rated Health (SRH) is a widely used measure of subjective assessment
of health status. SRH has been found to carry predictive validity concerning future
mortality among diseased and healthy individuals. Several socioeconomic and
demographic characteristics of individuals found to have an association with their
overall assessment of health. The objectives of this study are to estimate the
proportion of the healthy adult population using SRH measure and to identify the
socioeconomic, demographic and health correlates of SRH among the adult
population.
Methods: A cross-sectional study was conducted in the Alkharj area in the center
of Saudi Arabia, using a questionnaire comprising the basic questions relating to SRH
and the socioeconomic and demographic correlates of SRH. Univariate and logistic
regression models were carried out to analyze the data.
Results: Mode of living, age class, education, marital status, the prevalence of
diseases and risky behavior of individuals were significantly associated with SRH in
the study area. Individuals with diabetes and those who drink alcohol were more likely
to be unhealthy compared with other individuals in the sample.
Conclusion: The results reveal a correlation between socioeconomic and
behavioral factors with SRH; these factors should be given high priority in the setting
of health strategies and policies.
Keywords: Self Rated Health, Cross-sectional, Adults in Alkharj, Saudi Arabia
Cite this Article: Dr. Ayman Mahgoub, Socioeconomic and Demographic Correlates
of Self Rated Health among Adults in Alkharj Area KSA, 2017, International Journal
of Management (IJM), 11 (3), 2020, pp. 166–174.
/>
/>
166
Dr. Ayman Mahgoub
1. INTRODUCTION
The concept of self-rated health (SRH) is considered a multidimensional concept that refers to
an individual's assessment and perception of his\her own health status. The concept has been
widely used in health surveys in recent decades. Of note, it is an inexpensive instrument and it
also has trusted reliability among all age groups, for both men and women (Liang, 1986;
Bombak, 2013). During the past decades, SRH has been increasingly involved in the national
and international public health monitoring and has been recommended as a standard part of
health surveys. Also, SRH has been used to measure clinical outcomes in epidemiological
studies (Robine et al., 2003). Currently, it is proposed to be a critical tool in the clinical
assessment as well as the primary prevention screening procedures (Bombak, 2013).
Changing the life situation and lifestyle as well as the characteristics of individuals
proposed to have an association with the overall health condition. SRH has been found to
carry a predictive validity concerning future mortality, not only among diseased but also
among healthy individuals. Several socioeconomic and demographic characteristics of
individuals found to have an association with their overall assessment of health (Idler &
Benyamini, 1997 ; Strawbridge & Wallhagen, 1999). A consistent inverse association was
stabilized by age, sex and social status (Miilunpalo et al., 1997). Moreover, socioeconomic
status was proved to influence the health status that may also attribute to psychosocial wellbeing (Richter et al., 2012; Moor et al., 2017). Various characteristics may affect the SRH; the
age of specific gender, mode of living, educational level, marital status, work status, type of
work, frequent diseases, as well as risky behavior of individuals such as smoking and obesity.
The prevalence of harming health owing to demographic characteristics or socioeconomic
status are considered to be high in the United States and the UK, especially the individuals
with low income who were more likely to report poor/fair health (Kennedy et al., 1998 ;
Weich et al., 2002). However, it is still under-studied in KSA.
We conducted this study specifically in the Alkharj Area, because of its economical,
strategical, and cultural importance in the Kingdome of Saudi Arabia.
2. OBJECTIVES
The objectives of this present study are to estimate the proportion of the healthy adult
population in the Alkharj area in the Kingdom of Saudi Arabia using SRH measure and to
identify the socioeconomic, demographic and health correlates of SRH among this
population.
3. HYPOTHESES
•
•
•
The mode of living is positively associated with the SRH.
The age groups of the cases will be significantly associated with SRH; older cases will
have less SRH than younger cases.
The educational level, work status, and socioeconomically status were positively
associated with the SRH.
4. METHODS AND MATERIALS
4.1. Participants
A survey had been carried out to obtain the primary data needed to estimate a healthy
population using the SRH method covering all the study areas in the Alkharj area. Al Kharj,
also known locally as Al Saih, is a city in Al Kharj Governorate in central Saudi Arabia. The
total population of the area is 425300 individuals.
/>
167
Socioeconomic and Demographic Correlates of Self Rated Health among Adults in Alkharj Area
KSA, 2017
4.2. Questionnaire
Our primary exit was to measure SRH through a few simple questions. Respondents were
asked to indicate how they rate their health in general and/or in comparison with other people
of their age. The key question in SRH is "How would you describe your state of health these
days or this year", Usually, SRH is measured on a five Points Likert-scale, with options been;
"1 = very good, 2 = good, 3 = moderate, 4 = bad, 5 = very bad ", whereas 1,2,3 recorded in
the tables as “healthy” and 4,5 recorded as “non-healthy”.
The household questionnaire used was consistent of limited and specific questions that
were asked to the head of the household and covered the following dimensions: (i)
demographic characteristics: gender and age, (ii) social characteristics: mode of living,
education, and maritime status, (iii) economic characteristics: occupation of the head of
household, daily consumption, and work status, and (iv) health characteristics: health status,
disability, diseases and risky behaviors such as smoking, obesity, and drinking.
4.3. Sample Size
The equation to determine the simple random sampling was used depending on the population
proportion, the equation takes the following form (Cochran, 1963) :
n *=
z 2 * p * (1 − p)
d2
Where:
n *: the initial sample size.
Z: the standard variable of the normal distribution corresponding to a 95% confidence level.
P: the anticipated population distribution of good SRH.
D: the absolute statistical precision on either side of the anticipated population proportion.
By taking P = 50% which gives the maximum possible sample size and d = 0.05 then, the
initial sample size will be:
4 * 0.5* 0.5
= 400
0.0025
However, in the actual field survey, simple random sampling was not the method of data
collection and the clustered random sampling had been used, this requires multiplying the
sample size by the design effect which taken to be (2), hence, the actual sample size was
calculated at 800.
The response rate was about 75%; the sample was collected from the 800 participants
through face to face questionnaire, in many clusters, such as universities, government
associations, NGOs, markets and streets.
4.4. Data Analysis
Analysis of the data was conducted using SPSS for Windows (IBM SPSS Statistics Version
20.0 Released 2011 Armonk, NY: IBM Corp.) and Excel software. Different methods of
analysis were carried out to meet the study objectives including estimation of healthy
proportion using SRH measure, the descriptive statistics, the inferential statistics which
include the Chi-square test, and the binary logistic regression model (Hosmer & Lemeshow,
2000).
/>
168
Dr. Ayman Mahgoub
5. RESULTS
5.1. The Association between SRH and Socioeconomic Status and Demographic
Characteristics
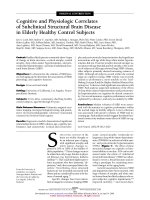
The results reveal that no significant association was found between SRH and mode of living,
as shown in the (table 1), so that, the percentages of healthy respondents were (90.8%) and
(89.6%) in urban and rural areas respectively, which indicates indifference in SRH according
to the mode of living in the study area.
SRH has a highly significant correlation with the gender of respondents, males have a
higher percentage of good SRH (91.8%) compared with (88.1%) for females, as the P-value
was (<0.001).
The results also depict that the percentage of good SRH differs significantly with age
groups, among the different age groups, the lowest percentage was calculated at (63.7%)
among those individuals older than 65 years, the highest percentage was calculated at (92.9%)
among those individuals with 15-64 years, whereas, the percentage of good SRH among
children under 15 years was calculated at (87.9%). Generally, the percentage of good SRH
declined significantly with increasing age, as the P-value was (<0.001).
Statistically significant association was found between SRH and educational level; the
results indicate a positive correlation between the two variables. The higher the educational
level implies the higher the percentage of good SRH, as the P-value was (<0.001).
Interestingly, there was also a significant association between SRH and marital status of
respondents, the lowest percentage was calculated at (59.5%) among those widowed
individuals, the highest percentage was calculated at (95.6%) among divorced individuals,
whereas, the percentage of good SRH among single individuals was calculated at (93.2%), as
shown in (table 1), as the P-value was (<0.001). These results are interesting, maybe they are
because the divorced people were suffering from many problems during their marriage life,
and then after they divorced maybe the distressing problems are gone, so they will feel better
than before.
Table 1 Distribution of SRH by socioeconomic and demographic characteristics of sample individuals
%
Variable
Mode of Living
Gender
Age Class
Education
Marital Status
Work Status
Urban
Rural
Male
Female
Less 15
15-64
65+
Illiterate
Basic
Secondary
University
NA
Single
Married
Divorced
Widowed
NA
Yes
No
NA
Healthy
N=
720
90.8
89.6
91.8
88.1
87.9
92.9
63.7
69.4
88.5
93.1
94.7
84.6
93.2
88.7
95.6
59.5
89.0
92.5
89.2
88.5
Unhealthy
N=
9.280
10.4
8.2
11.9
12.1
7.1
36.3
30.6
11.5
6.9
5.3
15.4
6.8
11.4
4.4
40.5
11.0
7.5
10.8
11.5
χ2
P-value
2.066
0.151
19.863
<0.001*
239.285
<0.001*
176.586
<0.001*
63.074
<0.001*
16.428
<0.001*
*significant P value.
/>
169
Socioeconomic and Demographic Correlates of Self Rated Health among Adults in Alkharj Area
KSA, 2017
SRH and work status were significantly associated, the percentage was calculated at
(89.2%) among individuals who were not working in a period of 12 months before the survey
was conducted, whereas, the percentage was calculated at (92.5%) among those individuals
who were working in the same period, as shown in (table 1), as the P-value was (<0.001).
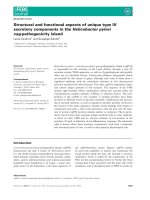
5.2. The Association between SRH and Disease Prevalence and Risky Behavior
SRH and prevalence of the “diagnosed” diseases were significantly associated, the lowest
percentage was calculated at (48.1%) among those individuals who suffer from diabetes,
whereas the percentage was calculated at (93.6%) among free-diseases individuals, as the Pvalue was (<0.001).
SRH also had a significant relationship with risky behaviors of respondents, the lowest
percentage was calculated at (57.1%) among those individuals drink, whereas the highest
percentage was calculated at (93.6%) among free-risk behavior respondents, as shown in
(table 2), as the P-value was (<0.001).
Table 2 Distribution of SRH by risky behavior of sample individuals
%
Variable
Diseases
Risky Behavior
Pneumonia
Diabetes
Others
None
Smoking
Drinking
Obesity
None
Healthy
81.6
48.1
73.0
96.4
89.8
57.1
84.6
93.6
Unhealthy
18.4
51.9
27.0
3.6
10.2
42.9
15.4
6.4
χ2
P-value
48.525
<0.001*
28.854
<0.001*
*significant P value.
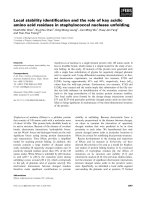
5.3. Relationship between variables and SRH
The results of the binary logistic regression model for SRH as a dependent variable and the
socioeconomic, demographic and health characteristics of study responders as independents
variables are provided in (table 3). The overall model was significant at a 1% level as
indicated by 22 statistics. The dependent variable coded (1) for the unhealthy state of the
respondent and (0) for a healthy state.
The odds ratio of the mode of living variable suggests that those responders who live in
rural areas were (1.506) times more likely to be unhealthy compared with urban residents
(reference category), as the P-value = 0.010.
The OR for the gender variable confirms the significant effect of gender on SRH, females
were (1.363) times more likely to be unhealthy compared with males, as the P-value = 0.014.
About age, individuals in the older age group (65+) were (3.181) times more likely to be
unhealthy compared with the reference category (<15), as the P-value > 0.001.
The results of logistic regression for education variable was ensured the positive
correlation between educational level and good SRH, those responders with basic educational
level were (65%) as likely to be in an unhealthy state compared with illiterates individuals
(the reference category), as the P-value = 0.048, whereas the individuals with tertiary
educational level were only (30%) as likely to be unhealthy compared with illiterates
responses, as the P-value > 0.001.
/>
170
Dr. Ayman Mahgoub
The only significant category for the variable of marital status was the widowed
individuals who were (2.884) times more likely to be unhealthy compared with the single
respondents as a reference category, as the P-value = 0.018.
Regarding the diseases among responders, pneumonia infected respondents were (5.113)
times more likely to be unhealthy compared with the reference category, as the P-value >
0.001, while those individuals who were suffering from diabetes were (28.112) times more
likely to be unhealthy compared with free-diseases individuals, as the P-value > 0.001.
Smoking and drinking alcohol were significantly affecting SRH, smokers individuals
were (1.724) times more likely to be unhealthy compared with free-risky behaviors
individuals (the reference category), as the P-value = 0.012, while those individuals who
drank alcohol were (7.094) times more likely to be unhealthy compared with the reference
category, as the P-value = 0.003.
Table 3. Odd Ratio of Binary Logistic Regression, SRH (1= unhealthy)
variable
Odds Ratio
p value
Mode of Living (1=Rural)
1.506
0.010*
Gender (1= female)
1.363
0.014*
Age Class
Education
Marital Status
Diseases
Risky Behavior
Work Status
Less 15
1.000 (ref)
15-64
1.237
0.365
<0.001*
65+
3.181
Illiterate
1.000 (ref)
Basic
0.654
0.048*
Secondary
0.393
<0.001*
University
0.306
<0.001*
0.802
NA
1.071
Single
1.000 (ref)
Married
1.118
0.485
Divorced
2.237
0.292
Widowed
2.884
0.018*
NA
2.197
0.003*
Pneumonia
5.113
<0.001*
Diabetes
28.112
<0.001*
Others
12.333
<0.001*
None
1.000 (ref)
Smoking
1.724
0.012*
Drinking
7.094
0.003*
Obesity
1.567
0.655
None
1.000 (ref)
Yes
1.000 (ref)
No
1.372
0.058
NA
2.000
0.022*
*significant P value.
6. DISCUSSION
This cross-sectional study aimed to estimate the proportion of healthy and unhealthy adults
and to explore the socioeconomic, demographic and health correlates of SRH. Our findings
relived the available evidence of gender, age, material status, education and behavioral factors
that could contribute to affect the health status among our population in the Alkharj area in
/>
171
Socioeconomic and Demographic Correlates of Self Rated Health among Adults in Alkharj Area
KSA, 2017
KSA. Our findings suggest outlining the possible risk factors for unhealthy SRH, that include
living in rural areas, female gender, older age group (65+), individuals with basic educational
level and widowed individuals as well as smokers, obese personnel, and who drinks alcohol.
In spite of the significant difference between individual categorized based on work status,
work status of respondents did not have any statistically significant effect on SRH.
In a national health survey in Pakistan including 18135 individuals between 1990 and
1994, the authors concluded that older age groups more than 20 years, female gender, living
in rural areas, low and middle socioeconomic status, illiterate individuals, widow or divorced
individuals and current smoking participants are risk factors for poor/fair SRH. However,
work status was not investigated in this study (Ahmad, 2005).
In a short report of Spanish National Health Interview Surveys among 2261 adolescents, it
was found that smoking is associated with suboptimal self-perceived health and health
problems (Rius et al., 2004). Our study showed that smokers are 1.7 times more likely to have
unhealthy SHR. Regarding gender, our results showed a significant difference between males
and females, with a significant effect of female gender on unhealthy SRH, which is consistent
with another cross-sectional report. This study was carried out among 6997 School-aged
Children; the risk of having poor self-rated health was higher in low affluent girls than low
affluent boys (Richter et al., 2012). In Europe, socio-economic status was found to affect SHR
through several factors, concerning material and occupational conditions (Aldabe et al.,
2011). In a comprehensive survey in Norwegian, lower education was attributed to poor
health which suggested a deep focus on this particular group to improve the material and
psychosocial conditions as well as the cessation of smoking (Kurtze et al., 2013). In a recent
systematic review that included publications between 1996 and 2016, the results showed the
dual role of material factors on self-rated health including its direct and indirect effect,
through psychosocial and behavioral factors which indicated an improvement in the material
circumstances among lower affluent groups (Moor et al., 2017). Regarding marital status, our
results revealed a significant difference among all marital status categories; however, only
widowed individuals were more likely to be unhealthy in comparison to single persons. This
may have been explained by the protective and supportive role of marriage. It was also found
that the duration of widowhood could have a negative impact on the health and the risk to
develop diabetes, psychological distress and worse SRH (Perkins et al., 2016).
The prediction value of SRH was significantly associated with the prevalence of diseases
in our study, diabetes, and pneumonia infected respondents were more likely to have
unhealthy SRH. Singh-Manoux et al. deduced that SRH is a good predictor of mortality
especially along with the short term (Singh et al., 2007). Also, literature review and large
wide analytic studies are consistent with the aforementioned findings that SHR could predict
mortality more than the diagnosed disease phase (Idler& Benyamini, 1997 ; Strawbridge &
Wallhagen, 1999). Also, it is currently found that subjective SHR is the best predictor of
retirement over than diagnosed disease since physical and mental fatigue could be decreased
and health conditions may improve after retirement (Nilsson et al., 2016 ; Laaksonen et al.,
2012).
This is the first study to investigate SHR value and the potential variables affecting its
score in the Alkharj area in KSA. However, our study has several limitations; (1) we did not
have any information regarding participants’ health on an extended follow-up, (2) lack of
random sampling plan, hence the results represent the studied area, not all KSA. (3)
Participants ‘age was varied which may affect other parameters.
/>
172
Dr. Ayman Mahgoub
7. CONCLUSION
Population health is one of the essential components of human development. The study of the
health status of individuals and the impact of various diseases on mortality and disability is
essential for health prevention planning and health promotion. The importance of this study
stems from the value of identifying the variables correlated with the overall health of
individuals. The study also achieved a pioneering step in applying the concept of self-rated
health in the study area as well as identifying the socioeconomic, demographic and health
correlates of self-rated health. This study revealed that the mode of living, age class,
education, marital status, the prevalence of diseases and risky behavior of individuals were
significantly associated with SRH in the study area. Also, individuals with diabetes and those
who drink alcohol were more likely to be unhealthy compared with other individuals in the
sample. Restrict follow-up and preventive measures are highly recommended in high-risk
groups.
ACKNOWLEDGMENT
This project was supported by the Deanship of Scientific Research at Prince Sattam Bin
Abdulaziz Unversity under the research project 2017/02/7565.
REFERENCES
[1]
Ahmad, K., Jafar, T. H., & Chaturvedi, N. (2005). Self-rated health in Pakistan: results of
a national health survey. BMC public health, 5(1), 51.
[2]
Aldabe, B., Anderson, R., Lyly-Yrjänäinen, M., Parent-Thirion, A., Vermeylen, G.,
Kelleher, C. C., & Niedhammer, I. (2011). Contribution of material, occupational, and
psychosocial factors in the explanation of social inequalities in health in 28 countries in
Europe. J Epidemiol Community Health, 65(12), 1123-1131.
[3]
Bombak, A. E. (2013). Self-rated health and public health: a critical perspective. Frontiers
in public health, 1, 15.
[4]
Cochran 2nd, W. G. Sampling techniques 2nd Edition, 1963 New York.
[5]
Hosmer, D. W., & Lemeshow, S. (2000). Applied Logistic Regression. John Wiley &
Sons. New York.
[6]
Idler, E. L., & Benyamini, Y. (1997). Self-rated health and mortality: a review of twentyseven community studies. Journal of health and social behavior, 21-37.
[7]
Kennedy, B. P., Kawachi, I., Glass, R., & Prothrow-Stith, D. (1998). Income distribution,
socioeconomic status, and self rated health in the United States: multilevel analysis. Bmj,
317(7163), 917-921.
[8]
Kurtze, N., Eikemo, T. A., & Kamphuis, C. B. (2013). Educational inequalities in general
and mental health: differential contribution of physical activity, smoking, alcohol
consumption and diet. The European Journal of Public Health, 23(2), 223-229.
[9]
Laaksonen, M., Metsä-Simola, N., Martikainen, P., Pietiläinen, O., Rahkonen, O., Gould,
R., ... & Lahelma, E. (2012). Trajectories of mental health before and after old-age and
disability retirement: a register-based study on purchases of psychotropic drugs.
Scandinavian journal of work, environment & health, 409-417.
[10]
Liang, J. (1986). Self-reported physical health among aged adults. Journal of
Gerontology, 41(2), 248-260.
[11]
Miilunpalo, S., Vuori, I., Oja, P., Pasanen, M., & Urponen, H. (1997). Self-rated health
status as a health measure: the predictive value of self-reported health status on the use of
/>
173
Socioeconomic and Demographic Correlates of Self Rated Health among Adults in Alkharj Area
KSA, 2017
physician services and on mortality in the working-age population. Journal of clinical
epidemiology, 50(5), 517-528.
[12]
Moor, I., Spallek, J., & Richter, M. (2017). Explaining socioeconomic inequalities in selfrated health: a systematic review of the relative contribution of material, psychosocial and
behavioural factors. J Epidemiol Community Health, 71(6), 565-575.
[13]
Nilsson, K., Hydbom, A. R., & Rylander, L. (2016). How are self-rated health and
diagnosed disease related to early or deferred retirement? A cross-sectional study of
employees aged 55-64. BMC public health, 16(1), 886.
[14]
Perkins, J. M., Lee, H. Y., James, K. S., Oh, J., Krishna, A., Heo, J., & Subramanian, S. V.
(2016). Marital status, widowhood duration, gender and health outcomes: a cross-sectional
study among older adults in India. BMC public health, 16(1), 1032.
[15]
Richter, M., Moor, I., & van Lenthe, F. J. (2012). Explaining socioeconomic differences
in adolescent self-rated health: the contribution of material, psychosocial and behavioural
factors. J Epidemiol Community Health, 66(8), 691-697.
[16]
Rius, C., Fernandez, E., Schiaffino, A., Borras, J. M., & Rodríguez-Artalejo, F. (2004).
Self perceived health and smoking in adolescents. Journal of Epidemiology & Community
Health, 58(8), 698-699.
[17]
Robine, J. M., Jagger, C., & Euro-Reves Group. (2003). Creating a coherent set of
indicators to monitor health across Europe: the Euro-REVES 2 project. European Journal
of Public Health, 13(suppl_3), 6-14.
[18]
Singh-Manoux, A., Guéguen, A., Martikainen, P., Ferrie, J., Marmot, M., & Shipley, M.
(2007). Self-rated health and mortality: short-and long-term associations in the Whitehall
II study. Psychosomatic medicine, 69(2), 138.
[19]
Strawbridge, W. J., & Wallhagen, M. I. (1999). Self-rated health and mortality over three
decades: results from a time-dependent covariate analysis. Research on Aging, 21(3), 402416.
[20]
Wei, L., Xu, X., Gurudayal, Bullock, J., & Ager, J. W. (2019). Machine Learning
Optimization of p-Type Transparent Conducting Films. Chemistry of Materials, 31(18),
7340-7350.
[21]
Weich, S., Lewis, G., & Jenkins, S. P. (2002). Income inequality and self rated health in
Britain. Journal of Epidemiology & Community Health, 56(6), 436-441.
[22]
Deni Nurdyana Hadimin and Yanyan Mochamad Yani, (2018), Democratization and
Strengthening Local Politics Perspectives of Socioeconomic Standard in New Democracy
Country. International Journal of Civil Engineering and Technology, 9(3), pp. 248-258
[23]
WS Ebhota, (2019), Photovoltaic Solar Scheme in Sub Saharan Africa: Socioeconomic
Booster. International Journal of Mechanical Engineering and Technology, 10(10), pp.
28-42
[24]
Svetlana Kapitonovna Demchenko, Maxim Sergyeyevich Zlotnikov, Tatiana
Alexandrovna Melnikova and Olga Sergeevna Demchenko, (2019), Theoretical and
Methodological Bases of Improving the Assessment of the Effectiveness and Synchronous
Functioning of a Country's Socioeconomic System Under Conditions of Transformation,
International Journal of Civil Engineering and Technology, 10(2), pp. 1877–1884.
/>
174