tiểu luận kinh tế lượng the impact of higher education on unemployment
Bạn đang xem bản rút gọn của tài liệu. Xem và tải ngay bản đầy đủ của tài liệu tại đây (199.39 KB, 20 trang )
FOREIGN TRADE UNIVERSITY
----------***----------
The Impact of Higher Education on Unemployment
Student name:
Doãn Đức Trung
Dob:
13/11/2000
Student N0 :
1813340071
Class:
KTEE310.1
The Impact of Higher Education on Unemployment
Abstract
This paper explores the relationship between higher education and
unemployment using regression analysis. My hypothesis is that the greater the
government expenditure on higher education, the lower a state’s unemployment will
be. Other independent variables such as state GDP per capita, the percentage of the
population with bachelor degrees or higher, the cost of college attendance, the share of
manufacturing in the state economy, and financial aid as a percentage of state revenue
were used in a multi-regression analysis in order to account for bias. The results found
that there is a strong negative relationship between higher education expenditures and
unemployment.
SECTION I
Unemployment is defined as the state of an individual without a job actively
seeking a job. It is an extremely important economic concept because it indicates the
state of the economy and the labor market. A low unemployment rate is a rate that is
close to the natural rate of unemployment. For the United States, the natural rate of
unemployment is around 4 to 5%. Conversely, a high unemployment rate is a rate that
is far from the natural rate of employment. If an economy has a low unemployment
rate, the economy is most likely strong and there is ample labor mobility and strong
purchasing power for workers. With a low unemployment rate, individuals have
numerous job opportunities, so there is high labor mobility. Employees also have
increased purchasing power because employees have a disposable income to spend
thus increasing over economic consumption. A high unemployment rate indicates a
weak economy where there is less labor mobility and less purchasing power. High
unemployment reduces consumers purchasing power because individuals have less
disposable to spend thus reducing consumption which can limit GDP growth. This
project uses unemployment rates in all 50 states and correlates these figures with
higher education government expenditures. Then I used multi-regression analysis to
include state GDP, the percentages of people with bachelor degrees, cost of attending
university, the share of manufacturing in the state economy, and financial aid as a
percentage of state revenue in order to reduce bias.
I hypothesize that unemployment decreases with the increase of higher
education government expenditures because human capital theory suggests that
increased education reduces labor cost because employees are more productive and
require less job training. The human capital theory is the idea that personality traits,
knowledge, and habits contribute to an individual’s ability to perform labor and thus
are of economic value. There are four types of human capital: economic, cultural,
social, and symbolic. This paper focus on how economic capital is related to
unemployment. Economic capital is education, training, and skills that increase the
knowledge of individuals making them more productive and thus increasing their
wages and marketability. The rationale behind the hypothesis is that more educated
workers are more attractive to firms because their increased knowledge results in
higher productivity and less on the job training. Thus, they are more likely to get hired.
Furthermore, more educated populations will have lower unemployment rates.
The first paper that I analyzed was a paper written by researchers Riddell &
Song (2011) that investigated the relationship between unemployment and the
transitions between unemployment to reemployment. They begin by establishing that
there is clear evidence that the labour market is rapidly changing since roughly 10% of
jobs perish and another 10% are newly created every year (Davis and
Haltiwanger, 1999). There are numerous studies that also support the claim that there is
a direct relationship between greater levels of education and the rate of incidence for
reemployment due to increased adaptability to the fluctuating job market. However,
this relationship could be affected by variables other than level of education such as
better social networks, higher income, or greater innate ability. In order to eliminate
confounding variables that would reduce the endogeneity of education, Riddell and
Song (2011) have distinguished their paper by focusing specifically on the transitions
to reemployment and eliminate the previously listed variables that would affect results.
In order to accomplish this, the researchers used data from the 1980 census and the
1980-2005 Current Population Survey due to the creation of instrumental variables
(IV) from compulsory schooling laws and child labor laws as well as conscription risk
during the Vietnam War. The IV estimates yielded higher estimates than standard OLS
regression. Based on their findings, it was concluded that graduating from high school
increases one’s chances of reemployment by 40 percentage points and another 4.7
percentage points with each additional year of schooling. In terms of the transition
from employment to unemployment, evidence for a relationship between education and
incidence of unemployed has mixed results. There is a negative correlation between
education and job loss especially for post-secondary education. However, there is no
evidence of a causal relationship at the secondary schooling level. Overall, the results
support the human capital theory that investment in an individual’s ability can increase
one’s adaptability in a changing job market.
In another paper from September 1991, Columbia University researcher Jacob
Mincer (1991) explores how higher educational levels as a function of human capital
investment affect the duration and frequency of unemployment. Using longitudinal
data on male labor rates from PSID (Panel Study of Income Dynamics), Mincer (1991)
tries to answer three questions. The first question is whether there is a positive
relationship between job training and education. The results show that there is a
positive relationship because education enhances the productivity of job training.
Additionally, those who invest in human capital such as education are likely to invest
in other types of human capital such as job training. However, in the long-run
education serves as a substitute for job training which is the reason for the decline in
apprenticeships. The second question is if turnover is negatively related to education.
Mincer found that there is a negative relationship which can be attributed to the
positive relationship between training and education. Employees that receive lots of
training are less likely to move from firm to firm, and employers are less likely to lay
off these workers because they want to reap the investments of training. The third
question is does education affect labor mobility, apart from its relation to job training.
Mincer (1991) found that education increases labor mobility because more educated
individuals are more efficient at finding jobs. Educated workers also have greater
geographical mobility as interregional migration is twice as frequent among workers
with 16 or more years of schooling than for those with 12 or less. Even though
educated workers are more likely to migrate, they change jobs less frequently. Overall,
the paper found that the probability of unemployment was more significant than the
duration of unemployment which supports previous research findings. Unlike other
research, this study focused on how education and job training incentivize firms to
keep workers because of the firm’s high fixed costs from job training.
In the last paper, researchers Lavrinovicha, Lavrinenko, and TeivansTreinovskis use methods of frequency, correlation, and multi-regression analysis to
examine the effect of education on unemployment and income in Latvia. The
researchers note that with a more technologically based economy, higher education is
increasingly important in finding a high paying job and education differences make up
25% of income inequalities. The paper also incorporates job competition theory as
rationale which argues that employers give more preference to candidates who he less
likely to spend money on. Essentially, the employer will hire the more experienced and
educated candidate regardless of the level of qualifications for the job. Thus, the study
hypothesizes that if education levels increase, unemployment decreases and income
increases. This study uses cross-series data from 2002-2013 collected by the University
of Latvia. The independent variables are primary education, secondary education, and
higher education levels which are regressed against the dependent variable - income.
The multi-regression analysis confirms the positive correlation between education
levels and income. Chi-square analysis of unemployment and education levels
demonstrate the negative relationship between unemployment and education levels.
Overall, the study empirically confirms the hypothesis which supports human capital
and job competition theory.
This paper will contribute to the literature by analyzing the effect of government
spending on education and unemployment across all fifty states. This study, like
previous studies, uses multi regression analysis an incorporates relevant factors to
education like income, cost of attending college, graduation rates, and the percentage
of people with bachelor degrees or higher. Unlike previous research, this research looks
at all fifty states and uses a different combination of independent variables. Most
research compares countries or compares some states and looks at unemployment
overtime in respect to likelihood of unemployment and duration of unemployment. The
paper looks at unemployment rates at one point in time from 1988, 2011, to 2015.
SECTION II
In order to analyze this relationship, I correlated the unemployment rate and the
higher education expenditure using a simple linear regression and added five more
variables in multiple linear regression. The data used in this paper is drawn from six
different credible sources. All data is taken from datasets regarding the year 2015.
Every variable has observations encompassing each of the 50 U.S. states.
Simple Linear Regression
1. Unemployment rate
The dependent variable is the annual average of unemployment for each US state in
2015. The unemployment rate only includes individuals who are actively looking for
work. The unemployment data comes from the Bureau of Labor Statistics which is an
agency of the U.S. Statistical System. Its purpose is to collect, analyze, and disseminate
information related to labor economics to the U.S. government and public.
2. Higher Education Government Expenditure Per Capita (in thousands of USD)
My main independent variable is the amount of money each state spent on higher
education expenditure spent by each state for each resident. I chose this as the main
independent variable because Ibelieve that the amount of money spent by the state
government on higher education should translate into more effective educational
programs such as better school infrastructure and higher quality employees. The higher
education expenditure data comes from a marketing research company called Statista.
It is one of the top databases as it has 4 million monthly users and over 1.5 million
statistics on 80,000 topics. The population per state statistics come from the US Census
Bureau. I divided the amount of money (in billions of USD) and the population for
each state (in millions) to create my own dataset of higher education government
expenditure per capita. Most staticians usually multiply the resulting variable by
100,000 to represent per capita for every 100,000 people when the unit of the resulting
variable is very small (ie. federal criminals in a population). However, the total amount
of higher education government expenditure is already in billions so I did not do this.
The resulting variable was measuring in units of thousands of US dollars.
3. State GDP per Capita (in thousands of US Dollars)
In addition to independent variable previously stated, the state GDP per capita is
also expected to affect the unemployment rate. Presumably, a higher state GDP should
translate into a lower unemployment rate because a high state GDP indicates higher
production and income levels. This variable is measured in units of thousands of USD.
The data on state GDP per capita comes from the Bureau of Economic Analysis which
is an agency of the US Department of Commerce seeking to provide policy makers
with accurate information on the economy.\
4. Percent Estimate with a Bachelor’s Degree or Higher
A higher percent estimate of people with a bachelor’s degree would indicate more
people with at least 16 years of schooling. This would indicate a more educated
population. If this variable is positively correlated with unemployment, this would
support the hypothesis that higher education leads to lower unemployment rates. The
data on this variable comes from the National Information Center for Higher Education
Policy Making and Analysis. It is part of the NCHEMS private non-profit organization
which seeks to provide relevant data and information for policy makers.
5. Average Cost of University Attendance for 1 school year (in thousands of USD)
The cost of education for an individual can affect the likeliness of them completing
a higher education. A higher cost of attendance can deter people from attending
university. My calculation for the cost of university attendance includes tuition, room,
board, and fees since these are the bulk of university attendance cost. The data on the
cost of college attendance comes from the National Center for Education Statistics
which is a branch of the US Department of Education that seeks to collect, analyze, and
disseminate statistics on education and public district finances.
6. Share of Manufacturing in State Economy
The share of manufacturing variable is the percentage of people employed in the
manufacturing sector in each state. This variable was included because it accounts for
employment not captured by higher education variables because manufacturing jobs do
not require higher education. The data comes from the Bureau of Economic Analysis,
the same data source at the state GDP per capita variable.
7. Federal Aid as Percentage of State General Revenue
The federal aid variable is the federal aid as a percentage of state revenue. This aid
goes towards Medicaid, education, transportation, and other entitlement programs.
There is no overlap between this variable and higher education expenditure per capita
variable because all aid is in the form of federal grants and is not captured in state
higher education expenditures. The source of this data is the US Census Bureau, the
same data source as the higher education government expenditure per capita variable.
The following table is a summary of each of the previously utilized variables. The
standard deviations of some of the variables such as state GDP are large as absolute
values. However, the coefficient of variation (calculated by taking standard deviation
divided by mean) is not relatively large, so there is no noticeably large variability for
any of the variables.
Table 1 - Summary Statistics
Variable
Observations Mean Std. Dev.
Min
Max
Unemployment Rate
50
5.03
1.07
2.7
6.9
Higher Education Govt Expenditure
per Capita (in Thousands of USD
50
0.90
0.23
0.51
1.45
State GDP per Capita (in Thousands
of USD
50
48.06 8.85
31.98 66.84
Percent Estimate with a Bachelor’s
Degree or Higher
50
31.01 5.42
20.95 44.14
50
18.89 3.42
13.34 26.01
Share of Manufacturing in State
Economy
50
8.82
2.1
17.1
Federal Aid as Percentage of State
General Revenue
50
31.64 5.13
16.8
40.9
Average Cost of Tuition, Fees, and
Room/Board (in Thousands of
USD)
3.44
Gauss Markov Assumptions
The first Gauss-Markov assumption states that the model should be linear in
parameters. This assumption’s justification is shown in the linear regression results
section. The second assumption pertains to random sampling. Since the data was either
obtained from national government agencies that conduct annual surveys of randomly
selected members of the population or reputable private organizations, the second
assumption is met. The third Gauss-Markov assumption is the assumption of no perfect
collinearity. As long as no two variables are perfectly collinear, this assumption will be
met. There is no reason to assume perfect collinearity for any of the variables as
evidenced by the results in Table 4. The fourth assumption has to do with zero
conditional mean; the error u has an expected value of zero given any values of the
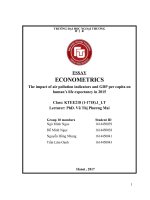
independent variables. The last assumption is heteroskedasticity which also concerns u.
As seen in Figures 1-2, the residuals show variances that do not vary randomly in each
model. Therefore, there is no discernable pattern for either figures and the last
assumption is satisfied for both figures.
Figure 1: Residual of Simple Regression Model
Figure 2: Residual of Multiple Regression Model
SECTION III
Simple Linear Regression
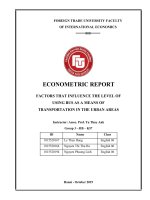
unemploy = β0 + β1popeducexp + u
Figure 3: Regression Line and Scatter Plot
In regards to the simple regression equation, the dependent variable is the
annual average U-3 unemployment rate, more generally referred to as the
unemployment rate, in each state. The independent variable is the higher education
expenditure per capita in each state, in thousands of US dollars. From my initial look at
the regression plotted atop the scatterplot, I am able to see a negative relationship
between the two variables, as I had predicted. Generally, the regression coefficient for
β1 shows that a $1,000 increase in higher education expenditure per capita will lead to
a 1.42% decrease in the unemployment rate. This relationship follows the rationale that
a state with a greater emphasis on higher education will have a lower unemployment
rate because of the human capital theory’s claim that secondary education leads to less
on-site job training, which therefore decreases the cost of hiring another employee.
The nuances of this regression are seen in other measurements of the Stata
output, though. First, I looked at the hypothesis testing in order to determine the
significance of the coefficient (β1). I determined the significance of β1 through both
the P >丨 t 丨 value and the t-value. I found that the coefficient is considered statistically
significant on 95% confidence interval. To be statistically significant, at this level, the
P >丨 t 丨 value needs to be .05 or below, and it is 0.03. I was able to prove the statistical
significance of the coefficient by interpreting the t-value. For the sample size of the
data, which is 50, a t-statistic of 2.021 or greater is considered statistically significant.
Looking at the t-statistic, I reaffirmed my prior conclusion that the coefficient is
statistically significant, with an absolute t-value of 2.24.
The R-Squared value is also an important statistic to evaluate. In this case, the
R-squared is 0.0949. This value indicates that 9.49% of the variance in the
unemployment rate can be explained by the higher education expenditure per capita.
The association is quite small and indicates that the regression is not as strong as
possible - more variables need to be included in order to help control for more
variance. Another important statistic that I must look at is the Root MSE, or Root Mean
Squared Error, which shows the standard deviation of the error term. This value is
1.029 which demonstrates a relatively high deviation of actual values from the
estimated values.
Multiple Linear Regression
Model 1: unemploy = β0 + β1popeducexp + β2degree + β3tuition + β4stategdp + u
In order to prevent omitted variable bias in the regression model, I accounted for
more of the variation by using a multiple regression. In the first multiple regression
model, I tried to explain the changes in the unemployment rate by including the percent
estimate of people with bachelor's degree or higher, tuition costs, and state GDP per
capita in addition to higher education expenditure per capita.
In this model, the β1 coefficient indicates that a $1,000 increase in higher
education expenditure per capita leads to a 1.39% decrease in unemployment, holding
all other variables constant. At a 95% confidence interval, this variable still remains
statistically significant, with an absolute t-value of 2.15.
In the following variables, as a practice, I will hold all other factors constant
when interpreting what the coefficient means in terms of the effect on unemployment.
A 1% increase of people with a bachelor's degree or higher leads to a 0.134% decrease
in the unemployment rate. A $1,000 increase in tuition leads to a 0.120% increase in
unemployment. Lastly, a $1,000 increase in state GDP per capita leads to a 0.023%
increase in unemployment.
A trend I observed was that when there are more people with secondary degrees,
the unemployment decreases, and when the cost of tuition increases, unemployment
increases. The tuition and degree variables were also concluded to be statistically
significant on a 95% confidence interval. Both had t-values that were above 2.021,
with absolute value t-values of 3.40 and 2.32 respectively. The tvalue of state GDP per
capita could not be concluded as statistically significant at even a 90% confidence
interval, with a t-statistic of only 1.09.
Ultimately, the multiple regression was stronger than the simple regression. I
can prove this by noting that the Root Mean Squared Error now lies under 1, while it
was above 1 previously. More importantly, the R-squared value is now 0.2942,
meaning 29.42% of the variance in the unemployment rate can be explained by the
variables used in this regression. This R-squared is approximately 3 times the size of
the simple regression R-squared.
Model 2: unemploy = β0 + β1popeducexp + β2degree + β3tuition + β4stategdp +
β5manu + β6 fedaid + u
After reviewing the variables once more, I determined that additional variables
could be included in the model in order to explain the regression better. Thus, I
included two more independent variables: the share of the manufacturing in the state’s
economy and federal aid as percentage of the state’s general revenue. The inclusion of
these variables did lower the significance of β1. The coefficient for higher education
expenditure per capita now indicates that a $1000 increase in said expenditure per
capita leads to a 1.12% decrease in the unemployment rate, but the t-statistic falls just
below that of which I could declare the coefficient as being statistically significant at a
90% confidence interval. It is important to note that no other variable is dramatically
lowered in its statistical significance and that the two added variables cannot be
concluded statistically significant at a 90% confidence interval.
This model is strengthened primarily by its increase in the R-Squared value.
Now, 33.13% of the variation in the unemployment rate can be explained by the
independent variables used in this model. To further examine the second multiple
regression model, I ran further tests to look for joint significance between the state
GDP per capita and the federal aid.
Model 3: unemploy = β0 + β1popeducexp β2degree + β3tuition + β4manu + u
After looking at the results and coefficients for Model 2, I recognized that the
state GDP per capita and the federal aid variables were extremely insignificant, so I
dropped both of these variables (I test for joint significance in the following section).
Upon dropping these variables, the primary independent variable coefficient,
popeducexp, regained its statistical significance, as well as allowed all other variables
to also either maintain or gain statistical significance. All variables are significant at, at
least, a 90% confidence interval.
When I removed these two variables, R-Squared only decreased by a small
amount. Therefore, the final model accounts for 32.56% of the variation in the
unemployment rate and the Root Mean Squared Error is at its lowest, at 0.9173. This
final model accounts for potential omitted variable bias while also excluding
insignificant variables.
Table 2 - Statistical Inference
Dependent Variable: unemploy
Independent
Simple Linear
Variables
Regression
popeducexp
Multiple Linear Multiple Linear Multiple Linear
Regression:
Regression:
Regression:
Model 1
Model 2
Model 3
-1.422244
-1.397579
-1.116927
-1.034436
degree
--
-0.1340587
-0.1315355
-0.1263735
tuition
--
0.1202684
0.1369263
0.1387097
stategdp
--
0.0233536
0.0131698
--
manu
--
--
-0.0669345
-0.0725119
fedaid
--
--
0.0139858
--
6.319061
7.058889
7.049044
7.905331
Root MSE
1.029
0.93845
0.93447
0.9173
R-squared
0.0949
0.2942
0.3313
0.3256
Intercept
F-test
Restricted Model:
unemploy = β0 + β1popeducexp + β2degree + β3tuition + β4manu + u
After adding more variables to the second multiple regression model, I noticed
that both state GDP per capita and federal aid as a percentage of state general revenue
were not statistically significant and had the potential be jointly significant. I thought
they had the potential to be jointly significant because a state with higher GDP per
capita would probably need less federal aid than those with lower GDP per capita. In
the test that follows, the unrestricted model is the Multiple Linear Regression: Model 2
(listed in the previous section), and the restricted model is stated above.
Table 3 - F-Statistic
stategdp + fedaid
SSR Unrestricted Model
37.549
SSR Restricted Model
37.865
Numerator Degrees of Freedom
2
Denominator Degrees of Freedom
43
F-Statistic
0.197
Upon seeing the F-statistic, I see these two variables as being neither
independently significant nor jointly significant. This observation is evident because
the critical value for a 95% confidence interval given the numerator and denominator
degrees of freedom is 3.23. Quite simply, the F-statistic of 0.197 lays drastically below
this critical value, which means that the variables are not jointly significant. Due to this
F-test, the third model still holds in the decision to drop both of the variables being
tested.
Multicollinearity
Table 4 - Multicollinearity.
Bachelor's
Cost of
degree or
attendan
higher
ce
x
0.6324
0.0063
x
x
-0.1686
x
x
Per capita
real GDP
x
Share of
manufacturing
Bachelor's
degree or
Higher
education
Per
capita
Share of
Federal aid a
expenditure
real
manufactu
percentage of
per capita
GDP
ring
state revenue
0.6302
-0.193
-0.527
0.3276
0.0304
-0.2537
x
0.3304
0.022
-0.2882
x
x
x
-0.3727
-0.6204
x
x
x
x
x
0.2175
x
x
x
x
x
x
higher
Cost of
attendance
Higher
education
expenditure
per capita
Federal aid a
percentage of
state revenue
Unsurprisingly, several of the variables have some multicollinearity because the
variables are related. The strong relationships are denoted with an asterisk. The strong
relationship between cost of attendance and percentage of people with bachelor’s
degrees or higher can be explained through the law of demand. As degrees demanded
increase, the cost of degrees supplied increases. There is also a strong relationship
between percentage of people with bachelor degrees or higher and state GDP per capita
because more educated people have higher wages thus increasing GDP. There is a
strong negative relationship between percentage of people with bachelor degrees or
higher and federal aid as a percentage of state revenue because the federal government
is less likely to give educational aid to states that have more available funding. This
relationship is demonstrated by the strong negative correlation between state GDP per
capita and federal aid as a percentage of state revenue. States have more available
funding when they have more taxable revenue which is evidenced by the strong
correlation between higher education expenditure per capita and state GDP per capita.
More educated populations have higher wages; thus, the government have more
taxable revenue and can increase its budget. Conversely, manufacturing is a field with
lower wages, so there is a strong negative relationship between state GDP per capita
and share of manufacturing jobs. Since the model has some multicollinearity, some
variables may need to be eliminated from the model. For example, state GDP per capita
could be removed from the model because it has a strong degree of multicollinearity
with four of the five other variables. Thus, its characteristics are mostly controlled for
by the other variables and are not necessary to include.
Throughout this analysis, I chose not to include dummy variables because I did
not have qualitative data. I also determined that there was not enough variation among
regions of the United States to draw conclusions significant differences across them.
This also has the potential to be caused by the fact that the research only utilizes 50
observations. Regarding the use of functional form, I have cleaned all of the data to be
in one of two units: either percentage points or thousands of U.S. Dollars. This allows
for easy interpretation of correlation coefficients and allows me to avoid the need for a
functional form. It is also important to mention that the regression line plotted on top of
the data does indeed show a generally linear correlation.
Due to the results of the research I conduct and consideration for possible bias
factors, I believe more states should invest money into higher education expenditures
since it directly leads to a significant reduction in a state’s unemployment rate. More
specifically, the third and final model shows that a $1000 increase in higher education
expenditures leads to a 1.03% decrease in the unemployment rate, given a 90%
confidence interval. In order to control for outside variables within the regression, I use
percentage of people with a bachelor’s degree or higher, the cost of attendance, and the
share of the economy that is comprised of manufacturing. Throughout this testing, I
was able to drop variables that were not significant, such as per capita state GDP and
the share of federal aid provided to the state in relation to revenue. Through earlier
testing, I also observed that the high school graduation rate does not have a significant
effect on the unemployment rate. The final regression model explains 32.56% of
variation in unemployment rates. I believe it would beneficial to run this regression
again with more observations and more variables in order to get a stronger model.
References
Literature Works
Lavrinovicha, I., Lavrinenko, O., & Teivans-Treinovskis, J. (2015). Influence of
Education on Unemployment Rate and Incomes of Residents. Procedia - Social and
Behavioral Sciences, 174, 3824-3831.
Mincer, J. (1991). Education and Unemployment. Studies in Human Capital
Riddel, C. & Song, X. (2011). The Impact of Education on Unemployment Incidence
and Re-employment Success: Evidence from the U.S. Labour Market (IZA DP No.
5572)
Data
“Digest of Education Statistics.” National Center for Education Statistics, Institute of
Education Sciences, 2015.
www.nces.ed.gov/programs/digest/d16/tables/dt16_330.20.asp
“Education Levels of the Population.” Higher Education Information, National
Information Center for Higher Education Policy Making and Analysis,
2015.www.higheredinfo.org/dbrowser/?level=nation&mode=map&state=0&submeasu
re=250
“Higher Education Expenditures by State and Local Government.” Statista, Statista,
2015.www.statista.com/statistics/306662/us-state-local-government-educationexpenditure/.
“Manufacturing Employment by State.” National Association of Manufacturing, BEA,
2015. www.nam.org/Data-and-Reports/State-Manufacturing-Data/2014-StateManufacturingData/Manufacturing-Employment-by-State---2014/.
“Real Personal Income for States and Metropolitan Areas.” U.S. Bureau of Economic
Analysis, BEA, 22 June 2017. www.bea.gov/news/2017/real-personal-income-statesand-metropolitan-areas-2015.
Scarboro, Morgan. “Which States Rely the Most on Federal Aid?” Tax Foundation, US
Census Bureau, 21 Mar. 2017. www.taxfoundation.org/states-rely-most-federal-aid/.
“U-3 And U-6 Unemployment by State .” U.S. Bureau of Labor Statistics, U.S. Bureau
of Labor Statistics, 25 Feb. 2016. www.bls.gov/opub/ted/2016/u-3-and-u-6unemployment-by-state2015.htm.