Multi-environment evaluation to identify promising germplasm lines for economically important traits in G. hirsutum Cotton
Bạn đang xem bản rút gọn của tài liệu. Xem và tải ngay bản đầy đủ của tài liệu tại đây (1.09 MB, 16 trang )
Int.J.Curr.Microbiol.App.Sci (2018) 7(11): 929-944
International Journal of Current Microbiology and Applied Sciences
ISSN: 2319-7706 Volume 7 Number 11 (2018)
Journal homepage:
Original Research Article
/>
Multi-Environment Evaluation to Identify Promising Germplasm Lines for
Economically Important Traits in G. hirsutum Cotton
Suresh S. Handi* and I.S. Katageri
Department of Genetics and Plant Breeding College of Agriculture, University of Agricultural
Sciences, Dharwad – 580 005, Karnataka, India
*Corresponding author
ABSTRACT
Keywords
Gossypium hirsutum,
Germplasm, Genetic
variability, Genetic
diversity
Article Info
Accepted:
10 October 2018
Available Online:
10 November 2018
Our objective was to evaluate G. hirsutum cotton lines, which includes indigenous, exotic
collection, released varieties and lines developed from different breeding strategies were
evaluated in alpha lattice designs with two replications along with five standard G.
hirsutum check varieties viz., Sahana, Surabhi, MCU 5, DS 28 and ARBH 813 for yield
and fibre quality traits. The analysis of variance revealed the presence of significant
differences among genotypes and recorded wide range of variations for all the characters
over environments. EC296596 (2263 Kg/ha), 128333-Acala-44 (2258 Kg/ha) and
543416A03N132 (2250 Kg/ha) recorded significantly higher seed cotton yield than
superior check, ARBH 813 (1894 Kg/ha). CPD-420, FQT-38, CPD-2011, AKA-8828,
DRC-305 and CPD-443 recorded higher ginning outturn (>38 percent) with high boll
weight (>4.0g), more bolls (>15.0) and more fruiting points (>35). HAG-1055, HLS321729, AK-23B, 543416A03N132, 126663, FQT-38 and 54335402A015 recorded high
seed index with ginning outturn (>37 percent), boll weight (4.0g), more bolls (>14.0) and
fruiting points (>35.0), moderate height (>95 cm to 105 cm). Five germplasm lines viz.,
FQT-21 (31.8 mm), IC356874 (30.9 mm), ADB-39 (30.9 mm), CPD-437 (30.0 mm) and
EC559012 (30.0 mm) with higher fiber strength (23.2 to 24.7 g/tex) and on par with
ARBH 813 for seed cotton yield (1555 to 1966 Kg/ha). These germplasm collections
represent a valuable resource for improving seed cotton yield and fiber quality in cotton.
during production, processing, spinning,
weaving and marketing throughout the world.
Introduction
Cotton is one of the most important
commercial crops which occupied importance
from historic days. It is an industrial
commodity of worldwide importance.
It occupies the place of pride in Indian
agriculture and economy by earning valuable
foreign exchange. It is primarily used in textile
industries providing highest employment
Germplasm is the genetic source material used
by plant breeders to develop new cultivars and
one of the consequences of successful plant
breeding can be increased erosion or reduction
in genetic variability for the crop undergoing
selection. There is also a danger that valuable
genetic resources may be lost to future
breeding programs as the areas of genetic
929
Int.J.Curr.Microbiol.App.Sci (2018) 7(11): 929-944
diversity are developed and as agriculture
becomes more intensified (Stoskopf et al.,
1993). As a result, breeders need to effectively
manage their breeding populations to preserve
adequate genetic variation so that future
improvements through selection can occur.
Proper management of germplasm resources
by the breeder includes introducing new
germplasm resources on a regular basis to
develop new recombinants and hence increase
genetic variability. One relevant way to have
cotton germplasm information available for
breeding purposes is through the evaluation of
the existent, yet uncharacterized material.
Characters is likely to vary according to the
environment in which the genotype is being
cultivated, it would therefore, be worthwhile
to identify the attributes controlling
productivity to suite particular locality.
As mentioned, cotton is natively a crop
adapted to tropical and subtropical climates. A
shift in the climatic adaptation of the plant has
been necessary to enable its successful
cultivation in more temperate environments.
Germplasm
screening
for
useful
characteristics is important for making
information available of yet uncharacterized
material. The rapid advances in spinning
technology in recent decades resulted in
increasingly new demands concerning fiber
properties. The adoption of new spinning
methods, the advances in the traditional
spinning process and the higher consumer
demands call for extensive research and
improvement of the raw material to keep pace
with the current quality requirements of the
spinning industry. The main objective of this
study was to evaluate 320 cotton germplasm
lines for both agronomic and fiber
characteristics.
Materials and Methods
In the present study a total of 320 germplasm
of G. hirsutum lines which includes
indigenous, exotic collection, released
varieties and lines developed from different
breeding strategies with five checks viz.,
Sahana, Surabhi, MCU 5, DS 28 and ARBH
813 available at Agricultural Research Station,
Dharwad Farm were evaluated in alpha lattice
designs with two replications. Each replication
was subdivided into 16 blocks and each block
containing 20 entries representing five
environments of two different zones of
Karnataka viz. Agricultural Research Station,
Dharwad Farm, Institute of organic farming,
Dharwad (Zone No. 8) and Agricultural
Research Station, Bagalakot (Zone No. 3)
under the jurisdiction of University of
Agricultural Sciences, Dharwad. Data on seed
cotton yield, yield components and fiber
quality traits were recorded. The observations
on five plants viz., Plant height (cm), No. of
monopodia, No. of sympodia, No. of bolls,
No. of fruiting points, Boll weight (g),
Ginning outturn (%), Seed index (g), Lint
index (g) and Seed cotton yield (Kg/ha).The
fibre quality parameters included 2.5% span
length, fiber strength, micronaire reading and
length uniformity index were analyzed under
HVI (high volume instrument) at Central
Institute for Research on Cotton Technology
(CIRCOT), regional quality evaluation unit
situated at ARS, Dharwad farm. The
observations on four fiber quality traits of 320
germplasm lines were recorded for two
environments (E3-ARS, Dharwad farm and
E5- ARS, Bagalkot). Phenotypic data were
analyzed using REML procedure (Residual
Maximum Likelihood) implemented in
Cropstat 7.2 software. The least mean squares
obtained after removing the block effects were
used in further analysis. Variance components
were calculated by fitting a linear mixed
model to multi-environment data.The data was
subjected to randomized complete block
design (RCBD) analysis and analyzed using
software, Windostat version 9.1 and frequency
distribution curves obtained using SPSS
version 16.0 software.
930
Int.J.Curr.Microbiol.App.Sci (2018) 7(11): 929-944
Results and Discussion
Germplasm
screening
for
useful
characteristics is important for making
information available of yet uncharacterized
material and has served as a major resource in
conjugation with suitable breeding strategies
for continuous improvement for yield and
fibre quality in cotton.The mean sum of
squares for yield traits in 320 G. hirsutum
cotton germplasm evaluated in five
environments is presented in Table 1. The
analysis of variance indicated presence of
significant variability among the germplasm
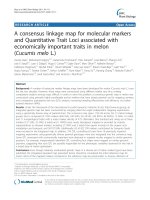
lines for all yield traits. The data on mean and
range for yield traits are presented in Table 2
and 3 represent performance of G. hirsutum
check varieties. Frequency distribution of
germplasm lines was normal for yield and
fibre quality traits (Fig. 1).
Plant height is the important trait in
determining the plant architecture suggesting
its importance in high density planting and for
mechanical harvesting. Wide range of
variations for plant height over five
environments was recorded. On an average,
plant height was highest in PSHEC-15 (121.4
cm) followed by SEC-6 (118.3 cm), EC479
(118.0 cm) and 543364A02N46 (114.8 cm), it
was 10% more height and statistically on par
with the tallest check, Surabhi (103.7cm) and
among the different environments the E5
environment recorded highest plant height
(117.4 cm) with wide range of variation 81.0
cm to 174.9 cm respectively. On the contrary
the line IC356780 (71.5 cm) was dwarf than
check, MCU 5 (86.1 cm) a dwarfest among
checks. Tuteja et al., (2006) and Verma and
Tuteja (2008) also observed wide range of
variations for plant height in cotton.
Monopodium is a main branch of cotton plant
present at bottom varying from zero to four.
This branch provides support to plant
preventing from lodging in intensive method
of cultivation with wider row spacing. Plants
with higher monopodia are generally robust
having more number of sympodia and also
having sympodia on monopodia to produce
higher yields. In present study the highest
number of monopodia was recorded by the
line IC357196 (2.89) and is on par with the
best check ARBH 813 (2.40). Whereas, in
contrast, looking to shortage of labour,
identification and utilization of germplasm
lines with lower monopodia or zero
monopodia to develop variety for mechanical
harvesting is necessary. The present study
identifies the genotypes with lowest number of
monopodia, IC358249 (0.74) fallowed by
genotypes IC358249 (0.74), FQT-2 (0.76),
GISV-272
(0.77),
EC560401
(0.80),
EC560392 (0.88), PVK-Rajat (0.89), FQT-35
(0.91), PS-20-2-1 (0.92), EC560399 (0.99)
and CPD-448 (0.99), which was significantly
lower than check variety Sahana (1.87) over
five environments which would resulted in
cultivation for high density planting and
suitable for machine harvesting and they may
be suitable lines in breeding program for less
or zero monopodial plants. Krishnadoss and
Kadambavanasundaram (1997) have seen 1.7
monopodia branches. Manjula et al., (2004)
observed 4.0 monopodia in G. herbaceum
genotypes. Tuteja et al., (2006) recorded 4.77
monopodia per plant. Nagaraj et al., (2008)
noticed 2.15 of monopodia in elite germplasm
lines of cotton.
The braches which bear squares and bolls are
sympodia and hence directly influence the
seed cotton yield. Normally a cotton plant can
have around 5 to 25 sympodial branches. In
our study, the variability observed for number
of sympodia was ranging from 10.3 to 20.5.
Seven germplasm lines have recorded 15%
more sympodia than superior check, ARBH
813 (17.1). In the present study the germplasm
line RDT-32 (10.3) followed by 16 germplasm
lines recorded lowest number of sympodia and
on par with inferior check MCU 5 (13.4) with
931
Int.J.Curr.Microbiol.App.Sci (2018) 7(11): 929-944
mean of 16.1 over five environments which
suggest that they were compact in nature and
suitable for dense cropping and machine
harvesting.
Krishnadoss
and
Kadambavanasundaram (1997) reported up to
20.9 and 21.0 sympodia in direct and
reciprocal cross of tetraploid interspecific
crosses. Verma and Tuteja (2008) have seen
65.10 sympodia per plant. Nagaraj et al.,
(2008) recorded 16.10 sympodia branches.
Patel et al., (2009) observed 23-44 sympodia
in upland cotton genotypes
The number of bolls is an important trait for
the genotype which determines its yielding
ability. In the present study, mean value
recorded for number of bolls across five
environments and all genotypes was 13.7 and
only one germplasm line NO-15 (21.2) was
recorded higher number of bolls over the
superior check ARBH 813 (20.3). Genotypes
like CPD-824, ARB-08-822, 126663, NO-4
and RAH-110 recorded more number of bolls
(>17) with height more than >100 cm and
more monopodia (>1.6), sympodia (>16.0).
While, the line EC138566 recorded lowest
number of bolls which was significantly lesser
than inferior check, Sahana (12.6) fallowed by
eight germplasm lines recorded less than 10
bolls and their seed cotton yield per hectare
were also low (<1500 Kg/ha). The mean
number of bolls of 13.0 (E1), 10.2 (E2), 14.82
(E3), 15.13 (E4), 15.43(E5) with wide range
of variation from 2.7 to 21.4 (E1), 0.4 to 31.1
(E2), 7.2 to 26.0 (E3), 7.0 to 23.7 (E4) and 8.3
to 22.8 (E5). About 35.3 bolls per plant were
observed by Meena et al., (2006) in upland
cotton genotypes. Tuteja et al., (2006) noticed
up to 42 bolls per plant. Nagaraj et al., (2008)
recorded 16.4 bolls per plant in elite
germplasm lines of upland cotton. Baig et al.,
(2009) noticed 38.07 boll loads per plant.
Fruiting points are the reproductive organs, it
depicts potential of plant to bear the flower
buds which determines the yielding ability of
genotype. Some of these may drop or dry up
because of environmental conditions like poor
nutrition or pest attack. In present study, wide
range of variation was observed for number of
fruiting points from 26.0 to 63.3 and two
germplasm lines have recorded more than 20
percent fruiting points over superior check,
ARBH 813 (50.7). Among these lines RDT-2
recorded highest fruiting points (63.3) but it
exhibited poor yield (1038Kg/ha) followed by
54335402A015 (62.9) which recorded 14%
higher yield (2160 Kg/ha) than superior check,
ARBH 813 (1894 Kg/ha). Genotypes like
CPD-824, ARB-08-822, 126663, CA-105,
HAGH-148, HBS-148 and CPD-437 have
recorded more number of bolls, fruiting points
with more monopoda and sympodia.
Whereas, EC560391 (26.0) fallowed by 21
germplasm lines have recorded lower number
of fruiting points than inferior check, Surabhi
(29.9). The range of variation observed for
fruiting points was 13.8 to 96.3, 15.8 to 98.3,
20.8 to 54.1, 16.5 to 47.7, 29.2 to 67.4 with
the mean values 40.2, 39.2, 36.5, 27.9, 48.1 in
E1, E2, E3, E4 and E5 environments.
The lines with big bolls are preferred because
of ease in hand picking. It also helps in
reducing cost and time involved in manual
harvesting. In the present study, over five
environments, highest boll weight was
recorded by two germplasm lines CPD-431
(5.23g) and IC356874 (5.13g) followed by 23
germplasm lines recorded more than 15
percent and 10 percent high boll weight over
the superior check, DS 28 (4.45g)
respectively. CPD-431 and
IC356874
recorded 43.8 percent and 19.1 percent higher
seed cotton yield than check DS 28 (1305
Kg/ha) respectively. However, the line RS810-SGNR (3.12g) recorded significantly
lower boll weight than Surabhi (3.78g), an
inferior check. The mean value of 4.35g (E1),
3.75g (E2), 4.40g (E3), 4.11g (E4) and 4.52g
(E5) exhibited by this trait with wide range of
932
Int.J.Curr.Microbiol.App.Sci (2018) 7(11): 929-944
variation from 2.98g to 6.74g (E1), 2.58g to
5.05g (E2), 2.80g to 6.10g (E3), 2.73g to
5.79g (E4), and 3.15g to 6.43g (E5). Palomo
and Davis (1983) observed 6.46 g boll weight
in interspecific F1s of tetraploid cottons.
Meena et al., (2006) observed 3.8 g boll
weight in upland cotton germplasm lines.
Tuteja et al., (2006) recorded 3.32 g boll
weight.
Ginning outturn depicts the potential of
genotype to yield lint which is raw material
for textile industry. Hence genotype with high
ginning outturn is considered to be good. The
lines with high ginning outturn and high seed
cotton yield are preferred by breeder in order
to maintain interest of farmers and textile
industry (ginning factories). Four germplasm
lines viz., CPD-460 (40.23 percent), NH-2211
(39.92 percent), EC560430 (39.84 percent)
and CPD-423 (39.53 percent) recorded more
than 5.0 percent higher ginning outrun with
24.44 percent (1624 Kg/ha), 10.88 percent
(1447 Kg/ha), 36.7 percent (1784 Kg/ha) and
26.05 percent (1645 Kg/ha) higher yield than
DS 28 (37.59 percent ginning outturn and
1305 Kg/ha seed cotton yield) respectively.
CPD-420, FQT-38, CPD-2011, AKA-8828,
DRC-305 and CPD-443 have recorded higher
ginning outturn (>38 percent), with high boll
weight (>4.0g), more bolls (>15.0) and more
fruiting points (>35). Whereas, FQT-21 (30.05
percent) recorded significantly lower than
inferior check, Surabhi (34.56 percent) over
five environments.
The range of variation observed for this trait
was from 25.31 to 42.46 percent, 28.50 to
41.04 percent, 29.82 to 40.89 percent, 28.75 to
40.75 percent, and 30.22 to 40.32 percent with
the mean value of 36.01 percent, 36.53
percent, 36.76 percent, 35.91 percent, and
36.60 percent and in E1, E2, E3, E4 and E5
respectively.
Krishnadoss
and
Kadambavanasundaram (1997) recorded 30.7
per cent ginning outturn. Tuteja et al., (2006)
recorded 34.3 per cent ginning outturn. Verma
and Tuteja (2008) have seen 34.75 per cent
ginning outturn in genotypes of upland cotton
developed using different cytoplasmic
sources. Nagaraj et al., (2008) observed 37.14
per cent ginning outturn in elite germplasm
lines of upland cotton.
The relationship between seed index and seed
cotton yield is complex, as large seeds with
more surface area can bear more number of
fibers, but at the same time the total available
area for number of fiber decreases as seed
index increases to high or too low. Hence
moderate seed index about 8 to 10 g is
desirable to achieve higher seed cotton yield
and ginning outturn.
The variation observed for seed index was
from 6.6g to 12.15g. On an average over five
environments, the genotype IC356874
(12.15g) recorded more than 30.33 percent of
seed index which was significantly higher than
best check, Sahana (9.33g) followed by eight
germplasm lines. Germplasm lines like HAG1055,
HLS-321729,
AK-23B,
543416A03N132, 126663, FQT-38 and
54335402A015 have recorded high seed index
with ginning outturn (>37 percent), boll
weight (4.0g), more bolls (>14.0), fruiting
points (>35.0) and moderate height (>95 cm to
105 cm).
Whereas Tiny-boll (6.60g) showed low seed
index and on par with inferior check i.e.
ARBH 813 (7.59g). The range of variation
exhibited in different environments was 6.35
to 14.35, 4.15 to 11.65g, 6.75 to 12.5g, 6.25 to
12.75g, 6.50 to 12.00g with the mean values
of 10.73, 7.6, 9.23, 8.63 and 8.69g in E1, E2,
E3, E4 and E5 respectively. Palomo and Davis
(1983) reported 14 g seed index. Meena et al.,
(2006) recorded 10.8 g in upland cotton
germplasm lines. Bourland and Jones (2009)
recorded seed index of 11.1 g.
933
Int.J.Curr.Microbiol.App.Sci (2018) 7(11): 929-944
Fig. 1: Frequency distribution of yield, yield related traits and fiber quality traits of germplasm lines
934
Int.J.Curr.Microbiol.App.Sci (2018) 7(11): 929-944
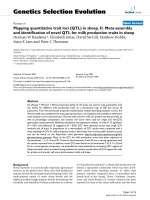
Fig. 1: Contd…
935
Int.J.Curr.Microbiol.App.Sci (2018) 7(11): 929-944
Fig. 1: Contd…
936
Int.J.Curr.Microbiol.App.Sci (2018) 7(11): 929-944
Table.1 Pooled analysis of variance for yield and yield component traits in cotton germplasm lines
Source of
variation
Replications
Genotypes
Location
Df
Plant
height
(cm)
No. of
bolls
No. of
fruiting
points
Boll
weight
(g)
Ginning
Outturn
(%)
Seed
index
(g)
Lint
index
(g)
SCY (Kg/ha)
E1
E2
1
325.3**
213.2*
0.0048
0.002
7.14
5.02
0.009
0.770
152.0
192.2
0.046
0.033
2.40
23.27
0.145
0.039
0.803*
0.00001
20976
27079*
E3
384.2*
0.013
12.43
71.95**
16.13
0.197*
8.62
0.044
0.820
175363
E4
119.8
0.205
2.22
2.55
50.12
0.175
6.02
0.791
1.135*
36060
E5
219.3
0.157
30.27
2.37
58.68
0.246
12.60
0.308
0.274
86118
499.3**
0.4119**
22.56**
14.70**
68.8**
0.823**
19.45**
5.477**
2.790**
894987**
E2
181.8**
0.9639**
49.05**
13.40**
84.3**
0.491**
13.98**
2.564**
1.233**
74889**
E3
255.6**
0.638**
13.76**
23.12**
59.19**
0.653**
9.02**
1.862**
0.766**
734885**
E4
289.0**
0.467**
9.78**
14.07**
57.04**
0.576**
9.51**
2.002**
0.774**
239649**
E5
405.5**
0.721**
22.07**
14.70**
87.37**
0.815**
7.85**
1.629**
0.701**
355578**
pooled
688.03**
1.357**
34.07**
35.54**
250.2**
1.136**
26.78**
4.74**
2.11**
788812**
4
432930**
82.66**
23803**
3022.5*
*
33706*
*
59.05**
90.25**
838.1**
245.6**
252940482**
1276
319
403.02
162.7
51.14
0.4615
0.0517
0.0519
20.793
4.70
10.84
18.62
1.19
3.20
176.6
24.20
19.04
0.556
0.231
0.124
8.26
8.48
5.82
2.198
0.763
0.651
1.039
0.130
0.047
377794
37793
4211
E3
82.9
0.103
3.381
5.49
18.75
0.05
2.34
0.332
0.240
85708
E4
89.6
0.065
3.342
5.78
21.33
0.042
4.05
0.264
0.261
22266
E5
185.9
0.103
7.999
5.58
15.59
0.086
3.27
0.241
0.195
27823
114.84
0.0752
6.054
4.25
42.58
0.151
2.39
0.451
0.175
35560
E1
Environment
G X E interaction
E1
Error
E2
Pooled
319
1595
No. of
No. of
monopodia sympodia
*, ** significant at 5% and 1% levels respectively.
E1-ARS, Dharwad (2011), E2- ARS, Dharwad (2012), E3 – ARS, Dharwad (2013), E4-MARS, Dharwad (2013) and E5 – ARS, Bagalkot (2013)
ARS- Agricultural research Station, MARS-Main Agricultural Research Station.
937
Int.J.Curr.Microbiol.App.Sci (2018) 7(11): 929-944
Table.2 Mean and range for different traits in G. hirsutum germplasm lines evaluated in five environments
Season
Mean
Min.
Max.
CD at 95%
CD at 99%
CV (%)
E1
E2
E3
E4
E5
Pooled
E1
E2
E3
E4
E5
Pooled
E1
E2
E3
E4
E5
Pooled
E1
E2
E3
E4
E5
Pooled
E1
E2
E3
E4
E5
Pooled
E1
E2
E3
E4
E5
Pooled
Plant
height
(cm)
94.6
72.3
93.5
101.4
117.4
95.8
26.3
41.1
58.7
57.4
81.0
71.5
142.5
104.3
131.5
135.8
174.9
121.4
25.10
14.07
17.91
18.62
26.82
20.51
33.05
18.53
23.59
24.53
35.33
27.01
13.48
9.89
9.74
9.34
11.61
10.81
Number of
monopodia
Number of
sympodia
Number
of bolls
1.32
1.98
1.71
1.30
2.07
1.67
0.17
0.46
0.30
0.20
0.45
0.74
3.13
4.33
3.70
2.95
3.80
2.89
0.45
0.45
0.63
0.50
0.63
0.53
0.59
0.59
0.83
0.66
0.83
0.70
17.23
11.51
18.77
19.61
15.50
16.52
12.1
26.1
13.5
11.2
17.5
16.1
4.8
8.6
8.1
5.2
11.0
10.3
21.9
41.3
21.4
17.6
35.1
20.5
4.27
6.48
3.62
3.60
5.56
4.70
5.62
8.53
4.76
4.74
7.33
6.20
17.92
12.61
13.62
16.32
16.16
15.33
13.0
10.2
14.8
15.1
15.4
13.7
2.7
0.4
7.2
7.0
8.3
8.1
21.4
31.1
26.0
23.7
22.8
21.2
2.15
3.52
4.61
4.73
4.65
3.93
2.83
4.64
6.07
6.23
6.12
5.18
8.39
17.54
15.83
15.92
15.34
14.60
Number of
fruiting
points
40.2
39.2
36.5
27.9
48.1
38.4
13.8
15.8
20.8
16.5
29.2
26.0
96.3
98.3
54.1
47.7
67.4
63.3
9.68
8.58
8.52
9.09
7.77
8.73
12.75
11.31
11.22
11.97
10.23
11.50
12.24
11.13
11.86
16.55
8.21
12.00
Boll
weight(g)
4.35
3.75
4.40
4.11
4.52
4.23
2.98
2.58
2.80
2.73
3.15
3.12
6.74
5.05
6.10
5.79
6.43
5.23
0.95
0.69
0.44
0.40
0.58
0.61
1.25
0.91
0.58
0.53
0.76
0.81
11.05
9.39
5.08
4.99
6.49
7.40
Ginning
Outturn
(%)
36.01
36.53
36.76
35.91
36.60
36.36
25.31
28.50
29.82
28.75
30.22
30.05
42.46
41.04
40.89
40.75
40.32
40.23
5.73
4.75
3.01
3.96
3.56
4.20
7.55
6.25
3.96
5.21
4.69
5.53
8.09
6.60
4.16
5.60
4.94
5.88
Seed index
(g)
Lint index
(g)
SCY
(Kg/ha)
10.73
7.60
9.23
8.63
8.69
8.98
6.35
4.15
6.75
6.25
6.50
6.60
14.35
11.65
12.50
12.75
12.00
12.15
1.72
1.59
1.13
1.01
0.97
1.28
2.26
2.09
1.49
1.33
1.27
1.69
8.14
10.62
6.24
5.95
5.65
7.32
6.05
4.39
5.37
4.84
5.02
5.14
2.21
2.15
3.40
2.97
3.06
3.64
10.02
7.59
7.42
7.26
6.74
6.95
0.71
0.43
0.96
1.01
0.87
0.79
0.93
0.56
1.27
1.32
1.14
1.05
5.96
4.94
9.12
10.56
8.80
7.87
1804
556
2250
1312
1532
1491
412
255
675
539
614
770
3460
1414
3874
2414
3314
2263
382.48
127.67
575.98
293.58
328.17
341.58
503.77
168.16
758.64
386.67
432.24
449.89
10.78
11.67
13.01
11.37
10.89
11.54
E1-ARS, Dharwad (2011), E2- ARS, Dharwad (2012), E3 – ARS, Dharwad (2013), E4-MARS, Dharwad (2013) and E5 – ARS, Bagalkot (2013)
938
Int.J.Curr.Microbiol.App.Sci (2018) 7(11): 929-944
Table.3 Performance of G. hirsutum check lines varieties
Season
Plant
height (cm)
Number of
monopodia
Number of
sympodia
Number
of bolls
Number of
Boll
Ginning
Seed
Lint index
fruiting
weight(g)
Outturn
index (g)
(g)
points
(%)
E1
101.0
1.76
13.1
12.4
23.9
4.19
36.13
9.54
5.43
Sahana
E2
62.2
1.81
17.2
6.1
22.4
4.00
35.00
7.35
3.97
E3
103.5
1.90
13.3
16.6
37.8
4.29
38.80
10.25
5.74
E4
112.2
1.50
15.1
14.1
29.0
3.69
36.08
9.75
5.51
E5
121.5
2.40
16.3
13.9
40.4
4.55
37.89
9.75
5.95
Mean
100.1
1.87
15.0
12.6
30.7
4.14
36.78
9.33
5.32
E1
104.0
2.02
13.8
14.3
25.7
3.83
34.49
9.04
4.78
Surabi
E2
69.2
1.81
23.2
12.5
24.2
2.98
34.76
7.35
3.93
E3
106.2
2.10
12.3
13.8
32.0
3.94
34.73
9.75
5.19
E4
114.9
1.70
14.1
16.1
23.2
3.48
32.98
9.25
4.55
E5
124.2
3.05
15.3
16.1
44.6
4.68
35.83
8.75
4.89
Mean
103.7
2.14
15.7
14.6
29.9
3.78
34.56
8.83
4.67
E1
88.1
1.94
14.2
14.2
42.0
3.94
36.62
7.68
4.49
MCU 5
E2
77.7
2.06
26.3
14.8
45.0
3.44
35.41
7.05
3.88
E3
79.4
1.80
8.1
12.2
28.2
4.06
38.54
8.50
5.34
E4
88.0
1.40
7.4
14.5
19.3
3.49
36.01
8.00
4.49
E5
97.4
2.30
11.0
14.5
40.8
4.40
34.96
7.00
3.77
Mean
86.1
1.90
13.4
14.0
35.0
3.87
36.31
7.65
4.39
E1
92.1
1.97
15.1
14.7
36.5
4.47
37.25
8.18
4.84
DS 28
E2
58.9
1.37
19.7
14.2
33.0
3.81
39.19
6.05
3.92
E3
92.8
2.20
12.2
16.1
35.3
4.90
37.63
9.50
5.73
E4
101.4
1.80
13.0
11.1
26.4
4.11
36.95
8.75
5.13
E5
110.8
3.20
15.1
13.4
47.9
4.98
36.93
8.25
4.84
Mean
91.2
2.11
15.0
13.9
35.8
4.45
37.59
8.15
4.89
E1
97.5
2.39
16.1
20.7
67.3
4.31
37.16
7.44
4.40
ARBH 813
E2
62.5
2.59
26.9
16.5
63.8
3.77
38.74
6.75
4.28
E3
96.8
2.30
14.3
23.9
39.6
4.79
37.65
8.25
5.01
E4
105.5
1.90
11.1
18.9
30.8
4.27
35.27
7.75
4.25
E5
114.8
2.80
17.3
21.2
52.2
4.48
37.86
7.75
4.73
Mean
95.4
2.40
17.1
20.3
50.7
4.32
37.33
7.59
4.53
E1-ARS, Dharwad (2011), E2- ARS, Dharwad (2012), E3 – ARS, Dharwad (2013), E4-MARS, Dharwad (2013) and E5 – ARS, Bagalkot (2013)
939
SCY
(Kg/ha)
1625
364
2498
1350
2256
1619
1708
848
2607
1464
1881
1702
1409
581
1841
1461
1739
1406
1288
753
1568
1060
1859
1305
1867
636
3127
1692
2150
1894
Int.J.Curr.Microbiol.App.Sci (2018) 7(11): 929-944
Table.4 Pooled analysis of variance for fiber traits in germplasm collection evaluated during
2013 in two environments
Source of
variation
Repliaction
Genotypes
Environment
Error
Location
df
E3
E5
E3
E5
Pooled
1
1
319
E3
E5
Pooled
1
319
2.5% Span
length (mm)
0.0015
2.50
9.29**
7.584**
13.01**
323.08**
0.0015
1.095
3.866
Uniformity
ratio (%)
0.225
0.126
4.926**
4.536**
6.288**
100.1**
1.04
2.214
3.17
Micronaire
(g/in)
0..007
0.018
0.41**
0.326**
0.517*
1.444**
0.048
0.034
0.219
Tenacity
(g/tex)
0.324
0.306
4.261**
3.219**
4.729**
23.05**
1.187
0.466
2.75
E3 – ARS, Dharwad and E5 – ARS, Bagalkot
*, ** significant at 5% and 1% levels respectively
Table.5 Mean, range and performance of different G. hirsutum check lines for fiber traits
evaluated during 2013 at two locations
Mean
Min
Max
Sahana
Surabhi
MCU 5
DS 28
ARBH 813
CD @ 5%
CV
Locations
2.5% Span length (mm)
E3
E5
Mean
E3
E5
Mean
E3
E5
Mean
E3
E5
Mean
E3
E5
Mean
E3
E5
Mean
E3
E5
Mean
E3
E5
Mean
E3
E5
Mean
E3
E5
28.5
27.5
28.0
22.5
22.8
23.2
36.3
33.4
33.2
29.5
29.3
29.4
30.3
27.5
28.9
26.8
22.8
24.8
30.3
29.1
29.7
28.5
28.3
28.4
0.08
2.06
3.87
0.14
3.80
E3 – ARS, Dharwad (2013) and E5 – ARS, Bagalkot (2013)
940
Uniformity ratio
(%)
47.5
48.0
47.8
40.0
44.0
44.0
53.0
52.0
52.5
47.0
47.0
47.0
48.0
49.0
48.5
49.0
51.0
50.0
47.0
48.0
47.5
48.0
47.0
47.5
2.01
2.93
3.50
2.14
3.10
Micronaire (g/in)
Tenacity (g/tex)
3.97
3.99
3.98
2.20
2.90
2.85
5.10
5.20
4.85
3.30
3.50
3.40
3.60
3.90
3.75
4.20
5.20
4.70
3.90
4.50
4.20
4.30
4.70
4.50
0.432
0.366
0.921
5.60
4.66
21.98
21.68
21.83
18.40
18.50
18.45
26.00
26.80
24.85
21.10
22.10
21.60
24.30
22.80
23.55
22.60
19.90
21.25
23.50
22.40
22.95
22.40
21.80
22.10
2.14
1.34
3.26
4.97
3.15
Int.J.Curr.Microbiol.App.Sci (2018) 7(11): 929-944
It is also measure of lint yielding ability of a
genotype which is used as raw material for
textile industry. In present study, the variation
recorded for lint index was from 3.64g to
6.95g. Three germplasm lines recorded 20
percent higher lint index than superior check,
Sahana (5.32g). The genotypes like CPD-476,
CPD-423, CPD-420, CPD-921, Abadhita and
ARB-760 recorded high lint index (>6.0g)
with high ginning outturn (>39.0 percent) and
seed index (>9.3g), whereas the germplasm
lines EC560395, EC137592, ACP-71, JBWR23, IC356874 and L-761 exhibited high seed
index (10.0g), with high lint index (>5.5g)
and low ginning outturn (<35 percent). The
genotypes like FQT-21, CAK-023A, CSHH198F-Sirsa,
543395A03N98,
F-2226,
543370A02N62 have recorded high seed
index (>9.5g), low lint index (<4.5g) and low
ginning outturn (<33 percent). Whereas,
GTHV-08-70 (3.64g) recorded low and
statistically on par with inferior check, MCU
5 (4.39g) over five environments. The
variation observed for this trait was 2.21g to
10.02g, 2.15g to 7.59g, 3.40g to 7.42g, 2.97g
to 7.26g and 3.06g to 6.74g with the mean
values of 6.05g, 4.39g, 5.37g, 4.84g and 5.02g
in E1, E2, E3, E4 and E5 respectively.
Krishnadoss and Kadambavanasundaram
(1997) observed 4.3g lint index. Nagaraj et
al., (2008) recorded 5.12 g lint index in elite
germplasm lines. Bourland and Jones (2010)
registered genotypes with 7.5 g lint index.
cultivation. They possessed desirable level of
ginning outturn (35.26 to 38.74%), longer
fiber length (27.9 to 31.7 mm except one
genotype with 25.4 mm) and desirable fiber
strength (20.4 to 23.0 g/tex). 25 germplasm
lines were significantly inferior and four
germplasm lines recorded 40 percent lower
seed cotton yield than inferior check, MCU 5
(1406 Kg/ha) and among genotypes IC357200
observe lowest yield 770 Kg per. In cotton,
important yield contributing traits are number
of bolls, boll weight and number of sympodia
per plant. The development of superior lines
for seed cotton yield depends on seed cotton
yield per plant itself or number of bolls, boll
weight and number of sympodia per plant.
The range of variation was 412 to 3460 Kg
per hectare, 255 to 1414 Kg per hectare, 675
to 3874 Kg per hectare, 539 to 2414 Kg per
hectare and 614 to 3314 Kg per hectare with
mean values 1804, 556, 2250, 1312 and 1532
Kg per hectare in E1, E2, E3, E4 and E5
environments respectively. Dhamayanthi et
al., (2008) observed seed cotton yield of 2301
kg/ha while handling the G. hirsutum x G.
barbadense genotypes. Baig et al., (2009)
reported 1121kg/ha in G. arboreum
genotypes. Patel et al., (2009) recorded
maximum of 96.51 g plant yield in Asiatic
cotton lines. Bourland and Jones (2009)
observed lint yield of 1265 and 1198 kg/ha
from Arkot 9623 and Arkot 9625,
respectively.
Out of 320 germplasm lines studied, the three
germplasm viz., EC296596 (2263 Kg/ha),
128333-Acala-44
(2258
Kg/ha)
and543416A03N132 (2250 Kg/ha) recorded
significantly higher yield than high yielding
check and six other genotypes although
statistically on par but recorded more than 10
percent seed cotton yield than superior check,
ARBH 813 (1894 Kg/ha). Therefore nine
germplasm lines can be potentially used to
identify directly as varieties for commercial
The variability of the fiber properties in
cotton is an unfavourable element in a market
that pits this natural fiber against artificial,
more uniform products represented by
synthetic fibers. Fiber properties vary as a
function of the cultivar but also as a function
of the environment and production practices
(Clouvel et al., 1998). The mean sum of
squares for fiber quality traits in 320 G.
hirsutum cotton germplasm evaluated in two
environments are presented in Table 4. The
941
Int.J.Curr.Microbiol.App.Sci (2018) 7(11): 929-944
analysis of variance indicated presence of
significant variability among the germplasm
lines for all four fiber quality traits. The data
on mean and range for yield and fiber traits
are presented in Table 5 including checks.
statistically on par with superior check,
ARBH 813 for seed cotton yield (1555 to
1866 Kg/ha). Whereas, it was weakest in
EC138566 (18.45 g/tex) and on par with
inferior check, MCU 5 (21.25 g/tex) over two
environments. Mean of germplasm lines for
fibre strength was 21.94 g/tex and 21.68 g/tex
in E3 and E5 environments respectively.
Katarki (1971) developed an interspecific
hybrid Varalaxmi with 24.8 g/tex fibre
strength. Kulkarni and Khadi (1998)
developed DLSa-17 variety of G. arboreum
having fibre strength of 19-21 g/tex. Twenty
three recombinant lines were obtained by
Katageri et al., (2003) which recorded fibre
strength of 22 g/tex.
Longer fiber is important in the textile
industry because it produces stronger yarn
leading to higher-priced end products.
Recorded 2.5% span length was longest in
CPD-476 (33.2 mm) which was on par with
the superior check, DS 28 (29.7 mm) fallowed
by five germplasm lines viz., FQT-21 (31.8
mm), IC356874 (30.9 mm), ADB-39 (30.9
mm), CPD-437 (30.0 mm) and EC559012
(30.0 mm) with good fiber strength (23.2 to
24.7 g/tex) and on par with ARBH 813 for
seed cotton yield (1555 to 1966 Kg/ha).
Whereas, EC138566 (23.2 mm) recorded
lower 2.5% span length than MCU 5 (24.8
mm) with the mean of 28.0 mm over two
environments. In E3 and E5 environments,
2.5% span length was highest in IC357200
(36.3 mm) and CPD-445 (33.4 mm) whereas,
it was lowest in IC359059 (22.5 mm) and
GTHV-08-70 (22.8 mm) with mean of
germplasm 28.5 mm and 27.5 mm
respectively. Varalaxmi has fibre length of
32.7mm in upland cotton developed by
Katarki (1971). Katageri et al., (2003)
recorded 30.0 mm fibre length in recombinant
lines. Nagaraj et al., (2008) observed 27.12
mm fibre length in 20 elite germplasm lines.
Highest uniformity ratio was recorded by
CPD-921 (53.0%, 52.0% and 52.5%) than
superior check, MCU 5 (49.0%, 51% and
50.0%) in E3, E5 and over two environments
respectively followed by 100 germplasm lines
recorded more than 48 percent uniformity
ratio, which is considered to be excellent and
statistically on par with superior check, MCU
5 (50.0%). However, it was lowest in
IC357200 (44.0%) followed by three lines
recorded less than 45 percent uniformity ratio
over the check, Sahana (47.0%) over two
environments that is below average grade for
uniformity ratio.48.26 % uniformity ratio was
noticed in 20 elite germplasm lines by
Nagaraj et al., (2008).
Fiber strength is defined as the force
necessary to break the fibers and depends on
diameter of the cotton fibers. The average
acceptable value of cotton fiber strength is 20
to 24 g/tex. It directly affects yarn strength.
Strong yarn is processed efficiently and easily
resulting in high yarn yield. Five genotypes
like, FQT-21 (24.7 g/tex), ADB-39 (24.5
g/tex), IC359088 (23.7 g/tex), CPD-824 (23.7
g/tex) and IC356874 (23.6 g/tex) recorded
high fiber strength with long fiber length
(27.4 to 31.8 mm) and they are also
Micronaire is the measure of fiber fineness.
Thinner fibers are more durable, brighter and
softer. Fine fiber forms stronger yarn and
directly affects processing stages. In the
present study, five germplasm lines have
recorded more than 4.7 µg/in and fifteen lines
have recorded fine microniare value lower
than Sahana (3.4 µg/in). Among them the line
EC170338 (4.9 µg/in) was statistically on par
with MCU 5 (4.7 µg/in), whereas it was finest
in 543370A02N62 (2.9 µg/in) and on par with
check, Sahana (3.4 µg/in) over two
942
Int.J.Curr.Microbiol.App.Sci (2018) 7(11): 929-944
environments. Mean of germplasm lines for
micronaire value was 3.92 µg/in (E3) and
3.99 µg/in (E5). Krishnaswami and
Kothandraman (1975) observed lines with 4.0
g per inch micronaire. Nagaraj et al., (2008)
noticed 3.74 g per inch micronaire value in
study of 20 elite germplasm lines.
Katarki, B. H., 1971, Varalxmi, A high
yielding hybrid cotton of quality. Indian
Farming, 21(8): 35-36
Krishnadoss, D. and Kadambavanasundaram,
M., 1997, Heterosis in intra and inter
specific hybrids in tetraploid cotton. J.
Indian Soc. Cotton Improv., pp. 110116.
Kulkarni, V. N. and Khadi, B. M., 1998, Long
lint G. arboreum for meeting textile
needs. New Frontiers in Cotton
Research: Proceedings of World Cotton
Research Conference-Ii, Athens, Grace,
Sept. 6-12.
Manjula, S. M., Khadi, B. M., Pawar, S. V.,
Shobha Immadi and Katageri, I S.,
2004, Improvement of G. herbaceum
through
introgression
breeding.
International Symposium on Strategies
for Sustainable Cotton Production - A
Global Vision, 1, Crop Improvement,
23-25 Nov, Univ. Agric. Sci., Dharwad,
Karnataka (India).
Meena, R., Mongo, A. D., Rajiv Kumar and
Hamid Hasan, 2006, Screening of
American cotton (G. hirsutum) and Desi
cotton (G. arboreum) for fibre quality
traits, seed cotton yield and important
yield components. Indian J. Plant
Genet. Reso., 19(1): 122-124.
Meena, R., Mongo, A. D., Rajiv Kumar and
Hamid Hasan, 2006, Screening of
American cotton (G. hirsutum) and Desi
cotton (G. arboreum) for fibre quality
traits, seed cotton yield and important
yield components. Indian J. Plant
Genet. Reso., 19(1): 122-124.
Nagaraj Basavaraddi, Katageri, I. S., Savita,
M. and Khadi, B. M., 2008, Assessment
of genetic divergence in elite cotton
lines (G. hirsutum L.). J, Indian Soc,
Cotton Improv, Dec., 105-112.
Palomo Artura and Davis, D. D., 1983,
Response of an F1 interspecific (G.
hirsutum x G. barbadense) cotton
In conclusion the germplasm collections
represent a valuable resource with more yield
potential along with superior quality which
were used for improving cotton varieties with
high fibre yield and fiber quality and which
are desirable source for the cotton breeding
programme in wishes to transfer the desirable
traits from the germplasm source to otherwise
adapted agricultural cultivars.
References
Baig, K. S., Chavon, M. H. and Kakde, S. S.,
2009, Screening of G. arboreum, G.
hirsutum and introgressed diploid and
tetraploid
strains
derived
from
interspecific hybridization between
cultivated species of cotton for drought
tolerance. J. Cotton Res. Dev., 28 (1) 813.
Bourland, F. M. and Jones, D. C., 2010,
Registration of Arkot 9811 and Arkot
9815 germplasm lines of cotton. J.
Plant Regist., 4(3): 232-235.
Clouvel, P., Goze, E., Sequeira, R., Dusserre,
J. and Cretener. M., 1998, Variability of
Cotton Fiber Quality. p. 963-966. In
Proc.
World
Cotton
Research
Conference 2, “New Frontiers in Cotton
Research” 6-12 Sept. Athens, Greece.
Katageri, I. S., Khadi, B. M. Manohas, K.,
Soregaon, C. D. Vamadevaiah, H. M.
Manjula, S. and Badigannavas, A. M.
2003, Recombinant lines in cotton
(Gossypium spp). Papers Presented at
World – Cotton Research Conference
III, held at Cape Town South Africa. 913 March.
943
Int.J.Curr.Microbiol.App.Sci (2018) 7(11): 929-944
hybrid to plant density in narrow rows.
Crop Sci., 23: 1053-1056.
Patel, A. I., Mali, S. C., Chhimpi, B. G. and
Patel, U. G., 2009, Stability analysis for
seed cotton yield and component traits
in intra and inter specific crosses of
GMS based Asiatic cotton. Research on
Crops, 10(3): 655-662.
Stoskopf, N. C., Tomes, D. T. and Christie, B.
R., 1993. Plant Breeding, Theory and
Practice.
Westview
Press,
Inc.
Colorado.
Tuteja, O. P., Sunil Kumar and Mahender
Singh, 2006, Selection parameters and
yield enhancement of upland cotton (G.
hirsutum) under irrigated ecosystems of
north India. Indian J. Agric. Sci., 76(2):
77-80.
Verma, S. K. and Tuteja, O P., 2008,
Assessment of genetic divergence
among genotypes of upland cotton (G.
hirsutum
L.)
having
different
cytoplasmic background. J. Indian Soc.
Cotton Improv., April, 1-7.
How to cite this article:
Suresh S. Handi and Katageri, I.S. 2018. Multi-Environment Evaluation to Identify Promising
Germplasm Lines for Economically Important Traits in G. hirsutum Cotton.
Int.J.Curr.Microbiol.App.Sci. 7(11): 929-944. doi: />
944