A quantitative multimodal metabolomic assay for colorectal cancer
Bạn đang xem bản rút gọn của tài liệu. Xem và tải ngay bản đầy đủ của tài liệu tại đây (1013.88 KB, 12 trang )
Farshidfar et al. BMC Cancer (2018) 18:26
DOI 10.1186/s12885-017-3923-z
RESEARCH ARTICLE
Open Access
A quantitative multimodal metabolomic
assay for colorectal cancer
Farshad Farshidfar1,2, Karen A. Kopciuk3,7, Robert Hilsden4,6, S. Elizabeth McGregor2,7, Vera C. Mazurak8,
W. Donald Buie1, Anthony MacLean1, Hans J. Vogel5 and Oliver F. Bathe1,2,9*
Abstract
Background: Early diagnosis of colorectal cancer (CRC) simplifies treatment and improves treatment outcomes. We
previously described a diagnostic metabolomic biomarker derived from semi-quantitative gas chromatographymass spectrometry. Our objective was to determine whether a quantitative assay of additional metabolomic
features, including parts of the lipidome could enhance diagnostic power; and whether there was an advantage to
deriving a combined diagnostic signature with a broader metabolomic representation.
Methods: The well-characterized Biocrates P150 kit was used to quantify 163 metabolites in patients with CRC
(N = 62), adenoma (N = 31), and age- and gender-matched disease-free controls (N = 81). Metabolites included in
the analysis included phosphatidylcholines, sphingomyelins, acylcarnitines, and amino acids. Using a training set of
32 CRC and 21 disease-free controls, a multivariate metabolomic orthogonal partial least squares (OPLS) classifier
was developed. An independent set of 28 CRC and 20 matched healthy controls was used for validation. Features
characterizing 31 colorectal adenomas from their healthy matched controls were also explored, and a multivariate
OPLS classifier for colorectal adenoma could be proposed.
Results: The metabolomic profile that distinguished CRC from controls consisted of 48 metabolites (R2Y = 0.83,
Q2Y = 0.75, CV-ANOVA p-value < 0.00001). In this quantitative assay, the coefficient of variance for each metabolite
was <10%, and this dramatically enhanced the separation of these groups. Independent validation resulted in
AUROC of 0.98 (95% CI, 0.93–1.00) and sensitivity and specificity of 93% and 95%. Similarly, we were able to
distinguish adenoma from controls (R2Y = 0.30, Q2Y = 0.20, CV-ANOVA p-value = 0.01; internal AUROC = 0.82 (95%
CI, 0.72–0.93)). When combined with the previously generated GC-MS signatures for CRC and adenoma, the
candidate biomarker performance improved slightly.
Conclusion: The diagnostic power for metabolomic tests for colorectal neoplasia can be improved by utilizing a
multimodal approach and combining metabolites from diverse chemical classes. In addition, quantification of
metabolites enhances separation of disease-specific metabolomic profiles. Our future efforts will be focused on
developing a quantitative assay for the metabolites comprising the optimal diagnostic biomarker.
Keywords: Colorectal cancer, Metabolomics, Colorectal adenoma, Colorectal adenocarcinoma, Metabolomics profiling,
Mass spectrometry, Cancer biomarker
* Correspondence:
1
Department of Surgery, University of Calgary, Calgary, AB, Canada
2
Department of Oncology, University of Calgary, Calgary, AB, Canada
Full list of author information is available at the end of the article
© The Author(s). 2018 Open Access This article is distributed under the terms of the Creative Commons Attribution 4.0
International License ( which permits unrestricted use, distribution, and
reproduction in any medium, provided you give appropriate credit to the original author(s) and the source, provide a link to
the Creative Commons license, and indicate if changes were made. The Creative Commons Public Domain Dedication waiver
( applies to the data made available in this article, unless otherwise stated.
Farshidfar et al. BMC Cancer (2018) 18:26
Background
Colorectal cancer (CRC) is the third most common cause
of cancer death worldwide. Early diagnosis is important,
as early disease is curable [1–3] and management of the
more advanced disease is more complex as well as more
morbid. Currently screening efforts hinge on colonoscopy
and fecal occult blood tests. Colonoscopy is extremely
sensitive, and it is capable of detecting (and treating) very
early premalignant disease. However, it is invasive and difficult to apply to large populations in an efficacious manner. Fecal tests have been used to enrich the population
that should undergo colonoscopy. Unfortunately, their implementation as a broadly applied screening tests is hampered by low patient acceptance and low compliance. A
single blood test for CRC may be more acceptable to patients, and could potentially represent an attractive alternative, especially if it is more sensitive than fecal tests.
We have previously identified a number of changes in
sugar derivative structures, amino acids, and short-chain
fatty acids in the serum metabolome in association with
CRC [4, 5]. These validated changes were identified
using gas chromatography-time of flight-mass spectrometry (GC-TOF-MS), and they could represent the basis
for a future blood test. In this work, we sought to determine whether a more comprehensive coverage of the
metabolome may enhance the performance of this diagnostic test. Specifically lipid-consisting molecules, including lipoproteins have been shown by others to be
altered in the serum of patients with CRC [6, 7], and so
we postulated that these perturbations would further inform a diagnostic metabolomic biomarker for CRC.
Our objective was to determine whether a fully quantitative metabolomic test enhances one’s capability to discriminate between disease states. To this end, we profiled CRC
using the quantitative mass spectrometry-based metabolomic Biocrates assay. The assay provided measurements of a
broad array of endogenous lipids (including glycerophospholipids (phosphatidylcholines and lysophosphatidylcholines), sphingolipids) and acylcarnitines, as well as 14 amino
acids. In addition to exploring the potential value of this
quantitative approach to the development of a diagnostic
test, the biological implications of our findings were evaluated. Finally, we assessed whether the addition of these metabolites to the diagnostic model that was previously
devised using GC-MS profiling [5] would add to the diagnostic power of the metabolomic profile.
Methods
Sample collection
This study was approved by the Conjoint Health Research
Ethics Board at the University of Calgary (Ethics ID number
E21805) and conforms to the Helsinki Declaration (October 2008). Colorectal cancer serum samples from patients
in stage I, stage II, and stage III (locoregional CRC), and
Page 2 of 12
stage IVa (liver-limited metastasis) along with the relevant
clinical information were collected in a prospective cohort
of colorectal cancer patients, diagnosed at the Foothills
Medical Center or referred to this center for resection and
management of their primary adenocarcinoma or metastatic CRC and provided written consent, between 2006
and 2012. Patients with extrahepatic metastases, any acute
inflammatory state, sepsis, and familial colorectal adenomatosis or cancer cases were excluded from this study. Colorectal adenoma samples and control samples were
collected prospectively by the Forzani & MacPhail Colon
Cancer Screening Centre (CCSC) at the University of Calgary. Disease-free controls consisted of individuals who
underwent screening colonoscopy and were found not to
have CRC or adenoma. CRC, adenoma, and control cases
were all fasting for a minimum of 8 h before surgery or
endoscopic procedure. Surgical pathology for CRC patients
and endoscopic pathology for adenoma and control cases
were obtained and thoroughly reviewed, and all diagnoses
were confirmed. Control samples are matched for age and
gender with adenoma and cancer patients. Samples were
collected in plastic gold top vacutainer tubes (BD Biosciences, Mississauga, Ontario, Canada), which contain a clot
activator and a proprietary gel for serum separation. Samples were processed in 6-h time from collection and were
stored in −20°c freezers until the day of analysis [8, 9].
Quantitative profiling by flow injection analysis-tandem
mass spectrometry (FIA-MS/MS)
In these studies, we used quantitative Biocrates AbsoluteIDQ p150 Kit (Biocrates Life Sciences AG, Austria) which
can measure the concentration of 163 endogenous metabolites from 4 biochemical classes, using a panel of 27 validated internal controls. These metabolites are selected
from four classes of acylcarnitines, biogenic amines, sphingolipids, and glycerophospholipids (lyso-phosphatidylcholines and phosphatidylcholines). Detailed preparation steps
have been previously described [10]. In brief, 10 μl of each
serum sample was prepared and submitted to mass spectrometric analysis on an API4000 Qtrap® tandem mass
spectrometry instrument (Applied Biosystems/MDS Analytical Technologies, Foster City, CA) equipped with a solvent delivery system, in both positive and negative ion
modes. Selective multiple reaction monitoring (MRM) detections of chemical homologs in conjunction with stable
isotope-labeled internal controls, provided in the kit plate
filter, was utilized for metabolite quantification. This
method is shown to be in compliance with the FDA guidance for industry- Bioanalytical method validation [11], indicating proof of reproducibility in the given range.
External quality control samples consisted of four commercially available human serum samples (Sigma-Aldrich,
Germany) as well as four pooled serum samples from our
controls for each kit. The final metabolite concentrations
Farshidfar et al. BMC Cancer (2018) 18:26
were automatically calculated by MetIDQ, the proprietary
software of the kit. Metabolites were checked for the coefficient of variance >0.25 in quality controls, and all passed
the check. The concentrations of 146 metabolites were
above the limit of detection, and these metabolites were selected for further analysis. Missing values were imputed
with the minimum value in the dataset. The pre-processed
data were then transferred for further statistical analyses.
Data analysis
Throughout this study, wherever a two group statistical
comparison were desired, a two-sided Student’s t-test was
used. We considered a priori p-value smaller than 0.05 as
statistically significant. Where required, the significance
thresholds adjusted by Holm-Bonferroni correction
method were used. For analysis of stage-dependent variations in more than two groups, Bonferroni-corrected
Kruskal-Wallis Test [8] (non-parametric approach) was
computed by Multi-Experiment Viewer (MeV), version
4.9 (The TM4 Software Development Team) [9]. To generate heatmaps, we used the Spearman’s Rank Correlation
distance metrics and complete linkage method.
The pre-processed data from MetIDQ were logtransformed and autoscaled (unit variate scaled and
centered) before importing the SIMCA multivariate analytical software (Version 14.0.0, Umetrics AB, Sweden).
Owing to the quantitative nature of the assay, we require
median fold change normalization to account for intersample analytical biases. To evaluate the risk of overfitting bias on a dataset with small sample size, a preanalysis permutation test of 10,000 iterations was applied
on sample classes in the training set, as described before
by Westerhuis et al. [12]. As for the combinatorial
analysis, the relevant datasets were joined and then
block-transformed [13–16]. For each comparison, an exploratory Principal Component Analysis (PCA) with up
to three components was used for discovering intrinsic
clusters and revealing potential outliers. After exclusion
of outliers, subsets of potentially significant metabolites
for each comparison were selected by performing Welch’s
t-test (assuming unequal variances). This filtering
procedure was performed by setting a pre-test maximum
p-value threshold of 0.30 in the Welch test, which
removes clearly uniformative metabolites from further
analysis [4, 17, 18]. Selected subsets were used for orthogonal partial least squares discriminant analysis
(OPLS-DA) or O2-PLS-DA. Further refinement was applied through excluding metabolites with variable importance on projection (VIP) of less than a threshold. This
VIP threshold was set separately for each analysis, so as
the maximum for R2Y and Q2Y are obtained and their
difference is at minimum. This approach has shown to be
sufficiently reliable for the purpose of multivariate statistical analyses, including OPLS-DA [4, 17].
Page 3 of 12
To assess the performance of supervised multivariate
models, including OPLS-DA and O2PLS-DA, R2Y and
Q2Y scores were used for measurement of the dataset
variance covered by the model, and the predictability of
the model in 7-fold cross-validation [4]. Models with the
difference of more than 0.2 between R2Y and Q2Y were
reevaluated. Potential confounders in each model were
evaluated for their unwanted effects, as described in the
Results section. Also, to examine the PLS-DA and OPLSDA models for validity and potential overfit, a permutation test of 999 iterations was applied to each model, and
the results were reported as Q2-intercept for that model
[19]. Q2-intercept is the intercept of a line fitted to Q2Y
scores versus the correlation of the permutated Y-vector
and original Y-vector for each iteration. The model is valid
and non-random if Q2 intercept is at or below zero [20].
Predictive performance of the generated models in external validation were evaluated by the area under the
receiver operating characteristic curves (AUROC), which
were calculated by GraphPad Prism (version 6.01 for
Windows, GraphPad Software, La Jolla California USA,
www.graphpad.com).
Results
Patients and demographics
The characteristics of the study cohort are summarized in
Table 1. Samples were randomly assigned to the training
set and validation set, in a stratified design for locoregional CRC (stages I, II, and III), and liver-limited metastatic
CRC (stage IVa). In patients with stage IVA disease, 17
(45%) received chemotherapy within 3 months before
sampling; 8 patients (33%) with non-metastatic disease received chemotherapy before sampling.
Identification of metabolites associated with CRC
To quantitatively evaluate serum composition of amino
acids, acylcarnitines, and lipid compounds, including glycerophospholipids and sphingolipids, we submitted samples
to semi-quantitative FIA-MS/MS. Out of 163 measured
metabolites, 146 metabolites could be reliably found in all
groups of patients and controls (Additional file 1: Table S1).
Three samples were identified as outliers on PCA, and they
were excluded from further analysis. We also evaluated for
a potential confounding effect of pre-sampling chemotherapy on the metabolomic profile of CRC patients (Additional file 2: Fig. S1A to E). We could not identify any
cluster linked to the chemotherapy status. The training set
consisted of 53 samples (controls (N = 21), stage I (N = 5),
stage II (N = 5), stage III (N = 5) and stage IVa (N = 17)
cases). Following filtering by p-value and VIP (>1), 48 metabolites were employed in the metabolomic model, which
resulted in an encouraging model: R2Y was 0.83 and Q2Y
was 0.75; CV-ANOVA was <0.00001 (Fig. 1a and b, and
Table 2). The model was then tested on an independent
Farshidfar et al. BMC Cancer (2018) 18:26
Page 4 of 12
Table 1 Demographics and clinical factors of patients and controls. Numbers in parentheses represent percent, unless otherwise
noted. Disease-free controls (N = 31) were matched with the adenoma cases, and 50 controls were matched with patients with CRC
Subgroup
Control
Adenoma Stage I
Stage II
Stage III
Stage IVa
N
31 + 9 + 41 31
8
8
8
38
Age, mean (SD)
60.5 (6.7)
76.9 (6.1)
67.3 (9.8)
62.8 (14.8)
60.5 (9.9)
Gender
Primary Site
Differentiation
Staging T
Staging N
Tumor dimension (cm)
59.5 (5.9)
Male
58 (72)
21(68)
5 (63)
7(88)
4 (50)
30 (79)
Female
23 (28)
10 (32)
3 (37)
1 (11.2)
4 (50)
8 (11)
Colon
–
–
2
3
5
–
Rectum
–
–
5
4
3
–
Unknown
–
–
1
1
0
–
Poor
–
–
0
1
2
3
Moderate
–
–
4
5
4
26
Well
–
–
2
0
2
0
Unspecified
–
–
2
2
0
7 (+2
mucinous)
T1
–
–
1
–
3
–
T2
–
–
5
–
2
–
T3
–
–
–
7
1
–
–
T4
–
–
–
0
0
Unspecified
–
–
2
1
2
N1
–
–
–
–
4 (N1a = 2)
(N1b = 2)
8
N2
–
–
–
–
2 (N2a = 1)
(N2b = 1)
8
Unspecified
–
–
–
–
2
22
Largest dimension, mean
(SD)
–
–
2.67
(1.50)
3.51
(1.99)
2.7 (2.09)
2.50 (1.49)
0.5–5
2.5–6
2.8–5.5
0.9–5.1
–
–
1 (13)
3 (38)
4 (50)
17 (45)
Min-Max
Pre-sampling
Chemotherapy
validation set (controls (N = 20), stage I (N = 3), stage II
(N = 3), stage III (N = 3) and stage IVa (N = 19) cases). Sensitivity in this external validation set was 93%, and specificity was 95%; accuracy was 94%, and precision was 96%;
AUROC was 98%.
To evaluate whether the identified CRC profile is significantly derived from the stage IVa subgroup of patients, we
generated a discriminant model for separation of 5 classes:
4 CRC stages and disease free controls,. This analysis included all samples contained in the training and validation
sets (N = 100) (Additional file 3: Fig. S2a). The model
could strongly distinguish all CRC stages from the control
group on the first predictive component (R2Y = 0.46 and
Q2Y = 0.30, p-value <0.00001). On the second component,
stage IVa patients were distinguished from all locoregional
CRC patients. The overlap observed in locoregional CRC
stages could be either due to the similarity of their metabolomic profile (relative to their difference with control or
stage IVa groups; Additional file 1: Table S2), or it may be
secondary to a smaller sample size in each of the three
locoregional classes. In all, the data demonstrate that there
are stage-associated signatures, but there is also a signature that distinguishes CRC patients as a whole from
disease-free controls.
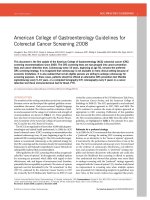
Figure 1b describes the correlation coefficients of the
most important metabolites contributing to the CRC
metabolomic profile. Glutamine was the most important
metabolite in the projection derived from FIA-MS/MS
(decreased in CRC), followed by phosphatidylcholine
acyl –alkyls C38:1 and C40:3 (increased and decreased
in CRC, respectively). In univariate t-test, glutamine was
the most differentially abundant metabolite, as well (pvalue = 2.69e-10). Ornithine and serine had the highest
positive correlations with CRC, while decenoylcarnitine
(C10:1) had the highest negative correlation with CRC
(Fig. 1b). Of 14 amino acids explored, methionine, valine
and tryptophan were significantly reduced in CRC, while
ornithine and serine had increased levels. The remaining
amino acids did not demonstrate any considerable significance in our model. There was no clear association
Farshidfar et al. BMC Cancer (2018) 18:26
Page 5 of 12
b
a
Increased in CRC
c
d
2x10⁻¹⁰
5.8x10⁻⁵
0.006
5.8x10⁻⁵
0.004
e
Decreased in CRC
0.01
f
3x10⁻⁴
3x10⁻³ 2x10⁻⁴
10-4
6x10⁻⁵
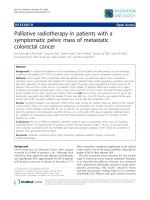
Fig. 1 Metabolomic profile as determined by targeted MS/MS. a Supervised (OPLS-DA) analysis scores scatter plot illustrating that the metabolomic profile
of CRC is distinct from matched controls. b Coefficient column plot for OPLS-DA analysis of CRC vs. matched controls. c Amino acids differentially abundant
in CRC vs. control cases, d Amino acids concentrations as a function of stage of disease. e Lysophosphatidylcholines differentially abundant in CRC serum
samples. f Lysophosphatidylcholine C6:0 (magnified from Figure 1e). Details of concentrations, significance testing p-values, and other characteristics are
described in Additional file 1: Tables S1 and S2
with stage (Fig. 1c and d). Figure 1e and f illustrate the
distribution of changes in the PCs in CRC, based on the
length of carbon chains and the number of unsaturated
bonds. Five lysophosphatidylcholines (Lyso-PC) were
particularly elevated in CRC; none was decreased. This
has not been previously reported. Phosphatidylcholines
are important constituents of cell membranes, as well as
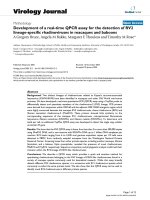
mediators in lipid metabolism. Alterations of the phosphatidyl acyl-alkyl compounds with 38 to 44 carbons in
CRC were also observed. These perturbations are represented as fold changes per carbon content in Fig. 2a and
are discussed later.
To further enhance the capability of this signature biomarker, we evaluated a combinatorial biomarker composed
Farshidfar et al. BMC Cancer (2018) 18:26
Page 6 of 12
Table 2 List of 48 metabolites in targeted MS/MS analysis of colorectal cancer vs. healthy controls. Variable importance in projection
(VIP) and multivariate correlation coefficients are provided (PC: Phosphatidylcholine, Lyso-PC: lysophosphatidylcholine, ae: acyl-alkyl,
aa: diacyl, SM: sphingomyelin)
Abbreviated name
Metabolite
VIP
Centered and scaled coefficient
Gln
Glutamine
1.177
−0.129
PC aa C42:4
Phosphatidylcholine diacyl C42:4
1.168
0.007
lysoPC a C26:1
lysoPhosphatidylcholine acyl C26:1
1.155
0.035
PC ae C40:3
Phosphatidylcholine acly-alkyl C40:3
1.152
0.009
lysoPC a C6:0
lysoPhosphatidylcholine acyl C6:0
1.145
0.044
PC ae C38:1
Phosphatidylcholine acly-alkyl C38:1
1.139
0.035
PC ae C44:3
Phosphatidylcholine acly-alkyl C44:3
1.131
0.024
PC ae C30:2
Phosphatidylcholine acyl-alkyl C 30:2
1.116
−0.015
PC ae C40:4
Phosphatidylcholine acly-alkyl C40:4
1.109
0.009
PC ae C42:1
Phosphatidylcholine acly-alkyl C42:1
1.100
0.029
Ser
Serine
1.097
0.115
PC aa C40:2
Phosphatidylcholine diacyl C40:2
1.095
−0.002
PC aa C40:3
Phosphatidylcholine diacyl C40:3
1.095
0.007
PC ae C40:5
Phosphatidylcholine acly-alkyl C40:5
1.085
0.011
lysoPC a C24:0
lysoPhosphatidylcholine acyl C24:0
1.068
0.042
C18:1
Octadecenoylcarnitine
1.059
0.073
PC ae C38:3
Phosphatidylcholine acly-alkyl C38:3
1.058
−0.009
PC ae C38:2
Phosphatidylcholine acly-alkyl C38:2
1.052
0.004
PC aa C42:2
Phosphatidylcholine diacyl C42:2
1.034
−0.042
PC ae C40:2
Phosphatidylcholine acly-alkyl C40:2
1.033
0.022
C18:2
Octadecadienylcarnitine
1.029
0.114
PC aa C40:1
Phosphatidylcholine diacyl C40:1
0.999
−0.022
PC ae C42:4
Phosphatidylcholine acly-alkyl C42:4
0.998
0.003
PC aa C24:0
Phosphatidylcholine diacyl C24:0
0.987
0.008
Met
Methionine
0.984
−0.028
PC ae C36:1
Phosphatidylcholine acly-alkyl C36:1
0.978
0.002
PC aa C42:5
Phosphatidylcholine diacyl C42:5
0.977
0.011
PC ae C42:2
Phosphatidylcholine acly-alkyl C42:2
0.974
0.004
PC ae C30:1
Phosphatidylcholine acly-alkyl C30:1
0.968
−0.017
C16:1
Hexadecenoyl-L-carnitine
0.962
0.005
PC ae C42:3
Phosphatidylcholine acly-alkyl C42:3
0.957
−0.030
lysoPC a C28:0
lysoPhosphatidylcholine acyl C28:0
0.944
0.033
C3:1
Propenoylcarnitine
0.938
0.031
C16
Hexadecanoylcarnitine
0.927
0.103
PC ae C40:1
Phosphatidylcholine acly-alkyl C40:1
0.922
−0.037
C3-OH
Hydroxypropionylcarnitine
0.913
0.013
lysoPC a C26:0
lysoPhosphatidylcholine acyl C26:0
0.911
0.012
Val
Valine
0.906
−0.063
Orn
Ornithine
0.896
0.201
C16:1-OH
Hydroxyhexadecenoyl-L-carnitine
0.885
0.062
PC aa C26:0
Phosphatidylcholine diacyl C26:0
0.880
0.033
PC ae C42:5
Phosphatidylcholine acly-alkyl C42:5
0.875
−0.001
Farshidfar et al. BMC Cancer (2018) 18:26
Page 7 of 12
Table 2 List of 48 metabolites in targeted MS/MS analysis of colorectal cancer vs. healthy controls. Variable importance in projection
(VIP) and multivariate correlation coefficients are provided (PC: Phosphatidylcholine, Lyso-PC: lysophosphatidylcholine, ae: acyl-alkyl,
aa: diacyl, SM: sphingomyelin) (Continued)
Abbreviated name
Metabolite
VIP
Centered and scaled coefficient
Trp
Tryptophan
0.841
−0.067
PC ae C38:6
Phosphatidylcholine acly-alkyl C38:6
0.837
−0.112
C10:1
Decenoylcarnitine
0.828
−0.137
C3
Propionylcarnitine
0.827
−0.023
PC ae C36:5
Phosphatidylcholine acly-alkyl C36:5
0.780
−0.094
SM C22:3
Sphingomyeline C22:3
0.708
−0.059
of the 41 compound GC-MS driven signature we previously defined [5] and this 48 metabolite FIA-MS/MS signature. The inclusive model had an R2Y score of 0.91 and a
Q2Y score of 0.84 (CV-ANOVA p-value <0.00001). When
we regenerated the model with the most informative metabolites (46 compounds, Table 3), the model had an R2Y
score of 0.89 and a Q2Y score of 0.80 with CV-ANOVA pvalue <0.00001 (Fig. 2b). With permutations consisting of
random assignments of samples to diagnostic classes [12],
permutated models performed poorly. That is, with 10,000
permutations, the Q2Y = −0.11 (compared to 0.84 in our
model); and root mean square error of prediction
(RMSEP) = 0.56 (compared to 0.11 in our model). In all,
the permutated models and our model were significantly
different (P < 0.00001), and our model had a superior performance than models based on random class assignment.
Moreover, in a permutation test consisting of random metabolite combinations in actual diagnostic classes, the Q2intercept was −0.59, which is a reflection of a model with a
high degree of robustness and reliability.
Detection of very early stage disease
Sporadic colorectal adenocarcinoma is preceded by the
formation of adenomatous lesions (polyps) as its precursor. Sera from 31 average-risk adenoma patients and 31
age- and gender- matched healthy controls in the age
a
range of 50 to 70 years old, to evaluate whether metabolomic profiling can also detect this very early stage of the
disease. In all cases, one adenoma <1 cm in diameter was
detected by colonoscopy, except for one case, that had
two adenomas. Clinical factors for these groups are summarized in Table 1.
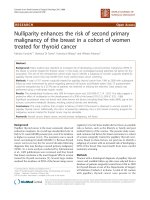
Adenomas and disease-free controls were analyzed on
the FIA-MS/MS platform. An unsupervised multivariate
analysis, using 146 quantitative concentrations revealed no
latent pattern or clustering (8 components, R2X = 0.77)
(Fig. 3a). A supervised analysis (OPLS-DA) with a focused
analysis of 9 metabolites identified by data filtration
(p < 0.30, Table 4 and Additional file 1: Table S3) provided
the basis of a model discriminating adenoma and diseasefree controls (R2Y = 0.30, Q2Y = 0.20, CV-ANOVA pvalue = 0.01, one orthogonal and one predictive
component) (Fig. 3b). The AUROC on internal crossvalidation was 82% (95% CI, 0.72–0.93) (Fig. 3c). Therefore,
the quantitative analysis using this set of 9 metabolites is
comparable to the metabolomic biomarker derived previously by GC-MS, comprised of 17 metabolites [5].
Finally, we sought to determine whether the adenoma
profile identified by the quantitative approach could be
combined with the adenoma profile defined by GC-MS
[5] to enhance the performance of the biomarker. The
combined signature composed of 14 GC-MS metabolites
b
Fig. 2 Combined metabolomic profile of colorectal cancer as determined by GC-MS and MS/MS. a Fold changes of the compounds of phosphatidylcholine acyl-alkyl class, categorized by the cumulative carbon length of side fatty acids, b Supervised (OPLS-DA) scores scatter plot of colorectal cancer and controls
Farshidfar et al. BMC Cancer (2018) 18:26
Page 8 of 12
Table 3 List of 46 metabolites in combined analysis of targeted
MS/MS and GC-MS spectra of colorectal cancer vs. healthy controls.
VIP and multivariate correlation coefficients are provided (PC:
Phosphatidylcholine, Lyso-PC: lysophosphatidylcholine, ae: acyl-alkyl,
aa: diacyl, SM: sphingomyelin)
Table 3 List of 46 metabolites in combined analysis of targeted
MS/MS and GC-MS spectra of colorectal cancer vs. healthy controls.
VIP and multivariate correlation coefficients are provided (PC:
Phosphatidylcholine, Lyso-PC: lysophosphatidylcholine, ae: acyl-alkyl,
aa: diacyl, SM: sphingomyelin) (Continued)
Metabolite
VIP
Centered and
scaled coefficient
Metabolite
VIP
Centered and
scaled coefficient
Serine
0.65
1.81
Phosphatidylcholine acly-alkyl C36:1
0.67
−0.92
Methionine
0.63
1.54
Glutamine
0.75
−0.96
Phosphatidylcholine acly-alkyl C40:3
0.90
1.43
Phosphatidylcholine acly-alkyl C42:3
0.63
−0.97
Phosphatidylcholine acly-alkyl C38:1
0.88
1.27
Tryptophan
0.63
−1.00
Phosphatidylcholine acly-alkyl C44:3
0.80
1.08
Phosphatidylcholine acyl-alkyl C 30:2
0.71
−1.12
Propenoylcarnitine
0.68
1.04
Hexadecenoyl-L-carnitine
0.68
−1.71
Phosphatidylcholine acly-alkyl C40:5
0.74
0.84
Phosphatidylcholine diacyl C24:0
0.76
0.83
lysoPhosphatidylcholine acyl C28:0
0.71
0.71
Hydroxyhexadecenoyl-L-carnitine
0.59
0.66
Hexadecanoylcarnitine
0.63
0.63
Octadecadienylcarnitine
0.67
0.60
Phosphatidylcholine acly-alkyl C40:4
0.83
0.57
Phosphatidylcholine diacyl C40:3
0.80
0.50
Phosphatidylcholine diacyl C40:2
0.83
0.47
Phosphatidylcholine acly-alkyl C38:3
0.82
0.47
lysoPhosphatidylcholine acyl C26:1
0.75
0.36
Phosphatidylcholine diacyl C42:5
0.63
0.33
Phosphatidylcholine acly-alkyl C42:1
0.78
0.30
Phosphatidylcholine diacyl C26:0
0.59
0.26
Phosphatidylcholine diacyl C42:4
0.84
0.21
Phosphatidylcholine acly-alkyl C38:6
0.64
0.15
Phosphatidylcholine acly-alkyl C38:2
0.79
0.15
Ethylene glycol, di-TMS
4.85
0.08
lysoPhosphatidylcholine acyl C6:0
0.64
0.06
Propionylcarnitine
0.61
−0.01
lysoPhosphatidylcholine acyl C26:0
0.68
−0.03
Phosphatidylcholine acly-alkyl C40:2
0.71
−0.05
Octadecenoylcarnitine
0.74
−0.06
Phosphatidylcholine acly-alkyl C42:2
0.66
−0.12
Phosphatidylcholine diacyl C40:1
0.69
−0.30
lysoPhosphatidylcholine acyl C24:0
0.73
−0.34
Phosphatidylcholine acly-alkyl C40:1
0.61
−0.46
Phosphatidylcholine acly-alkyl C42:5
0.60
−0.49
Phosphatidylcholine acly-alkyl C36:5
0.64
−0.56
Hydroxypropionylcarnitine
0.66
−0.62
Phosphatidylcholine acly-alkyl C42:4
0.67
−0.63
Valine
0.61
−0.64
Sphingomyeline C22:3
0.60
−0.80
Phosphatidylcholine diacyl C42:2
0.72
−0.89
and 9 quantitative metabolites could generate a model
which was slightly better than the quantitative signature
alone (R2Y = 0.46, Q2Y = 0.26, CV-ANOVA pvalue = 0.003, Q2-intercept = −0.31). Selecting for the
most important metabolites, we generated a biomarker
pattern consisting of 18 compounds (R2Y = 0.33,
Q2Y = 0.21, CV-ANOVA p-value = 0.01, Q2intercept = −0.26) (Fig. 3d and Table 5). Overall, the
combinatorial signature had a better performance in the
training study.
Discussion
CRC is often diagnosed at later stages when prognosis is
worse and treatment algorithms become more complex
and expensive. Early detection of CRC is, therefore, desirable. Given the high incidence of CRC, substantial efforts
have been made to devise cost-effective screening strategies that can be applied to the general population. Presently, such strategies employ direct examination of the
colon by colonoscopy in an enriched population; the
enriched population is typically identified by symptoms or
by positive fecal occult blood tests. However, fecal tests
are hampered by low compliance as well as low sensitivity.
A blood test may provide a more convenient and acceptable alternative, which may enhance compliance. This
may make it more practicable to perform on a regular
(e.g. yearly) basis, potentially reducing missed diagnoses.
With this in mind, our group has sought to develop a
metabolomics-based blood test that can be used for early
diagnosis of colorectal neoplasia. Previously, we demonstrated the power of this approach using a semiquantitative analytical platform, GC-TOF-MS. Here, we
sought to determine whether a more comprehensive
metabolomic signature could enhance the performance of
the diagnostic biomarker. Indeed, an extension of the metabolite coverage to include additional classes of metabolites does strengthen the performance of the biomarker
pattern. We also sought to explore how a fully quantitative
metabolomic assay might perform if used to identify a
Farshidfar et al. BMC Cancer (2018) 18:26
Page 9 of 12
a
b
c
d
Fig. 3 Metabolomic profile of colorectal adenoma as determined by targeted MS/MS. a PCA comparison of colorectal adenoma and disease-free
controls. b Supervised (OPLS-DA) analysis scores scatter plot of adenomas and controls. c ROC curve from internal cross-validation, d Supervised
(OPLS-DA) analysis scores scatter plot of combined metabolomic profile of adenomas and controls as determined by GC-MS and MS/MS
specific disease state. There was a marked distinction in
the metabolomic profiles of CRC and controls, using this
quantitative approach.
Ultimately, any diagnostic assay must be repeatable
and accurate. Most metabolomics efforts involve the
use of semi-quantitative approaches where individual
metabolites are compared between disease states without specifically quantifying those metabolites. The
measurement variability of mass spectrometry-based
approaches can also be substantial. This can be problematic given that disease-specific perturbations in
individual metabolites may be small. Therefore,
measurement errors may contribute to overlap of distributions, which will affect the accuracy of disease
classification. As we applied a comprehensive quantitative approach, we observed that the measurement variance did not change much. However, the certainty of
the quantitative measurement of individual metabolites
was enhanced because the inclusion of isotope-labelled
standards in the Biocrates kit minimizes the variability
arising from non-biological (analytical) sources. This
directly affected the degree of distinction between disease states, reducing diagnostic overlap. Therefore, it is
clear that, as metabolomic biomarkers are identified
Table 4 List of 9 metabolites in targeted MS/MS analysis of colorectal adenoma vs. healthy controls. VIP and multivariate correlation
coefficients are provided (PC: Phosphatidylcholine, Lyso-PC: lysophosphatidylcholine, ae: acyl-alkyl, aa: diacyl, SM: sphingomyelin)
Abbreviated Name
Metabolite
VIP
Centered and scaled coefficient
Trp
Tryptophan
1.12
0.15
C14:2
Tetradecadienylcarnitine
1.12
−0.09
C12:1
Dodecenoylcarnitine
1.07
−0.07
C16:2
Hexadecadienylcarnitine
1.05
−0.05
C10:1
Decenoylcarnitine
1.01
−0.07
Pro
Proline
0.91
0.20
C14:1-OH
Hydroxytetradecenoylcarnitine
0.91
−0.08
PC ae C40:2
Phosphatidylcholine acly-alkyl C40:2
0.90
0.18
lysoPC a C17:0
lysoPhosphatidylcholine acyl C17:0
0.86
0.16
Farshidfar et al. BMC Cancer (2018) 18:26
Page 10 of 12
Table 5 List of 18 metabolites in combined analysis of targeted
MS/MS and GC-MS spectra of colorectal cancer vs. healthy
controls. VIP and multivariate correlation coefficients are provided
(PC: Phosphatidylcholine, Lyso-PC: lysophosphatidylcholine, ae:
acyl-alkyl, aa: diacyl, SM: sphingomyelin)
Metabolite
VIP
Centered and
scaled coefficient
C14:2 (Tetradecadienyl carnitine)
1.14
0.09
C12:1 (Dodecenoylcarnitine)
1.13
−0.18
Unidentified_compound (RI = 1448.35)
1.11
0.40
Unidentified_compound (RI = 2495.71)
1.11
0.20
Proline
1.11
−0.22
C10:1 (Decenoylcarnitine)
1.10
−0.06
Unidentified_compound (RI = 2378.86)
1.10
0.39
Cystine (4TMS)
1.10
−0.30
C16:2 (Hexadecadienylcarnitine)
1.09
0.07
C14:1-OH (Hydroxytetradecenoylcarnitine)
1.08
−0.24
Glyceric acid (3TMS)
1.05
0.35
Unidentified_compound (RI = 1416.54)
0.98
0.39
Glutamic acid (3TMS)
0.96
−0.19
Unidentified_compound (RI = 2933.74)
0.81
0.26
Unidentified_compound (RI = 1977.64)
0.79
−0.33
lysoPC a C17:0
0.74
0.31
Heptadecanoic acid (1TMS)
0.70
0.20
Unidentified_compound (RI = 1101.40)
0.67
−0.40
and validated, it will be essential to develop assays with
well-selected internal controls as the tests are developed further for clinical practice.
Using FIA-MS/MS, we have significantly broadened
coverage of the metabolome in comparison to our previous studies using GC-TOF-MS and 1H–NMR spectroscopy, which enabled identification of carbohydrates, some
amino acids, and simple fatty acid (FA) structures [4, 5].
The quantitative MS/MS assay used in the present study
included phosphatidylcholines, sphingomyelins, acylcarnitines, and amino acids. When a biomarker pattern was
formulated based on both GC-TOF-MS and FIA-MS/MS,
the diagnostic accuracy improved. We believe that that is
mostly because the specificity was enhanced by the more
comprehensive metabolomic biomarker. It is possible that
the enhanced performance of the combined model was a
function of overfitting. However, as these metabolites were
shortlisted from a larger list of already informative metabolites, and since metabolites from each platform contributed to the combined biomarker, we believe that this is
not a major factor in the encouraging performance of the
combined platform biomarker pattern. As we embark on
further validation studies, there may be continued refinement of the optimal diagnostic biomarkers. In particular,
as we test external validation cohorts, it will be important
to optimize the metabolomic biomarkers diagnostic for
colorectal adenoma and carcinoma.
The identification of diagnostic metabolites on FIA-MS/
MS in addition to the metabolites previously described
from GC-MS studies is quite instructive as we continue development of an assay ready for the clinic. Going forward,
we will create a quantitative assay based on GC-MS/MS,
which will allow us to measure all of the metabolites detected in GC-TOF-MS and FIA-MS/MS. Following this,
the biomarker can be optimized regarding test performance
characteristics, limiting measurement to the most consistently informative compounds. The additional advantage of
using GC-MS/MS is that the extra dimension of fractionation will provide more specific identification of individual
compounds.
There are few studies describing changes in circulating
lipids in CRC [21]. The data generated in this study provide
unique observations that require additional investigation. A
number of PCs are increased in CRC. HDL transfers circulating PCs, and the fact that HDL-C levels are increased in
CRC is consistent with this observation [7]. PCs with 40
carbons are especially increased. The relative accumulation
of PCs with 40 carbons might point to dysregulated mechanisms of fatty acid elongation. Interestingly, it has been
shown that some germline single nucleotide polymorphisms of fatty acid desaturases FADS1 and FADS2 are associated with a higher risk of CRC [22]; and FADS1 and
FADS2 are upregulated in CRC [22]. FADS1 and FADS2
mediate the conversion of linoleic acid (18:2n-6) to arachidonic acid (20:4n-6) [23], a precursor to polyunsaturated
fatty acids with longer than 20 carbons. It is possible that
this increased abundance of fatty acids varying in length
from 22 to 24 carbons, which comprise the components of
PCs containing 40 carbons, is responsible for the particularly high levels of PCs with 40 carbons. There is also a report on a large number of CRC patients found to have low
levels of hydroxylated polyunsaturated ultra-long chain
fatty acid metabolites (PUFAs) [24]. The biological mechanism for this is unknown. However, it is now known that the
levels of PUFAs do not correlate with disease burden, and
it appears that reduction in PUFAs is actually more reflective of risk of CRC [25]. This is important because it will be
essential to evaluate whether any metabolomics-based biomarker of CRC is proportional to disease burden, and
whether it disappears with resection.
LysoPCs, products of PC breakdown, do not change
much in comparison (Table 2). One intriguing observation is that LysoPC C28:0 increases and LysoPC 28:1 decreases; LysoPC 26:1 increases and Lyso 26:0 decreases.
This imbalance suggests that there is some alteration in
the mechanisms involved in fatty acid saturation or
elongation that accompanies CRC. Li et al. have also reported alterations in FTICR-MS measurements of 4
LysoPCs with shorter chains, including poly-unsaturated
Farshidfar et al. BMC Cancer (2018) 18:26
LysoPCs with 16, 18, 20, and 22 carbons along with 11
other compounds, mainly free fatty acids including palmitic amide, oleamide, hexadecanedioic acid, octadecanoic acid, eicosatrienoic acid [26]. Although we did not
observe these LysoPCs to be changed in our cohort, the
acylcarnitines of the fatty acids were significantly altered
(Additional file 1: Table S1).
Given that CRC is associated with a higher cell turnover,
it might be expected that CRC would be associated with
higher levels of PC-diacyls, a normal component of cell
membranes. However, it is unclear why there was an even
more pronounced increase in levels of PC-acyl-alkyls in
CRC, which are not major cell membrane constituents. It
is also not clear which changes in circulating lipid products are secondary to host-derived changes in fat metabolism and nutrition, and which perturbations are secondary
to tumor metabolism. This will require further study.
A number of groups have similarly characterized the
metabolomic features of the colorectal cancer (CRC) using
various analytical platforms ([21, 27–30]). These studies are
very difficult to compare, because of the diversity of the
analytical platforms, differences in compared groups, and
differences in genetic and environmental factors. The
present work is unique in that it involves quantifying circulating lipids in very early disease (adenoma) in addition to
invasive CRC. Admittedly, this was a relatively small sample
size and only the invasive CRC signature was externally validated. Therefore, additional validation will be required. In
addition, it will be imperative to test any signature in diverse clinical cohorts to ensure that any environmental and
genetic factors do not significantly contribute to the diagnostic metabolomic profile.
In summary, we have utilized a quantitative metabolomic assay to determine levels of various circulating metabolites, including lipid metabolites. The biomarker
pattern comprised of metabolites that are most significantly altered clearly distinguishes CRC and adenoma
from normal controls. The fact that adenomas are detectable in blood suggests that a metabolomic test could
be adapted for use as a screening tool. The performance
characteristics of the biomarker profile are quite encouraging, especially when combined with the GC-MS biomarker signature previously described. It will be
important going forward to devise a single assay that allows quantitation of all significant classifier metabolites,
to optimize the diagnostic performance of any future
blood test. It will also be essential to confirm that the
metabolomic signal is distinguished with treatment. In
addition to providing direction on the development of a
diagnostic assay, we have reported unique observations
that will lead to future investigations related to how
tumor and host metabolism are altered in CRC, and
how those separate processes interact. Following up with
this development, we will be testing a population-based
Page 11 of 12
cohort to assess the clinical performance and effectiveness of these metabolomic profiles.
Conclusions
This study denotes promising quantitative metabolomic signatures for the identification of CRC and colorectal adenoma, as well as an extensive description of a number of
perturbations in the metabolism of phosphatidylcholines in
CRC. Future work will involve creation of an assay based on
these signatures, as well as further validation experiments.
Additional files
Additional file 1: Fig. S1. A. Principal Component Analysis (PCA) of
CRC and control samples in the training set. B. PCA of CRC and control
samples in the training set, colored by pre-sampling chemotherapy status. C. PCA of CRC samples from 4 stages, colored by their TNM stages.
D. PCA of CRC samples from 4 stages, colored by pre-sampling chemotherapy status. E. PCA of CRC stage IVa patients, to study the potential
confounding effect of chemotherapy on the described CRC metabolomic
profile. (DOCX 103 kb)
Additional file 2: Fig. S2. Metabolomic profile of CRC, Stages I to IVa
by OPLS-DA supervised analysis. A. Scores scatter plot of discriminant
analysis. Model characteristics are indicated. The first component clearly
distinguishes between CRC and control groups, while the second component identifies locoregional CRC from liver-metastatic CRC (stage IVa).
(PPTX 8816 kb)
Additional file 3: Tables S1. S2 and S3. Lists of metabolites
incorporated into each metabolomic signature for colorectal cancer and
colorectal adenoma (PPTX 2288 kb)
Abbreviations
CR: Colorectal; CRC: Colorectal cancer; CV-ANOVA: Cross validation-analysis of
variance; FA: Fatty acid; FIA: Flow injection analysis; GC-MS: Gas
chromatography-mass spectrometry; GC-ToF-MS: Gas chromatography-time
of flight-mass spectrometry; Lyso-PC: Lyso phosphatidylcholine;
MRM: Multiple reaction monitoring; MS: Mass spectrometry; MS/MS: Tandem
mass spectrometry; NMR: Nuclear magnetic resonance spectroscopy; OPLSDA: Orthogonal partial least scores- discriminant analysis;
PC: Phosphatidylcholine; PCA: Principal component analysis; PLS: Partial least
scores analysis; RMSEP: Root mean square error of prediction
Acknowledgements
We would like to express our gratitude to the Alberta Cancer Foundation
donors and their families. We would also like to thank Nicole Dunse, Katherine
Gratton and Cameron Holder of the University of Calgary HPB/GI Tumor Bank
and Dr. Susanna Town of the Forzani & MacPhail Colon Cancer Screening
Centre (CCSC) Biorepository for their invaluable contributions and support.
Funding
Farshad Farshidfar is the recipient of graduate scholarship from Alberta Cancer
Foundation (ACF). Hans J. Vogel currently holds the Armstrong Chair in Molecular
Cancer Epidemiology Research. Funding bodies have not contributed in the
design of study or collection, analysis, and interpretation of data.
Availability of data and materials
The dataset generated and analyzed for production of this manuscript is
available from the corresponding author on reasonable request.
Authors’ contributions
FF, OFB and HJV conceived the project. FF, OFB, HJV, KK, RH and SEM
performed the experimental design. AM, WDB and OFB provided clinical
samples and aided in clinical interpretation. FF and KK executed data
analysis. VKM aided with the interpretation of lipid profiles and pathway
analysis. FF and OFB wrote the manuscript. All authors have reviewed the
final manuscript.
Farshidfar et al. BMC Cancer (2018) 18:26
Ethics approval and consent to participate
This study was approved by the Conjoint Health Research Ethics Board at
the University of Calgary (Ethics ID number E21805) and conforms to the
Helsinki Declaration (October 2008). All participants provided their informed
consent to participate in this study.
Consent for publication
Not applicable.
Competing interests
FF, KAK, HJV, and OFB are co-inventors of a related colorectal cancer diagnostic
patent. AMW is funded for an unrelated project by Merck. RH is an advisor for
Exact Sciences Inc., and is funded for an unrelated project by Advanced Proteomics
Inc. Other authors have no competing interests.
Publisher’s Note
Springer Nature remains neutral with regard to jurisdictional claims in
published maps and institutional affiliations.
Author details
1
Department of Surgery, University of Calgary, Calgary, AB, Canada.
2
Department of Oncology, University of Calgary, Calgary, AB, Canada.
3
Department Mathematics and Statistics, University of Calgary, Calgary, AB,
Canada. 4Department of Medicine, University of Calgary, Calgary, AB, Canada.
5
Department of Biological Sciences, University of Calgary, Calgary, AB,
Canada. 6Forzani & MacPhail Colon Cancer Screening Centre, Calgary, AB,
Canada. 7Population Health Research, Alberta Health Services, Calgary, AB,
Canada. 8Department of Agricultural, Food and Nutritional Science, University
of Alberta, Edmonton, Canada. 9Division of Surgical Oncology, Tom Baker
Cancer Centre, 1331 – 29th St NW, Calgary, AB T2N 4N2, Canada.
Received: 20 September 2016 Accepted: 14 December 2017
References
1. Levin B, Lieberman DA, McFarland B, Smith RA, Brooks D, Andrews KS, Dash
C, Giardiello FM, Glick S, Levin TR, et al. Screening and surveillance for the
early detection of colorectal cancer and adenomatous polyps, 2008: a joint
guideline from the American Cancer Society, the US multi-society task force
on colorectal cancer, and the American College of Radiology. CA Cancer J
Clin. 2011;58(3):130.
2. Tominaga T, Sakabe T, Koyama Y, Hamano K, Yasutomi M, Takahashi T,
Kodaira S, Kato T, Ogawa N. Prognostic factors for patients with colon or
rectal carcinoma treated with resection only. Five-year follow-up report.
Cancer. 1996;78(3):403–8.
3. Wolmark N, Fisher B, Wieand HS. The prognostic value of the modifications
of the Dukes' C class of colorectal cancer. An analysis of the NSABP clinical
trials. Ann Surg. 1986;203(2):115–22.
4. Farshidfar F, Weljie AM, Kopciuk K, Buie WD, Maclean A, Dixon E, Sutherland FR,
Molckovsky A, Vogel HJ, Bathe OF. Serum metabolomic profile as a means to
distinguish stage of colorectal cancer. Genome medicine. 2012;4(5):42.
5. Farshidfar F, Weljie AM, Kopciuk KA, Hilsden R, McGregor SE, Buie WD,
MacLean A, Vogel HJ, Bathe OF. A validated metabolomic signature for
colorectal cancer: exploration of the clinical value of metabolomics. Br J
Cancer. 2016;
6. van Duijnhoven FJ, Bueno-De-Mesquita HB, Calligaro M, Jenab M,
Pischon T, Jansen EH, Frohlich J, Ayyobi A, Overvad K, Toft-Petersen AP:
Blood lipid and lipoprotein concentrations and colorectal cancer risk in
the European prospective investigation into cancer and nutrition. Gut
2011:gut. 2010.225011.
7. Aleksandrova K, Jenab M, Bueno-de-Mesquita HB, Fedirko V, Kaaks R,
Lukanova A, Duijnhoven FJB, Jansen E, Rinaldi S, Romieu I, et al. Biomarker
patterns of inflammatory and metabolic pathways are associated with risk
of colorectal cancer: results from the European prospective investigation
into cancer and nutrition (EPIC). Eur J Epidemiol. 2014;29(4):261–75.
8. Hollander M, Wolfe DA. Nonparametric statistical methods. 2nd ed. New
York: Wiley; 1999.
9. Saeed AI, Sharov V, White J, Li J, Liang W, Bhagabati N, Braisted J, Klapa M,
Currier T, Thiagarajan M, et al. TM4: a free, open-source system for
microarray data management and analysis. BioTechniques. 2003;34(2):374–8.
Page 12 of 12
10. Römisch-Margl W, Prehn C, Bogumil R, Röhring C, Suhre K, Adamski J.
Procedure for tissue sample preparation and metabolite extraction for highthroughput targeted metabolomics. Metabolomics. 2012;8(1):133–42.
11. F. D. A. CfDEaRC, Center for Veterinary Medicine (CVM),: guidance for
industry. Bioanalytical Method Validation. In. Edited by Services USDoHaH;
2001.
12. Westerhuis JA, Hoefsloot HCJ, Smit S, Vis DJ, Smilde AK, van Velzen EJJ, van
Duijnhoven JPM, van Dorsten FA. Assessment of PLSDA cross validation.
Metabolomics. 2008;4(1):81–9.
13. Booth SC, Workentine ML, Weljie AM, Turner RJ. Metabolomics and its
application to studying metal toxicity. Metallomics. 2011;3(11):1142–52
14. Shabalin AA, Tjelmeland H, Fan C, Perou CM, Nobel AB. Merging two geneexpression studies via cross-platform normalization. Bioinformatics. 2008;
24(9):1154–60.
15. McConnell YJ, Farshidfar F, Weljie AM, Kopciuk KA, Dixon E, Ball CG,
Sutherland FR, Vogel HJ, Bathe OF. Distinguishing benign from malignant
pancreatic and Periampullary lesions using combined use of (1)H-NMR
spectroscopy and gas chromatography-mass spectrometry. Meta. 2017;7(1).
PMID: 28098776.
16. Eriksson L, Toft M, Johansson E, Wold S, Trygg J. Separating Y-predictive and Yorthogonal variation in multi-block spectral data. J Chemom. 2006;20(8–10):352–61.
17. Weljie AM, Dowlatabadi R, Miller BJ, Vogel HJ, Jirik FR. An inflammatory
arthritis-associated metabolite biomarker pattern revealed by 1H NMR
spectroscopy. J Proteome Res. 2007;6(9):3456–64.
18. Fiehn O, Garvey WT, Newman JW, Lok KH, Hoppel CL, Adams SH. Plasma
metabolomic profiles reflective of glucose homeostasis in non-diabetic and
type 2 diabetic obese African-American women. PLoS One. 2010;5(12):e15234.
19. Egdington ES. Randomization tests. New York: Marcel Dekker Inc; 1987.
20. User guide to SIMCA, Version 14.
21. Tan B, Qiu Y, Zou X, Chen T, Xie G, Cheng Y, Dong T, Zhao L, Feng B, Hu X,
et al. Metabonomics identifies serum metabolite markers of colorectal
cancer. J Proteome Res. 2013;12(6):3000–9.
22. Zhang B, Jia WH, Matsuda K, Kweon SS, Matsuo K, Xiang YB, Shin A, Jee SH,
Kim DH, Cai Q, et al. Large-scale genetic study in east Asians identifies six new
loci associated with colorectal cancer risk. Nat Genet. 2014;46(6):533–42.
23. Kothapalli KSD, Ye K, Gadgil MS, Carlson SE, O’Brien KO, Zhang JY, Park HG,
Ojukwu K, Zou J, Hyon SS, et al. Positive selection on a regulatory insertiondeletion polymorphism in FADS2 influences apparent endogenous
synthesis of arachidonic acid. Mol Biol Evol. 2016;33(7):1726–1739.
24. Ritchie SA, Ahiahonu PW, Jayasinghe D, Heath D, Liu J, Lu Y, Jin W, Kavianpour
A, Yamazaki Y, Khan AM. Reduced levels of hydroxylated, polyunsaturated ultra
long-chain fatty acids in the serum of colorectal cancer patients: implications
for early screening and detection. BMC Med. 2010;8(1):13.
25. Ritchie SA, Heath D, Yamazaki Y, Grimmalt B, Kavianpour A, Krenitsky K,
Elshoni H, Takemasa I, Miyake M, Sekimoto M. Reduction of novel circulating
long-chain fatty acids in colorectal cancer patients is independent of tumor
burden and correlates with age. BMC Gastroenterol. 2010;10(1):140.
26. Li F, Qin X, Chen H, Qiu L, Guo Y, Liu H, Chen G, Song G, Wang X, Li F, et al. Lipid
profiling for early diagnosis and progression of colorectal cancer using directinfusion electrospray ionization Fourier transform ion cyclotron resonance mass
spectrometry. Rapid Commun Mass Spectrom. 2013;27(1):24–34.
27. Qiu Y, Cai G, Su M, Chen T, Zheng X, Xu Y, Ni Y, Zhao A, Xu LX, Cai S, et al.
Serum metabolite profiling of human colorectal cancer using GC-TOFMS
and UPLC-QTOFMS. J Proteome Res. 2009;8(10):4844.
28. Nishiumi S, Kobayashi T, Ikeda A, Yoshie T, Kibi M, Izumi Y, Okuno T, Hayashi
N, Kawano S, Takenawa T, et al. A novel serum Metabolomics-based
diagnostic approach for colorectal cancer. PLoS One. 2012;7(7):e40459.
29. Leichtle AB, Nuoffer JM, Ceglarek U, Kase J, Conrad T, Witzigmann H, Thiery
J, Fiedler GM. Serum amino acid profiles and their alterations in colorectal
cancer. Metabolomics. 2012;8(4):643–53.
30. Zhu J, Djukovic D, Deng L, Gu H, Himmati F, Chiorean EG, Raftery D.
Colorectal cancer detection using targeted serum metabolic profiling. J
Proteome Res. 2014;13(9):4120–30.