Whole blood microRNAs as potential biomarkers in post-operative early breast cancer patients
Bạn đang xem bản rút gọn của tài liệu. Xem và tải ngay bản đầy đủ của tài liệu tại đây (1.15 MB, 12 trang )
Alunni-Fabbroni et al. BMC Cancer (2018) 18:141
DOI 10.1186/s12885-018-4020-7
RESEARCH ARTICLE
Open Access
Whole blood microRNAs as potential
biomarkers in post-operative early breast
cancer patients
Marianna Alunni-Fabbroni1,8* , Leonie Majunke1, Elisabeth K. Trapp1,9, Marie Tzschaschel1,9, Sven Mahner1,
Peter A. Fasching2, Tanja Fehm3, Andreas Schneeweiss4, Thomas Beck5, Ralf Lorenz6, Thomas W. P. Friedl7,
Wolfgang Janni7, Brigitte Rack1,7 and on behalf of the SUCCESS Study Group
Abstract
Background: microRNAs (miRNAs) are considered promising cancer biomarkers, showing high reliability, sensitivity
and stability. Our study aimed to identify associations between whole blood miRNA profiles, presence of circulating
tumor cells (CTCs) and clinical outcome in post-operative early breast cancer patients (EBC) to assess the utility of
miRNAs as prognostic markers in this setting.
Method: A total of 48 post-operative patients, recruited in frame of the SUCCESS A trial, were included in this
retrospective study and tested with a panel of 8 miRNAs (miR-10b, −19a, − 21, − 22, −20a, − 127, − 155, −200b).
Additional 17 female healthy donors with no previous history of cancer were included in the study as negative
controls. Blood samples were collected at different time points (pre-adjuvant therapy, post-adjuvant therapy,
2 years follow up), total RNA was extracted and the relative concentration of each miRNA was measured by
quantitative PCR and compared in patients stratified on blood collection time or CTC detection. Furthermore,
we compared miRNA profiles of patients, for each time point separately, and healthy donors. CTCs were visualized
and quantified with immunocytochemistry analysis. Data were analyzed using non-parametric statistical tests.
Results: In our experimental system, miR-19a, miR-22 and miR-127 showed the most promising results, differentiating
patients at different time points and from healthy controls, while miR-20a, miR-21 and miR-200b did not show any
difference among the different groups. miR-10b and miR-155 were never detectable in our experimental system. With
respect to patients’ clinical characteristics, we found a significant correlation between miR-200b and lymph node status
and between miR-20a and tumor type. Furthermore, miR-127 correlated with the presence of CTCs. Finally, we found a
borderline significance between Progression Free Survival and miR-19a levels.
Conclusions: This pilot study suggests that profiling whole blood miRNAs could help to better stratify post-operative EBC
patients without any sign of metastasis to prevent later relapse or metastatic events.
Keywords: Early breast cancer, microRNA, Tumor marker, Circulating tumor cell, Immune system
* Correspondence:
1
Department of Gynecology and Obstetrics, University Hospital, LMU Munich,
Munich, Germany
8
Laboratory for Experimental Radiology, Institute for Clinical Radiology,
Ludwig-Maximilians-University Hospital, Marchioninistr. 15, 81377 Munich,
Germany
Full list of author information is available at the end of the article
© The Author(s). 2018 Open Access This article is distributed under the terms of the Creative Commons Attribution 4.0
International License ( which permits unrestricted use, distribution, and
reproduction in any medium, provided you give appropriate credit to the original author(s) and the source, provide a link to
the Creative Commons license, and indicate if changes were made. The Creative Commons Public Domain Dedication waiver
( applies to the data made available in this article, unless otherwise stated.
Alunni-Fabbroni et al. BMC Cancer (2018) 18:141
Background
The impressive progress and success rate of treatment
protocols and the enormous efforts made to improve
prognosis of breast cancer (BC) have increased the 5-yearsurvival rate in the USA to over 90% [1]. However a number
of patients finally succumb to the disease, due to the strong
tendency of primary BC to spread with induction of
incurable metastasis [2–6]. Detection of BC is mostly based
on imaging [7, 8], but whilst this method can help to
distinguish between benign and malignant lesions, it
cannot provide any information about the presence of
simultaneous hidden metastasis or the risk of relapse. In
recent years, liquid biopsy has raised a lot of interest as a
powerful method for cancer screening and monitoring. In
particular, circulating tumor cells (CTCs) and cell-free
nucleic acids such as microRNA (miRNA) have
demonstrated independent prognostic and predictive
relevance [9–13].
miRNAs are short non-coding single strand RNA
sequences, ~ 21-25 nucleotides long, detectable in body
fluids, cells and tissues [14]. By binding to the 3′
untranslated region of messenger RNAs, miRNAs can
direct post-transcriptional repression, thereby fulfilling
an important regulatory role in gene expression [14]. In
recent years, miRNAs have been proposed as potential
biomarkers for diagnosis, classification and treatment of
different types of cancer, including BC [12, 15, 16]. Until
now, most studies have focused on detection of miRNAs
in body fluids such as serum and plasma, but recently
whole blood miRNAs have also become attractive
biomarkers in cancer pathogenesis, mainly in view of
their possible role as immune system regulators [17–19].
miRNA are actively released in blood by cell secretion or
passively as a consequence of cell lysis or apoptosis [20,
21] Several miRNAs are known to be involved in the
development, maturation, differentiation and function of
peripheral blood mononucleated cells (PBMC) including
T and B lymphocytes and natural killer cells, as well as
in antibody production and in inflammatory mediator
release [22–24]. It has been shown that PBMCs go
through several molecular changes already at the very
early phases of neoplastic lesions [19] and a role of
miRNAs in their differential expression has already been
established [25]. Notably, immune system activation is
not dependent on cancer burden. All of this suggests
that the characterisation of whole blood miRNAs may
be useful in the detection of primary malignancy or
metastasis even in the early stages of their development
[26, 27]. Therefore, the use of miRNAs as diagnostic
tools for early detection of primary tumors or metastasis
could be relevant in post-operative breast cancer
patients to ensure timely treatment.
The aim of our study was to investigate alterations in
whole blood miRNA levels in post-operative early BC (EBC)
Page 2 of 12
patients before and after therapy and at 2 years follow up, to
evaluate their possible role as a novel class of biomarkers to
better monitor patients with no sign of relapse or metastasis
after surgery. We screened peripheral blood samples
obtained from patients with no sign of metastasis at time of
collection to measure the levels of 5 oncogenic (miR-10b,
−19a, − 21, − 22, − 155) and 3 tumor suppressor (miR-20a,
− 127 and -200b) miRNAs. These miRNAs have already
been linked to carcinogenesis displaying multifunctional
roles such as strong activators of proliferation, growth and
invasion (miR-19a and miR-21) [20, 28], being involved in
the induction of the epithelial-mesenchymal transition
(EMT) and metastasis (miR-10b and miR-22) [29, 30], or on
the contrary as inhibitors of cellular proliferation (miR-20a,
miR-127 and miR-200b) [31–34]. Moreover, some of the
miRNAs included in the panel (miR-19a, − 21, − 127 and
155) have been shown to be regulators of both innate and
adaptive immune response [20, 31, 35, 36]. In this respect,
the analysis of these miRNAs could offer the possibility to
indirectly predict the development of metastasis as a
consequence of a failure in the immune system reaction.
The plausibility of using miRNAs as early surrogate markers
for CTC detection was also evaluated as well as their
possible role as predictors for clinical outcome.
Methods
Ethic statement
The patients’ cohort represented a subsample of the
German multicenter open label phase III SUCCESS-A
trial (NCT02181101) [9]. The study was approved by all
the involved ethical boards and conducted in accordance
with the Declaration of Helsinki [37]. All patients and
healthy donors (HDs) provided written informed consent.
Patients’ characteristics
A total of 48 EBC patients were included in this
retrospective analysis [9]. All patients (mean age, years
± SD: 58.5 ± 11.0, range: 36-75) had histologically
confirmed high risk BC (stages pT1-T4, pN0-N3, M0)
according to standard clinical guidelines and underwent
primary breast surgery. Blood samples were collected
post-operative from EBC patients at three different
time points: T0 (before chemotherapy, median number
of days after surgery: 23); T1 (after chemotherapy,
median numbers of days after surgery: 173); T2 (at 2
years follow up, median number of days after surgery:
not available). Tumor classification was done according
to the TNM guidelines [38]. Luminal cancer type A was
defined as estrogen and/or progesterone receptor
positive (ER+/PR+), human epidermal growth factor
receptor-2 negative (HER2−) and grading (G) 1-2;
luminal cancer type B was defined as ER+/PR+, HER2
positive or negative and G3; basal-like tumor was
Alunni-Fabbroni et al. BMC Cancer (2018) 18:141
Page 3 of 12
defined as ER−/PR− and HER2− (triple negative, TN);
HER2-like tumor was defined as HER2 positive
(HER2+). Patients’ clinical and histo-pathological
details are summarized in Table 1. Additionally, 17
female HDs (mean age, years ± SD: 51 ± 9.7, range:
34-63) with no previous history of cancer were included in the study as negative controls.
MicroRNA panel
In this exploratory study, we analyzed 8 miRNAs with
oncogenic or tumor suppressive characteristics. The
main properties (effects, targets and associated biological
Table 1 Patients’ and primary tumor’s characteristics
48a
Total
Mean age, years (SD)
58.5 (±11.0)
Range
36-75
Tumor size
pT1a-c
14 (29.2%)
pT2-4
34 (70.8%)
Lymph node status
Node negative
12 (25.0%)
Node positive (pN1-3)
35 (72.9%)
pNx
1 (2.1%)
Grading
G1-2
27 (56.2%)
G3
21 (43.8%)
Estrogen receptor status b
ER positive
30 (62.5%)
ER negative
18 (37.5%)
Progesterone receptor statusc
PR positive
25 (52.1%)
PR negative
23 (47.9%)
HER2 status
negative
36 (75.0%)
positive
11 (22.9%)
unknown
1 (2.1%)
Menopausal status
Premenopausal
15 (31.3%)
Postmenopausal
33 (68.7%)
Primary operation
Breast conservative
30 (62.5%)
Mastectomy
18 (37.5%)
Systemic therapy
Chemotherapy-FECd-DOCe
21 (43.8%)
f
Chemotherapy-FEC-DOC Gem
27 (56.2%)
Number of patients (percentage); bER estrogen receptor; cPR progesterone
receptor; dFEC fluorouracil-epirubicin-cyclophosphamide; eDOC docetaxel;
f
Gem gemcitabine
a
events) are summarized in Table 2. miRNAs were
included in the panel on the basis of their relevance to
breast cancer, induction of metastasis and association to
immune system as reported in literature (Table 2).
Isolation of total RNA
Peripheral blood (3 mL) from patients and HDs was drawn
directly in Tempus Blood RNA Tubes (ThermoFischer
Scientific, Germany) to stabilize and isolate total RNA.
After overnight shipment at room temperature, samples
were frozen and stored at − 80 °C. Total RNA was isolated
using the MagMAX™ for Stabilized Blood Tubes RNA
Isolation Kit (ThermoFischer Scientific) according to the
manufacturer’s instructions. In brief, frozen samples were
thaw on ice for 30 min, centrifuged at 4500 g for 10 min at
4 °C, pellets were then treated with Tempus Proteinase and
TURBO DNase and finally RNA purification was
performed using RNA binding beads and a magnet stand.
After removing the supernatant and washing twice with the
provided washing buffer, beads were left drying at room
temperature and total RNA was finally eluted in 40 μL
elution buffer. The protocol allowed the recovery of
approximately 3-25 μg total RNA. Quality of RNA was
checked by 2% agarose gel electrophoresis (SYBR Safe
E-Gel 2%, ThermoFischer Scientific) and RNA yield
was determined spectrophotometrically (NanoDrop,
Implen, Germany).
miRNA analysis
Starting from total RNA, miRNAs were reverse-transcribed
using the TaqMan MicroRNA Reverse Transcription Kit
(ThermoFischer Scientific) and quantified using the TaqMan
MicroRNA assay. Hydrolysis probes used in the study were
purchased from ThermoFischer Scientific (hsa-miR-10b-3p
002315; hsa-miR-19a-3p 000395; hsa-miR-20a-3p 002437;
hsa-miR-21-3p 002438; hsa-miR-22-3p 00398; hsa-miR-1273p 000452; hsa-miR-155-3p 002287; hsa-miR-192-3p
002272; hsa-miR-200b-3p 002251). For each microRNA,
5 μL of total RNA (2 ng/μL) were mixed with 7 μL of RT
reaction mix consisting of 0.15 μL 100 mM dNTPs (with
dTTP), 1.00 μL MultiScribe Reverse Transcriptase (50 U/
μL), 1.50 μL 10X Reverse Transcription Buffer, 0.19 μL
RNase Inhibitor (20 U/μL) and 4.16 μL nuclease-free water.
Specific microRNA RT primers (3 μL) were added to each
reaction to a final volume of 15 μL. After incubation on ice
for 5 min, reverse transcription (RT) was performed at
16 °C for 30 min, 42 °C for 30 min, 85 °C for 5 min
(Mastercycler, Eppendorf, Germany). Quantitative reverse
transcription-polymerase chain reaction (RT-qPCR) was
performed immediately after RT; alternatively, cDNAs
were stored at − 20 °C. In the negative controls, all
specific RT primers were substituted with RNase/
DNase-free water. RT-qPCR was run in a final volume
of 20 μL reaction mix containing 1 μL 20X TaqMan
Alunni-Fabbroni et al. BMC Cancer (2018) 18:141
Page 4 of 12
Table 2 Oncogenic or tumor suppressor miRNAs analysed in the study: effect, targets and associated events
MicroRNA
(family)
Effect
Identified target
Associated event
Reference
miR-10b
Oncogenic
HOXD10
Metastasis induction
[58]
miR-19a
Oncogenic
PTEN
Cell proliferation, Th1 immune response (innate immunity)
[20, 22, 59–61]
miR-20a
Tumor suppressor
E2F
Proliferation repression
[33]
miR-21
Oncogenic
TPM1, PDCD4,
TIMP3, PTEN
Cell proliferation, migration, EMT, apoptosis inhibition,
Treg cell activation
[20, 62–64]
miR-22
Oncogenic
miR-200,
ERa, TET
Cell proliferation, EMT
[30, 65]
miR-127
Tumor suppressor
BCL-6
Proliferation, senescence, chemo- and radio-resistance,
B cell activation
[31, 32]
miR-155
Oncogenic
STAT-3
Inflammation, B cell activation (innate/adaptive immunity)
[24, 36]
miR-200b
Tumor suppressor
E-cadherin, ZEB1, ZEB2
EMT, tumor growth, metastasis
[66, 67]
Small RNA Assay, 10 μL 2X TaqMan Universal PCR
Master Mix II no UNG (ThermoFischer Scientific),
7.67 μL nuclease-free water and 1.33 μL cDNA. All
samples were run in triplicates; for each assay, no template
controls were included to each plate. The plate was loaded
into the 7500 Fast Real-Time PCR system (ThermoFischer
Scientific) using the amplification standard mode (50 °C for
2 min, 95 °C for 10 min and 40 cycles at 95 °C for 15 s and
60 °C for 60 s). Relative expression of miRNAs was obtained
using the eq. 2-ΔCq, where ΔCq = (Cq targeted miRNA) (Cq reference miRNA) (Cq: quantification cycle) [39]. Each
primer was tested separately to define the PCR amplification
efficiency by means of calibration curves. Correlation
coefficient (R2) and PCR efficiency calculated from slope
were all between 0.97-0.99 and 82%-114%, respectively
(Additional file 1: Table S1). miR-192 was used as reference
miRNA to normalize the relative levels of the other
miRNAs, as previously described [20]. miR-192 Cq mean
values did not show any significant difference (always
p > 0.05) in paired or unpaired groups analyzed with
the Wilcoxon or the Kruskal-Wallis test, respectively.
Furthermore, intra- and inter- group variation
measured with the statistical algorithm Normfinder
confirmed that miR-192 was stably expressed [40].
Since samples were collected in Tempus tubes which
allow only a minimal variation in RNA extraction
efficiency, no spike-in exogenous control was included.
CTC isolation
Whole blood (23 mL) was collected in BD Vacutainer
EDTA tubes (Becton Dickinsons, Germany) or CellSave
tubes (Janssen Diagnostic, Raritan NJ, USA) and peripheral
blood mononuclear cells (PBMCs) were isolated by density
gradient (OncoQuick, Greiner BioOne, Germany). All
mononuclear cells were collected from the interphase layer,
washed two times in phosphate buffer saline (PBS) and finally spun down at 150 g for 5 min at room temperature
(RT) on a SuperFrost® Plus glass slide (ThermoFischer
Scientific). Cytospins were dried for 12-24 h at RT and then
stained or stored at − 80 °C.
CTC immune-detection and quantification
To detect CTCs, 2 cytospins per patient were stained
with the pan-anti-cytokeratin monoclonal mouse A45B/B3 antibody (dilution 1:100) (Micromet AG,
Germany), which is directed against cytokeratin (CK)
heterodimers 8/18 and 8/19 detectable in epithelial
cells but not in white blood cells [41, 42]. CK is generally considered a valid tumor marker as shown by single
cell genomic analysis of CK positive cells isolated by
bone marrow of BC patients [29]. Antibody’s quality
and specificity were controlled using the cytokeratin
positive human breast adenocarcinoma cell line MCF-7
(ATCC® HTB-22™). The primary antibody was labelled
using the DAKO alkaline phosphatase-anti-alkaline
phosphatase (APAAP) detection system, with the
Z0259 antibody combined with new fuchsin staining as
secondary antibody (DakoCytomation, Denmark). The
human breast cancer cell line BT-20A (ATCC® HTB19™) was used as positive control (data not shown). The
murine antibody clone MOPC21 (Sigma-Aldrich
Chemie GmbH, Germany) was used as IgG1 kappa
isotype negative control to test the antibody reaction
specificity (data not shown). After staining, slides were
screened by two independent investigators under a
standard bright field Axiophot microscope (Carl Zeiss,
Germany) equipped with a 40 fold magnification
objective. Few samples were not analyzable (n.a.) due to
technical failures. Patients were classified as CTC
positive when at least one CTC was detected. Only
immunocytochemically positive cells with a moderate to
strong signal intensity and no hematopoietic characteristics
were defined as CTCs.
Alunni-Fabbroni et al. BMC Cancer (2018) 18:141
Statistical analysis
GraphPad Prism version 6.00 for Windows (GraphPad
Software, La Jolla CA, USA) was used for running the
statistical analysis. The non-parametric Mann-Whitney U
test was used to compare miRNA levels between different
patient groups (the Kruskal-Wallis test was used in case of
more than two groups) and the Wilcoxon matched-pairs
signed rank test was used to compare miRNA levels
obtained from the same patients at different time points.
Receiving Operator Characteristics (ROC) curves gave the
diagnostic power of whole blood miRNA levels; areas under
the curves (AUC) were calculated for each case and were
considered excellent between 0.9 and 1.0, good between 0.8
and 0.9, fair between 0.7 and 0.8, poor between 0.6 and 0.7
and failed between 0.5 and 0.6. Overall survival (OS) and
progression free survival (PFS) were analyzed using the
Kaplan-Meier method and survival estimates in different
groups were compared using the log-rank test. For survival
analysis, high and low miRNA levels were defined as being
above or below the mean values of each miRNA in HD plus
1 standard deviation (SD). Two-sided p-values below 0.05
were considered statistically significant and no adjustment
of the significance level for multiple testing was performed.
Results
Comparison of miRNA levels between EBC patients and
healthy donors
The relative amounts of the 5 oncogenic (miR-10a, −19a,
− 21, − 22, − 155) and the 3 tumor suppressor (miR-20a, −
127 and -200b) miRNAs were measured in patients’ whole
blood drawn before adjuvant therapy (T0, n = 47), after
adjuvant therapy (T1, n = 14) and at 2 years follow up (T2,
n = 17), and compared, for each time point separately, to
those found in healthy donors (HDs) (n = 17). miR-10b
and miR-155 were never detectable in any of the samples
analyzed, including those withdrawn from healthy donors,
although preliminary tests run in cell lines indicated an
adequate amplification efficiency. The level of these
miRNAs was most probably below the detection limit;
further work will be necessary in order to confirm this
hypothesis. Results are therefore reported for the six
remaining miRNAs only.
Compared to HDs, patients showed higher levels of
miR-19a at T0 (median 7.70 vs. 5.36, p = 0.004) and T1
(median 8.74 vs. 5.36, p < 0.0001), lower levels of miR-21
at T0 (median 0.57 vs. 0.91, p = 0.001) and T1 (median
0.49 vs. 0.91, p = 0.004), and higher levels of miR-22 at T1
(median 17.54 vs. 11.72, p = 0.012) and at T2 (median
19.20 vs 11.72, p = 0.034) (Fig. 1a). Among the tumor
suppressors, only miR-127 was significantly downregulated at T2 (median 5.61 vs 3.78, p = 0,028; Fig. 1b).
No other significant difference between patients and HDs
was observed. ROC curve analysis confirmed that miR19a (T0, AUC = 0.732, p = 0.004; T1, AUC = 0.8908,
Page 5 of 12
p = 0.0002), miR-21 (T0, AUC = 0.7572, p = 0.001; T1,
AUC = 0.7983, p = 0.004), miR-22 (T1, AUC = 0.7647,
p = 0.012; T2, AUC = 0.7128, p = 0.034) and miR-127
(T2, AUC = 0.7197, p = 0.028) could differentiate
patients from HDs at the different time points.
Comparison of miRNA levels in the same EBC patients at
different time points
miRNA levels were measured and compared within patients
according to the time of the blood collection. We found no
significant difference in the miRNA levels measured in each
patient before (T0) and after (T1) chemotherapy. The only
exception was given by the oncogenic miR-22, which
showed a significant upregulation at T1 (n = 14; p = 0.028)
(Fig. 2). A pairwise miRNA comparison in the same
patients at T0 and T2 (2 years follow up) revealed a
significant downregulation of the tumor suppressor
miR-127 (n = 14; p = 0.041), while the tumor suppressor
miR-200b showed a minimal however significant
increase (n = 14; p = 0.049) (Fig. 3). Pairwise comparisons
between miRNA levels obtained at T1 and T2 did not show
any significant difference among miRNA levels (data not
shown). ROC curve analysis confirmed that miR-22 (AUC
= 0.79, p = 0.002), miR-127 (AUC = 0.98, p < 0.0001) and
miR-200b (AUC = 0.69, p = 0.01) could differentiate the
same patients at the different time points.
Association of miRNA levels with tumor characteristics
and tumor subtypes at baseline
The median level of each miRNA assessed at T0 was also
compared between patients’ sub-groups with different
tumor sizes (pT1 vs. pT2-3), nodal involvement (pN0 vs
pN1-3) and grading (G1-2 vs G3) (Table 3). The tumor
suppressor miR-200b showed a significant downregulation
(median 0.73 vs 0.47, p = 0.003) in pN1-3 patients (positive
for lymph node metastasis) (n = 35) as compared to pN0
patients (negative for lymph node metastasis) (n = 12),
while all the other miRNAs could not differentiate the
patients according to the histopathological characteristics.
A comparison between cancer subtypes (luminal cancer
type A, luminal cancer type B, basal like and HER2-like)
and the corresponding hormonal status with the relative
levels of each miRNA at the three time points T0, T1 and
T2 was also performed (Fig. 4). No significant differences
were found with the only exception of miR-20a at T1
(panel B): higher levels were measured in patients
with luminal cancer type A (n = 4) with respect to
patients with luminal cancer type B (n = 4) (median
0.60 vs 0.22, p = 0.028, AUC = 1, p = 0.020) (panel D).
The results were nevertheless obtained with an
extreme small patient number therefore they should
be considered with caution; further experiments with
a larger cohort of patients will be performed to validate these preliminary data.
Alunni-Fabbroni et al. BMC Cancer (2018) 18:141
Page 6 of 12
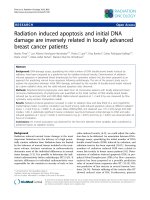
a
b
Fig. 1 Whole blood miRNA levels in patients at T0, T1 and T2. The dot plots show the relative levels of oncogenic miR-19a, − 21 and − 22 (a), and
tumor suppressor miR-20a, − 127 and -200b (b). Comparisons were performed (for each time point separately) using the Mann-Whitney U test
and the corresponding p-values of significant differences are indicated in the graphs (*p ≤ 0.05; **p ≤ 0.01; ***p ≤ 0.001; ****p ≤ 0.0001). (HD: healthy
donor; T0: before adjuvant therapy; T1: after adjuvant therapy; T2: at 2 years follow up)
Comparison of miRNA levels at baseline in CTC-positive
and CTC-negative EBC patients
Pre-chemotherapy miRNA levels were compared between
patients found CTC positive (n = 11) or CTC negative
(n = 36) according to the immune-cytochemical analysis.
Patients were classified as CTC positive when at least one
cytokeratin positive cell was detected (Fig. 5a). CTC
positive patients could be differentiated from CTC
negative patients by the tumor suppressor miR-127, which
showed a slight but nevertheless significant higher level in
CTC positive patients (median 8.77 vs 6.10, p = 0.0424)
(Fig. 5b). ROC curve analysis confirmed these findings
(AUC = 0.70, p = 0.043). None of the other miRNAs could
differentiate CTC positive from CTC negative patients.
Association between miRNA levels at baseline and clinical
outcome
miRNAs released in circulation in the early phases of tumor
development originate from the primary tumor as well as
from the cellular component of the immune system [43].
We hypothesized that miRNAs could predict the possible
development of metastasis at later time points, possibly
mirroring the immunological reaction to the primary
tumor. Therefore, in order to unravel a miRNA prognostic
relevance in metastasis development already in EBC
patients with no sign of metastasis, we compared the
miRNA levels at T0 of those patients who did not develop
metastasis (M0, n = 38) with those who did develop
metastasis during the follow up period (M1, n = 9). We
could detect a higher median level of miR-19a in M0
compared to M1 patients, however the difference was not
significant (median 7.981 vs. 6.816, p = 0.175). In the
same way, no other miRNA showed any significant
difference between the two groups (Fig. 6).
The relative levels of miRNAs at T0 were also
evaluated with respect to their predictive role in patients’
clinical outcome in terms of PFS and OS. Patients were
grouped in low and high expressors according to a cut
off value corresponding to the mean values of each
miRNA plus 1SD in HDs. Only the levels of miR-19a
reached borderline significance for PFS (HR = 3.091, 95%
confidence interval [CI] =0.904-8.709, p = 0.074) (Fig. 7).
No other miRNA did show any significant (or close to
significant) variation with respect to PFS or OS.
Alunni-Fabbroni et al. BMC Cancer (2018) 18:141
Page 7 of 12
a
b
Fig. 2 Whole blood miRNA levels inter-differentiating the same patient group at T0 and T1. The dot plots show relative levels of the different
oncogenic miR-19a, − 21 and − 22 (a) and tumor suppressor miR-20a, − 127 and -200b (b). The differences were calculated using the Wilcoxon
test; only the corresponding significant p-values are indicated in the graphs (*p ≤ 0.05). (T0: before adjuvant therapy; T1: after adjuvant therapy)
Discussion
The role of miRNA as non-invasive biomarkers has been
proposed in different type of diseases including cancer.
miRNA are considered ideal markers because of their high
stability in extreme conditions such as low pH or high
temperatures [44]. Their presence in body fluids other
than plasma and serum, such as urine [45], saliva [46] and
pancreatic juice [47] has been shown to have a solid
diagnostic value [48]. Independent studies have also
established the value of whole blood miRNA profiling in
early phases of cancer development [26, 27, 49, 50]. In this
study the relative level of a panel of miRNAs with oncogenic or tumor suppressor properties, in part also acting
as immune system modulators, was measured in postoperative EBC patients and compared to healthy donors
or within patient sub-groups. We showed that the levels
of miR-19a, miR-21, miR-22 and miR-127 could
significantly discriminate post-operative non-metastatic
EBC patients from healthy donors before and/or after
adjuvant chemotherapy and at 2 years follow up,
indicating their potential diagnostic value. For both miR19a and miR-21, we did not detect any difference between
their relative levels measured before and after therapy,
suggesting that changes in the expression profile were
independent of treatment. On one hand, miR-21 was
significantly downregulated at T0. This result was
somehow surprising since miR-21 is usually showing
higher levels in serum or plasma of BC patients. However,
since we monitored the miRNA level in whole blood, a
drastic post-operative decrease in miR-21 levels could
indicate a deregulation of the immune and/or inflammatory process, possibly enhancing the neoplastic disease
and promoting proliferation and migration [35, 51]. In
other words the relative upregulation of miR-21 in cancer
cells could have been “diluted” by the higher number of
PBMC characterized by an evident miR-21 downregulation.
Further studies will be nevertheless necessary to confirm this
hypothesis. miR-19a, on the other hand, showed significantly
higher mean values before and after therapy. Since miR-19a
expression is higher in activated lymphocytes [17, 20, 52],
we reasoned that a better prognosis as suggested by survival
curve analysis in post-operative patients could have been
influenced by a stronger early immune response. With
regard to the tumor suppressor miR-127, we found no
significant difference between EBC patients and healthy
donors at the earlier time points, while a significant lower
Alunni-Fabbroni et al. BMC Cancer (2018) 18:141
Page 8 of 12
a
b
Fig. 3 Whole blood miRNA levels inter-differentiating the same patient group between T0 and T2. The dot plots show relative levels of the
different oncogenic miR-19a, − 21 and − 22 (a) and tumor suppressors miR-20a, − 127 and -200b (b). The differences were calculated using the
Wilcoxon test; only the corresponding significant p-values are indicated in the graphs (*p ≤ 0.05). (T0: before adjuvant therapy; T1: after
adjuvant therapy)
level was detected at 2-year follow-up. In addition, miR-127
levels measured repeatedly for the same patients decreased
significantly from T0 to T2. miR-127 has been shown to be
downregulated in BC tissue compared with corresponding
healthy tissue and to correlate with an advanced clinical
stage and metastasis development [32]. The principal target
of miR-127 is the proto-oncogene BCL6 [31], which plays a
direct role in survival, proliferation and differentiation of B
lymphocytes [53]. Consequently, lower levels of miR-127 in
whole blood might indicate a parallel activation of B-cells at
a later time point. Surprisingly, miR-127 gave a different
result when the patients were stratified according to the
presence or absence of CTCs at T0. In this case, miR-127
displayed to be upregulated in CTC positive patients
compared to CTC negative patients. Other studies have
already shown a correlation between CTCs and upregulation of miRNAs with tumor suppressor activity as is the
case with the miR-200 family [54]. Over-expression of miR-
Table 3 Comparisons of baseline miRNA levels in early breast cancer patients according to tumor characteristics. The differences
were calculated using the Mann-Whitney U test and the corresponding p-values are indicated in the table (significant p-values are
indicated in bold). (pT: tumor grade; pN: lymph node status; G: tumor grade)
Tumor characteristics
miR-19a
miR-20a
miR-21
miR-22
miR-127
miR-200b
0.9345
0.8602
0.3771
0.9719
0.7549
0.1049
0.1367
0.8757
0.2502
0.4050
0.5517
0.0032
0.1950
0.7736
0.8899
0.6164
0.8438
0.2286
Tumor stage
pT1 vs. pT2-4
Lymph node status
pN0 vs. pN1-3
Grading
G1-2 vs. G3
Alunni-Fabbroni et al. BMC Cancer (2018) 18:141
Page 9 of 12
a
c
b
d
Fig. 4 Whole blood miRNA levels in patients with different breast cancer subtypes at different time points. The box plots show relative levels of
the different oncogene miRNAs and tumor suppressors miRNAs in the different patients subgroups analyzed at T0 (a), T1 (b) and T2 (c). The
differences were calculated using the Kruskal-Wallis test. Only miR-20a showed a significant difference between the four cancer types after
therapy. miR-20a was further analyzed using the Mann-Whitney U test to compare the four different cancer subtypes. A significant difference
between luminal cancer type A and B is indicated in the dot plot (d) (*p ≤ 0.05). (T0: before adjuvant therapy; T1: after adjuvant therapy; T2: at
2 years follow up; Lum A: luminal breast cancer type A; Lum B: luminal breast cancer type B; HER2: HER2-like tumor; TN: triple negative
breast cancer)
200 s supports the metastatic potential of CTCs inducing
the mesenchymal-epithelial-transition (MET), an essential
step for starting and developing new metastases. The
fourth miRNA which showed significant differences
between EBC patients and healthy controls was miR-22, a
potent activator of EMT and cell proliferation. miR-22 was
upregulated in patients after chemotherapy and at 2-year
follow up, a finding which might suggest a selective
therapeutic pressure favoring the development of aggressive
chemotherapy-resistant tumor cells and possibly micrometastasis with mesenchymal characteristics. Finally,
miR-20a and miR-200b, although always detectable,
failed to significantly differentiate EBC patients from
healthy controls or between patients at different time
points, and therefore showed no prognostic value.
However, both miRNAs showed some grade of correlation
with the primary tumor’s characteristics. miR-20a could
differentiate post-operative patients with less aggressive
luminal A from those with more aggressive luminal B
primary cancer, while miR-200b showed lower mean values
in pN1-3 patients compared to pN0 patients. Further studies
will be necessary to confirm these preliminary findings.
Although our results are promising, some limitations in this work must be mentioned and addressed
in future experimental work. Sampling has been
performed retrospectively and the size of the patient’s
cohort should be expanded to unravel patients’
subgroups or treatment regimens for which miRNAs
could prove to be potential predictive markers. In
addition, SUCCESS A clinical trial protocol missed an
early pre-operative time point for blood collection;
therefore we cannot completely exclude that variations
in miRNAs levels are a consequence of surgery after
systemic immune response. Most of the patients
(62.5%) received nevertheless breast conserving
surgery, a less invasive and less stressing procedure
with respect to mastectomy and blood samples were
collected several days (between 23 and 173) postsurgery, a time frame long enough to assume that
post-operative immune functions had reverted to
physiological conditions [27, 43] and that inflammation
associated miRNAs were disappeared [27, 55]. Furthermore, miRNAs have been isolated not only from PBMCs
but from whole cellular blood fractions, including platelets,
Alunni-Fabbroni et al. BMC Cancer (2018) 18:141
Page 10 of 12
a
b
Fig. 6 Whole blood miRNA levels in patients at T0. The dot plots show
the relative levels of the different miRNAs for patients that developed
metastasis and those that did not. The miRNA levels were compared
between M0 and M1 patients using the Mann-Whitney U test; no
significant differences were found. (M0: metastasis negative; M1:
metastasis positive; T0: before adjuvant therapy)
Fig. 5 Whole blood miRNA levels comparison between CTC+ and CTC
−
patients. Cytokeratin positive circulating tumor cells (CTCs) (in red)
stained with the APAAP immunodetection system (a). Dot plots show
relative levels of oncogenic miR-19a, − 21 and − 22 and of tumor
suppressors miR-20a, − 127 and -200b in the different patients’
subgroups analyzed at T0 (before adjuvant therapy). Only miR-127
showed a significant difference between CTC+ and CTC− patients. The
differences were calculated using the Mann-Whitney U test
(AUC = 0.70; p = 0.043) (*p ≤ 0.05) (b)
granulocytes and red blood cells. Further studies will
be necessary to establish if contamination from cells
other than PBMCs can negatively affect the analysis
and should be eliminated in some way [56]. In
addition, due to the relative small cohort size, the
data must be further validated with a larger number
of cases allowing a more robust statistical testing.
Finally the detection of CTCs was based on an
immunostaining method and not on the FDA-cleared
CellSearch® system, till now considered the gold
standard for CTC isolation and enumeration [57].
Fig. 7 Progression-free survival (PFS) according to whole blood
miR19a levels. High (H) and low (L) miR19a levels were defined as
being above or below the mean values of miR-19a in HDs plus
1standard deviation (SD). PFS was analyzed using the Kaplan-Meier
method and survival estimates in different groups were compared
using the log-rank test
Alunni-Fabbroni et al. BMC Cancer (2018) 18:141
Conclusion
In conclusion, although this work is exploratory and a first
hint pointing the way to future studies based on larger cohorts, nevertheless it suggests that analysis of whole blood
miRNAs, linked to different physiological, immunological
and pathological conditions, could help to better stratify
post-operative BC patients, thereby supporting tailored
therapies with a clear benefit to patient’s management.
Page 11 of 12
University Hospital, Erlangen, Germany. 3Department of Gynecology and
Obstetrics, Medical Faculty and University Hospital, Heinrich-Heine University,
Düsseldorf, Germany. 4Department of Gynecology and Obstetrics, Heidelberg
University Hospital, Heidelberg, Germany. 5RoMed Klinikum Rosenheim,
Rosenheim, Germany. 6Gemeinschaftspraxis Lorenz / Hecker / Wesche,
Braunschweig, Germany. 7Department of Gynecology and Obstetrics, Ulm
University Hospital, Ulm, Germany. 8Laboratory for Experimental Radiology,
Institute for Clinical Radiology, Ludwig-Maximilians-University Hospital,
Marchioninistr. 15, 81377 Munich, Germany. 9Department of Gynecology and
Obstetrics, Medical University of Graz, Graz, Austria.
Received: 2 February 2017 Accepted: 22 January 2018
Additional file
Additional file 1: Table S1. Primer PCR efficiency calculate from slope
and correlation coefficients (r2 values). (DOCX 11 kb)
Abbreviations
BC: Breast cancer; CTC: Circulating tumor cell; DTC: Disseminated tumor cell;
EBC: Early breast cancer; EMT: Epithelial-mesenchymal-transition; ER: Estrogen
receptor; G: Tumor grade; HD: Healthy donor; miRNAs: microRNAs;
OS: Overall survival; PBMC: Peripheral blood mononucleated cell;
PFS: Progression free survival; pN: Lymph node status; PR: Progesterone
receptor; pT: Tumor grade
Acknowledgements
The authors wish to thank Alvera Rengel Puertas and Beate Zill (LudwigMaximilians-University, Munich) for their excellent technical assistance
and all the recruitment centers and the patients for taking part in the
SUCCESS A study.
Funding
No funding to declare
Availability of data and materials
Raw data for individual experiments are available upon request.
Authors’ contributions
MA-F was responsible for study conception and design, data analysis and
interpretation and manuscript writing; LM was responsible for transcriptome
data acquisition and critical review of the manuscript; EKT, MT, TB, RL were
responsible for patient recruitment and sample acquisition; TWPF was
responsible for the statistical analysis revision, SM, PAF, TWPF, AS, TB, RL,
TWPF, WJ, BR were responsible for the data interpretation and revision of the
manuscript for intellectual content. All authors read and approved the final
manuscript.
Ethics approval and consent to participate
The study was approved by all the involved ethical boards (lead ethical
board: Ludwig-Maximilians-University Munich) and conducted in accordance
with the Declaration of Helsinki. All patients and healthy donors provided
written informed consent.
Consent for publication
Not applicable
Competing interests
In frame of the SUCCESS A clinical trial, BR, WJ, AS, PAF received research
funding and/or speaker honoraria from AstraZeneca, Chugai, Lilly, Novartis,
Sanofi-Aventis and Janssen Diagnostics. MA-F, TB, RL, TF, TWPF, LM, SM, EKT
and MT have no competing interest to declare.
Publisher’s Note
Springer Nature remains neutral with regard to jurisdictional claims in
published maps and institutional affiliations.
Author details
1
Department of Gynecology and Obstetrics, University Hospital, LMU Munich,
Munich, Germany. 2Department of Gynecology and Obstetrics, Erlangen
References
1. Siegel R, DeSantis C, Virgo K, Stein K, Mariotto A, Smith T, et al. Cancer
treatment and survivorship statistics, 2012. CA Cancer J Clin. 2012;
62(4):220–41.
2. Ferlay J, Shin HR, Bray F, Forman D, Mathers C, Parkin DM. Estimates of
worldwide burden of cancer in 2008: GLOBOCAN 2008. Int J Cancer. 2010;
127:2893–917.
3. Cote RJ, Rosen PP, Lesser ML, Old LJ, Osborne MP. Prediction of early
relapse in patients with operable breast cancer by detection of occult bone
marrow micrometastases. J Clin Oncol. 1991;9:1749–56.
4. Diel IJ, Kaufmann M, Costa SD, Holle R, von Minckwitz G, Solomayer EF, et
al. Micrometastatic breast cancer cells in bone marrow at primary surgery:
prognostic value in comparison with nodal status. J Natl Cancer Inst. 1996;
88:1652–8.
5. Jung SY, Rosenzweig M, Sereika SM, Linkov F, Brufsky A, Weissfeld JL.
Factors associated with mortality after breast cancer metastasis. Cancer
Causes Control. 2012;23(1):103–12.
6. Weigelt B, Peterse JL, van’t Veer LJ. Breast cancer metastasis: markers and
models. Nat Rev Cancer. 2005;5(8):591–602.
7. Sree SV, Ng EY, Acharya RU, Faust O. Breast imaging: a survey. World J Clin
Oncol. 2011;2(4):171–8.
8. Alunni-Fabbroni M, Muller V, Fehm T, Janni W, Rack B. Monitoring in
metastatic breast cancer: is imaging outdated in the era of circulating
tumor cells? Breast Care. 2014;9(1):16–21.
9. Rack B, Schindlbeck C, Juckstock J, Andergassen U, Hepp P, Zwingers T,
et al. Circulating tumor cells predict survival in early average-to-high risk
breast cancer patients. J Natl Cancer Inst. 2014;106(5). />1093/jnci/dju066.
10. Cristofanilli M, Hayes DF, Budd GT, Ellis MJ, Stopeck A, Reuben JM, et al.
Circulating tumor cells: a novel prognostic factor for newly diagnosed
metastatic breast cancer. J Clin Oncol. 2005;23(7):1420–30.
11. Hayes DF, Cristofanilli M, Budd GT, Ellis MJ, Stopeck A, Miller MC, et al.
Circulating tumor cells at each follow-up time point during therapy of
metastatic breast cancer patients predict progression-free and overall
survival. Clin Cancer Res. 2006;12(14 Pt 1):4218–24.
12. Schwarzenbach H, Nishida N, Calin GA, Pantel K. Clinical relevance of
circulating cell-free microRNAs in cancer. Nat Rev Clin Oncol.
2014;11(3):145–56.
13. Schwarzenbach H, Pantel K. Circulating DNA as biomarker in breast cancer.
Breast Cancer Res. 2015;17(1):136.
14. Turchinovich A, Cho WC. The origin, function and diagnostic potential of
extracellular microRNA in human body fluids. Front Genet. 2014;5:30.
15. Mulrane L, McGee SF, Gallagher WM, O'Connor DP. miRNA dysregulation in
breast cancer. Cancer Res. 2013;73(22):6554–62.
16. Chang HT, Li SC, Ho MR, Pan HW, Ger LP, Hu LY, et al. Comprehensive
analysis of microRNAs in breast cancer. BMC Genomics. 2012;13
(Suppl 7):S18.
17. Sasaki K, Kohanbash G, Hoji A, Ueda R, McDonald HA, Reinhart TA, et al.
miR-17-92 expression in differentiated T cells - implications for cancer
immunotherapy. J Transl Med. 2010;8:17.
18. Okada H, Kohanbash G, Lotze MT. MicroRNAs in immune regulation–
opportunities for cancer immunotherapy. Int J Biochem Cell Biol.
2010;42(8):1256–61.
19. Jasinski-Bergner S, Mandelboim O, Seliger B. The role of microRNAs in the
control of innate immune response in cancer. Natl Cancer Inst. 2014;106(10).
20. Anfossi S, Giordano A, Gao H, Cohen EN, Tin S, Wu Q, et al. High serum
miR-19a levels are associated with inflammatory breast cancer and are
Alunni-Fabbroni et al. BMC Cancer (2018) 18:141
21.
22.
23.
24.
25.
26.
27.
28.
29.
30.
31.
32.
33.
34.
35.
36.
37.
38.
39.
40.
41.
42.
43.
44.
predictive of favorable clinical outcome in patients with metastatic HER2+
inflammatory breast cancer. PLoS One. 2014;9(1):e83113.
Valadi H, Ekstrom K, Bossios A, Sjostrand M, Lee JJ, Lotvall JO. Exosomemediated transfer of mRNAs and microRNAs is a novel mechanism of
genetic exchange between cells. Nat Cell Biol. 2007;9(6):654–9.
Liu J, Wu CP, Lu BF, Jiang JT. Mechanism of T cell regulation by microRNAs.
Cancer Biol Med. 2013;10(3):131–7.
Ha TY. The role of MicroRNAs in regulatory T cells and in the immune
response. Immune Netw. 2011;11(1):11–41.
Lindsay MA. microRNAs and the immune response. Trends Immunol. 2008;
29(7):343–51.
Ma J, Lin Y, Zhan M, Mann DL, Stass SA, Jiang F. Differential miRNA
expressions in peripheral blood mononuclear cells for diagnosis of lung
cancer. Lab Invest. 2015;95(10):1197–206.
Hausler SF, Keller A, Chandran PA, Ziegler K, Zipp K, Heuer S, et al. Whole
blood-derived miRNA profiles as potential new tools for ovarian cancer
screening. Br J Cancer. 2010;103(5):693–700.
Heneghan HM, Miller N, Lowery AJ, Sweeney KJ, Newell J, Kerin MJ.
Circulating microRNAs as novel minimally invasive biomarkers for breast
cancer. Ann Surg. 2010;251(3):499–505.
Sheedy FJ. Turning 21: induction of miR-21 as a key switch in the
inflammatory response. Front Immunol. 2015;6:19.
Schardt JA, Meyer M, Hartmann CH, Schubert F, Schmidt-Kittler O,
Fuhrmann C, et al. Genomic analysis of single cytokeratin-positive cells from
bone marrow reveals early mutational events in breast cancer. Cancer Cell.
2005;8(3):227–39.
Song SJ, Pandolfi PP. miR-22 in tumorigenesis. Cell Cycle. 2014;13(1):11–2.
Chen J, Wang M, Guo M, Xie Y, Cong YS. miR-127 regulates cell proliferation
and senescence by targeting BCL6. PLoS One. 2013;8(11):e80266.
Wang S, Li H, Wang J, Wang D, Yao A, Li Q. Prognostic and biological
significance of microRNA-127 expression in human breast cancer. Dis
Markers. 2014;2014:401986.
Sylvestre Y, De Guire V, Querido E, Mukhopadhyay UK, Bourdeau V, Major F,
et al. An E2F/miR-20a autoregulatory feedback loop. J Biol Chem. 2007;
282(4):2135–43.
Li X, Roslan S, Johnstone CN, Wright JA, Bracken CP, Anderson M, et al. MiR200 can repress breast cancer metastasis through ZEB1-independent but
moesin-dependent pathways. Oncogene. 2014;33(31):4077–88.
Dong L, Wang X, Tan J, Li H, Qian W, Chen J, et al. Decreased expression of
microRNA-21 correlates with the imbalance of Th17 and Treg cells in
patients with rheumatoid arthritis. J Cell Mol Med. 2014;18(11):2213–24.
Tili E, Croce CM, Michaille JJ. miR-155: on the crosstalk between
inflammation and cancer. Int Rev Immunol. 2009;28(5):264–84.
World Medical A. World medical association declaration of Helsinki: ethical
principles for medical research involving human subjects. JAMA. 2013;
310(20):2191–4.
Singletary SE, Allred C, Ashley P, Bassett LW, Berry D, Bland KI, et al. Revision
of the American joint committee on cancer staging system for breast
cancer. J Clin Oncol. 2002;20(17):3628–36.
Livak KJ, Schmittgen TD. Analysis of relative gene expression data using
real-time quantitative PCR and the 2(−Delta Delta C(T)) method. Methods.
2001;25(4):402–8.
Andersen CL, Jensen JL, Orntoft TF. Normalization of real-time quantitative
reverse transcription-PCR data: a model-based variance estimation approach
to identify genes suited for normalization, applied to bladder and colon
cancer data sets. Cancer Res. 2004;64(15):5245–50.
Stigbrand T, Andres C, Bellanger L, Bishr Omary M, Bodenmuller H, Bonfrer
H, et al. Epitope specificity of 30 monoclonal antibodies against cytokeratin
antigens: the ISOBM TD5-1 workshop. Tumour Biol. 1998;19(2):132–52.
Rack B, Juckstock J, Gunthner-Biller M, Andergassen U, Neugebauer J, Hepp
P, et al. Trastuzumab clears HER2/neu-positive isolated tumor cells from
bone marrow in primary breast cancer patients. Arch Gynecol Obstet. 2012;
285(2):485–92.
Healy NA, Heneghan HM, Miller N, Osborne CK, Schiff R, Kerin MJ. Systemic
mirnas as potential biomarkers for malignancy. Int J Cancer. 2012;131(10):
2215–22.
Mitchell PS, Parkin RK, Kroh EM, Fritz BR, Wyman SK, Pogosova-Agadjanyan
EL, et al. Circulating microRNAs as stable blood-based markers for cancer
detection. Proc Natl Acad Sci U S A. 2008;105(30):10513–8.
Page 12 of 12
45. Gasparri ML, Casorelli A, Bardhi E, Besharat AR, Savone D, Ruscito I, et al.
Beyond circulating microRNA biomarkers: urinary microRNAs in ovarian and
breast cancer. Tumour Biol. 2017;39(5):1010428317695525.
46. Park NJ, Zhou H, Elashoff D, Henson BS, Kastratovic DA, Abemayor E, et al.
Salivary microRNA: discovery, characterization, and clinical utility for oral
cancer detection. Clin Cancer Res. 2009;15(17):5473–7.
47. Sadakari Y, Ohtsuka T, Ohuchida K, Tsutsumi K, Takahata S, Nakamura M,
et al. MicroRNA expression analyses in preoperative pancreatic juice
samples of pancreatic ductal adenocarcinoma. JOP. 2010;11(6):587–92.
48. Armand-Labit V, Pradines A. Circulating cell-free microRNAs as clinical
cancer biomarkers. Biomol Concepts. 2017;8(2):61–81.
49. Marigo I, Dolcetti L, Serafini P, Zanovello P, Bronte V. Tumor-induced
tolerance and immune suppression by myeloid derived suppressor cells.
Immunol Rev. 2008;222:162–79.
50. He W, Kularatne SA, Kalli KR, Prendergast FG, Amato RJ, Klee GG, et al.
Quantitation of circulating tumor cells in blood samples from ovarian and
prostate cancer patients using tumor-specific fluorescent ligands. Int J
Cancer. 2008;123(8):1968–73.
51. Ng EK, Li R, Shin VY, Jin HC, Leung CP, Ma ES, et al. Circulating microRNAs
as specific biomarkers for breast cancer detection. PLoS One. 2013;8(1):
e53141.
52. Wu T, Wieland A, Araki K, Davis CW, Ye L, Hale JS, et al. Temporal expression
of microRNA cluster miR-17-92 regulates effector and memory CD8+ T-cell
differentiation. Proc Natl Acad Sci U S A. 2012;109(25):9965–70.
53. Duy C, Yu JJ, Nahar R, Swaminathan S, Kweon SM, Polo JM, et al. BCL6 is
critical for the development of a diverse primary B cell repertoire. J Exp
Med. 2010;207(6):1209–21.
54. Madhavan D, Zucknick M, Wallwiener M, Cuk K, Modugno C, Scharpff M, et
al. Circulating miRNAs as surrogate markers for circulating tumor cells and
prognostic markers in metastatic breast cancer. Clin Cancer Res. 2012;18(21):
5972–82.
55. Kodahl AR, Zeuthen P, Binder H, Knoop AS, Ditzel HJ. Alterations in
circulating miRNA levels following early-stage estrogen receptor-positive
breast cancer resection in post-menopausal women. PLoS One. 2014;9(7):
e101950.
56. Atarod S, Smith H, Dickinson A, Wang XN. MicroRNA levels quantified in
whole blood varies from PBMCs. F1000Research. 2014;3:183.
57. Jueckstock J, Rack B, Friedl TW, Scholz C, Steidl J, Trapp E, et al. Detection of
circulating tumor cells using manually performed immunocytochemistry
(MICC) does not correlate with outcome in patients with early breast cancer
- results of the German SUCCESS-A- trial. BMC Cancer. 2016;16(1):401.
58. Ma L, Teruya-Feldstein J, Weinberg RA. Tumour invasion and metastasis
initiated by microRNA-10b in breast cancer. Nature. 2007;449(7163):682–8.
59. Mu P, Han YC, Betel D, Yao E, Squatrito M, Ogrodowski P, et al. Genetic
dissection of the miR-17~92 cluster of microRNAs in Myc-induced B-cell
lymphomas. Genes Dev. 2009;23(24):2806–11.
60. Olive V, Bennett MJ, Walker JC, Ma C, Jiang I, Cordon-Cardo C, et al.
miR-19 is a key oncogenic component of mir-17-92. Genes Dev. 2009;
23(24):2839–49.
61. Lykken EA, Li QJ. microRNAs at the regulatory frontier: an investigation into
how microRNAs impact the development and effector functions of CD4 T
cells. Immunol Res. 2011;49(1-3):87–96.
62. Yan LX, Huang XF, Shao Q, Huang MY, Deng L, Wu QL, et al. MicroRNA miR21 overexpression in human breast cancer is associated with advanced
clinical stage, lymph node metastasis and patient poor prognosis. RNA.
2008;14(11):2348–60.
63. Si ML, Zhu S, Wu H, Lu Z, Wu F, Mo YY. miR-21-mediated tumor growth.
Oncogene. 2007;26(19):2799–803.
64. Wang L, He L, Zhang R, Liu X, Ren Y, Liu Z, et al. Regulation of T
lymphocyte activation by microRNA-21. Mol Immunol. 2014;59(2):163–71.
65. Pandey DP, Picard D. miR-22 inhibits estrogen signaling by directly
targeting the estrogen receptor alpha mRNA. Mol Cell Biol. 2009;29(13):
3783–90.
66. Gregory PA, Bert AG, Paterson EL, Barry SC, Tsykin A, Farshid G, et al. The
miR-200 family and miR-205 regulate epithelial to mesenchymal transition
by targeting ZEB1 and SIP1. Nat Cell Biol. 2008;10(5):593–601.
67. Park SM, Gaur AB, Lengyel E, Peter ME. The miR-200 family determines the
epithelial phenotype of cancer cells by targeting the E-cadherin repressors
ZEB1 and ZEB2. Genes Dev. 2008;22(7):894–907.