Gene expression profiling of 1200 pancreatic ductal adenocarcinoma reveals novel subtypes
Bạn đang xem bản rút gọn của tài liệu. Xem và tải ngay bản đầy đủ của tài liệu tại đây (2.58 MB, 13 trang )
Zhao et al. BMC Cancer (2018) 18:603
/>
RESEARCH ARTICLE
Open Access
Gene expression profiling of 1200
pancreatic ductal adenocarcinoma
reveals novel subtypes
Lan Zhao* , Hongya Zhao and Hong Yan
Abstract
Background: Pancreatic ductal adenocarcinoma (PDAC) is the fourth leading cause of cancer related death in the
world with a five-year survival rate of less than 5%. Not all PDAC are the same, because there exist intra-tumoral
heterogeneity between PDAC, which poses a great challenge to personalized treatments for PDAC.
Methods: To dissect the molecular heterogeneity of PDAC, we performed a retrospective meta-analysis on whole
transcriptome data from more than 1200 PDAC patients. Subtypes were identified based on non-negative matrix
factorization (NMF) biclustering method. We used the gene set enrichment analysis (GSEA) and survival analysis to
conduct the molecular and clinical characterization of the identified subtypes, respectively.
Results: Six molecular and clinical distinct subtypes of PDAC: L1-L6, are identified and grouped into tumor-specific
(L1, L2 and L6) and stroma-specific subtypes (L3, L4 and L5). For tumor-specific subtypes, L1 (~ 22%) has enriched
carbohydrate metabolism-related gene sets and has intermediate survival. L2 (~ 22%) has the worst clinical outcomes,
and is enriched for cell proliferation-related gene sets. About 23% patients can be classified into L6, which leads to
intermediate survival and is enriched for lipid and protein metabolism-related gene sets. Stroma-specific subtypes may
contain high non-epithelial contents such as collagen, immune and islet cells, respectively. For instance, L3 (~ 12%) has
poor survival and is enriched for collagen-associated gene sets. L4 (~ 14%) is enriched for various immune-related gene
sets and has relatively good survival. And L5 (~ 7%) has good clinical outcomes and is enriched for neurotransmitter
and insulin secretion related gene sets. In the meantime, we identified 160 subtype-specific markers and built a deep
learning-based classifier for PDAC. We also applied our classification system on validation datasets and observed much
similar molecular and clinical characteristics between subtypes.
Conclusions: Our study is the largest cohort of PDAC gene expression profiles investigated so far, which greatly
increased the statistical power and provided more robust results. We identified six molecular and clinical distinct subtypes
to describe a more complete picture of the PDAC heterogeneity. The 160 subtype-specific markers and a deep learning
based classification system may be used to better stratify PDAC patients for personalized treatments.
Keywords: Pancreatic ductal adenocarcinoma, Heterogeneity, Biclustering, Subtype, Deep learning, Biomarkers
* Correspondence: ;
Department of Electronic Engineering, City University of Hong Kong, 83 Tat
Chee Ave, Kowloon Tong, Hong Kong
© The Author(s). 2018 Open Access This article is distributed under the terms of the Creative Commons Attribution 4.0
International License ( which permits unrestricted use, distribution, and
reproduction in any medium, provided you give appropriate credit to the original author(s) and the source, provide a link to
the Creative Commons license, and indicate if changes were made. The Creative Commons Public Domain Dedication waiver
( applies to the data made available in this article, unless otherwise stated.
Zhao et al. BMC Cancer (2018) 18:603
Background
The pancreas is both an exocrine and endocrine gland,
playing important roles in the digestive and endocrine
systems. There are two kinds of cells in the pancreas:
exocrine cells and endocrine cells. When exocrine cells
grow out of control, they may form pancreatic exocrine
tumors. About 95% of pancreatic cancers can be classified into pancreatic exocrine tumors. One kind of
pancreatic exocrine tumor called pancreatic ductal
adenocarcinoma (PDAC) is the most common type,
making up more than 85% of all pancreatic cancers.
PDAC is the fourth leading cause of cancer related death
in the world with a 5-year survival rate of only 5% [1].
Surgery is by far the most effective treatment strategy
for PDAC, but less than 20% of PDAC patients have resectable tumors at the time of diagnosis [2, 3], with the
improving 5-year survival rate after resection to 10–25%
[4, 5]. The etiology of PDAC are poorly understood.
However, several factors like cigarette smoking [6], family
history of pancreatic cancer [7], diabetes [8] and chronic
pancreatitis [9] are contributing factors for PDAC.
Like other malignancies, the intra-tumoral heterogeneity makes PDAC not a single disease, but a group of
biologically and clinically distinct diseases [10, 11]. Thus,
there is a great need to identify homogeneous groups
which is an essential step towards personalized treatment of PDAC. Traditional classification of PDAC has
been carried out by pathologists based on histologic
appearance and phenotypic traits. However, in reality,
tumors with similar morphological appearance may have
very distinct molecular features and clinical outcomes
[12, 13]. Recent advancements in genome wide molecular profiling may change these situations by providing an
opportunity to investigate the tumor heterogeneity at
the whole genome level. Gene expression profiling, one
of the most commonly used molecular profiling approaches, is the measurement of the expression levels of
thousands of genes simultaneously. And, microarray and
RNA sequencing (RNA-Seq) are the two most used
techniques. Gene expression profiling have allowed researchers to classify cancers into homogeneous groups
with improved diagnosis [14–16] and correlated better
with survival information than traditional classification
of cancers [17]. Over the last few years, increasing molecular classification studies have been conducted in
PDAC which proved that it can be classified into 2 to 4
subgroups [18–24]. However, these studies used tumor
samples ranging from dozens to more than few hundreds as their discovery cohort. They may not fully represent the intra-tumoral heterogeneity and limit the
ability to identify rare subtypes of PDAC.
Another concern in dissecting the tumor heterogeneity
is the methods used in the identification process. Given
a set of gene expression profiles, clustering, a machine
Page 2 of 13
learning technique, can be used to group data objects of
similar characteristics together into distinct clusters
without prior assignment (unsupervised classification).
There are three kinds of clustering strategies [25]: first,
gene-based clustering, which the genes are treated as the
objects, while the samples are the features. Second,
sample-based clustering which the samples are the objects and genes are the features. And third, biclustering
(or subspace clustering) which capture clusters formed
by a subset of genes across a subset of samples. The previous two strategies apply a global model to identify
clusters. That is, each sample in a subtype is determined
by the activity of all the genes. Similarly, each gene in a
given gene cluster is defined using all the samples when
performing the clustering analysis [26]. Since subsets of
genes are active or silent only under certain experimental conditions, and behave almost independently under
other conditions [26], the classification results are relatively poor when using the global model [27].
Only biclustering employ a local model to identify coherent patterns in an expression matrix. Instead of clustering gene and sample separately, biclustering allows
simultaneous clustering of genes and samples [26]. Thus,
biclustering has become a popular technique and lots of
algorithms are proposed, such as distance-based [28, 29],
factorization-based [30, 31] and geometric-based biclustering [32, 33]. Most biclustering algorithms [34–38]
allow bi-clusters to have partially overlap, and some objects (samples or genes) may not belong to any bi-cluster
at all [39, 40]. This character of biclustering, although useful in some instances [26], is not good for interpretation.
Non-negative Matrix Factorization (NMF), a dimensionality reduction and factorization-based biclustering algorithm, aims to find groups of linear combination of
metagenes representing local patterns in the expression
matrix. NMF has been proven useful in many cancer subtyping studies [18, 20, 23, 41, 42] due to its easy interpretation and desired performances.
In our study, we focused on using NMF to extract
biclusters from gene expression data, thus to describe
and characterize the heterogeneity of PDAC. We
overcame the sample shortage by combining different
sources of PDAC into a single and large dataset. Specifically, we collected publically available PDAC gene expression profilings from 11 microarrays and 3 RNA-Seq
datasets. In total, our study involves more than 1200
PDAC patients, and 796 of them were used as the discovery cohort. This is the largest cohort of PDAC gene
expression profiles investigated so far, which greatly increased the statistical power and provided more robust
results. We identified six molecular and clinical distinct
subtypes, and provided a deep learning-based classification system for PDAC. Compared with previous studies
[18–24], our study has several advantages. First, we
Zhao et al. BMC Cancer (2018) 18:603
included more PDAC cases to increase statistical reliability. Second, we selected genes as subtype-specific
biomarkers directly from biclusters. Third, we identified
six subtypes to provide and describe a more complete
picture of the PDAC heterogeneity. Last but not least,
we used deep learning to build a classification system for
PDAC, which can be used to classify new patients. The
classification model will be publicly available upon request.
Methods
Data curation and pre-processing
We searched multiple data repositories, including the
International Cancer Genome Consortium (ICGC,
www.icgc.org), the Cancer Genome Atlas (TCGA,
Gene Expression Omnibus
(GEO, and ArrayExpress
( for available gene expression profiling datasets for PDAC. We came across
altogether 14 datasets, which were listed below:
We collected 3 RNA-Seq datasets in our study, one
from TCGA, and another two from ICGC and GSE79670.
RNA-Seq datasets were pre-processed as follows: RSEM
values of TCGA Pancreatic Adenocarcinoma mRNA-Seq
were downloaded through TCGA2STAT R package [43],
which contains 172 non-overlapping primary PDAC patients with detailed clinical information. Data were subsequently normalized using TMM (weighted trimmed mean
of M-values) with the EdgeR package [44], and converted
to counts per million (cpm) and log2 transformed. A
filtering process was also performed to exclude the genes
without at least 1 cpm in 20% of the samples. Raw counts
data of GSE79670, which contains 51 primary PDAC patients, were downloaded from GEO and normalized in the
same way as in the TCGA dataset. The third and the last
RNA-Seq dataset can be downloaded either from ICGC
under the identifier PACA-AU, or from the supplemental
material in the corresponding publication [23]. We chose
to download this dataset from the latter option and named
this dataset as Bailey. This dataset contains normalized expression values (data were normalized in the
same way as in the previously mentioned two
RNA-Seq datasets) of 96 pancreatic cancer patients
and 71 of them were PDAC. Only PDAC samples
were retained for the following analysis.
There were also 11 microarray datasets in our study,
which were listed below according to their sample size:
MTAB-1791 (195 primary PDAC, Illumina WG6 BeadChip v3 array), ICGCarray (178 primary PDAC, Illumina
HT12 v3 array), GSE71729 (145 primary PDAC,
Agilent-014850 array), GSE62165 (118 primary PDAC,
Affymetrix U219 array), GSE62452 (69 primary PDAC,
Affymetrix 1.0 ST array), GSE57495 (63 primary PDAC,
Rosetta/Merck Affymetrix 2.0 array), GSE60980 (49 primary PDAC, Agilent-028004 array), GSE77858 (46 primary
Page 3 of 13
PDAC, Agilent-012097 array), GSE55643 (45 primary
PDAC, Agilent-014850 array), GSE15471 (39 primary
PDAC, Affymetrix U133 Plus 2.0 array) and Collisson (27
primary PDAC, Affymetrix U133 Plus 2.0 array). Among
them, ICGCarray originally contains 269 PDAC tissue and
pancreatic cell lines samples. After removing cell lines,
non-PDACs and metastatic tumors, 178 primary PDAC
tumor samples were retained. Datasets used in our study
can be found in Table 1.
We downloaded raw counts, processed microarray
data, and associated clinical information from public
data repositories for each dataset. Counts data were
pre-processed as mentioned above. Then, the gene expression profile on probe level (or Ensembl ID level) was
converted into official gene symbol level. When multiple
probe sets (or Ensembl IDs) were mapped to the same
gene symbol, the probe sets (or Ensembl IDs) with the
largest mean expression values across samples were kept.
Only primary tumor samples were retained. Metastasis
samples or treated patients samples were excluded from
the analysis. Datasets without clinical information were
used for training. Except for GSE77858 dataset, which
without clinical information, and used as one of the validation dataset, because this dataset has relatively low
variable genes (~ 42 variable genes). In order to determine whether the identified subtypes have distinct survival differences, we also included two large datasets
from ICGC and TCGA, which contain detailed clinical
information, as our training datasets as well. So in total,
7 independent datasets from 5 platforms, with 796
primary PDAC patients were used for training. The
remaining 7 datasets with 472 primary PDAC patients,
were either combined or independently used as the validation datasets. Datasets were combined by concatenating
Table 1 Datasets used in the study
DataSet
Sample Size Platform
clinical Data Note
ICGCarray
178
Illumina
Yes
Training set
TCGA
172
RNA-Seq
Yes
Training set
MTAB-1791 195
Illumina
No
Training set
GSE62165
118
Affymetrix
No
Training set
GSE60980
49
Agilent-028004
No
Training set
GSE15471
39
Affymetrix, plus2 No
Training set
GSE55643
45
Agilent-014850
No
Training set
Bailey
71
RNA-Seq
Yes
Validation set
GSE71729
145
Agilent-014850
Yes
Validation set
GSE57495
63
Rosetta/Merck
Yes
Validation set
GSE79670
51
RNA-Seq
Yes
Validation set
GSE62452
69
Affymetrix
Yes
Validation set
Collisson
27
Affymetrix, plus2 Yes
Validation set
GSE77858
46
Agilent-012097
Validation set
No
Zhao et al. BMC Cancer (2018) 18:603
data matrices together, followed by using ComBat [45] to
adjust the introduced batch effects. Additional file 1:
Figure S1 shows the principal component analysis (PCA)
before and after batch effect correction for training and
validation datasets.
Identification of PDAC subtypes
Before performing NMF, a filtering procedure was applied to remove genes with low variability across the
samples in 7 dataset from the training cohorts, respectively. The idea is that higher variable genes are informative in the clustering process. Specifically, the median
absolute deviation (MAD) value of each gene was calculated. If the value was less than 0.5, then that gene was
excluded from the clustering analysis.
The filtering step resulted in 411 most variable genes
that were kept for the clustering process. NMF R package [46] was used to perform clustering using the Brunet
algorithm. We varied the number of clusters k from 2 to
10 and repeated the clustering process 30 times. The
value of k that results in the maximum cophenetic correlation coefficient was chosen as the optimal number of
clusters. Then we performed clustering 200 times with
optimal k and random initialization to obtain the consensus matrix, sample labels and associated meta-genes.
Page 4 of 13
study, GSEA was performed using the R package Piano
[51], together with the version 6.0 annotated gene sets
(H, C2 and C5) downloaded from the MsigDB database.
We used the gene sets with the number of genes ranging
from 10 to 500, 1, 000 permutations for gene sampling
and 20 cpus to conduct the analysis. Significantly
enriched gene sets (adjust p-value less than 0.05) were
ranked according to consensus scores [51], top 10 representative gene sets with largest consensus scores were
selected for each subtype, respectively, and used for
heatmap visualization. Specifically, a data matrix was
generated with rows defined by the selected gene sets,
and columns by consensus scores for each subtype.
Then, pheatmap R package was used for the heatmap
visualization.
Survival analysis
Clinical data were downloaded from associated published results. Median survival was estimated using the
Kaplan–Meier method and the difference was tested
using the log-rank test. P-values of less than 0.05 were
considered statistically significant. We also applied Fisher’s
exact test to investigate the relationships among subtype,
tumor stage, tumor grade and other clinical information
(Additional file 2: Table S1).
Generation of the PDAC classifier and classification
Results
A classifier was built on the most representative samples
and most predictive genes for each cluster. Silhouette
width [47] was computed to identify the most representative samples using the R package Cluster. Subtype specific genes were determined using the extractFeatures
function in the NMF package [46], with the largest row
feature scores. Then, SAM (Significance Analysis of Microarrays) [48] analysis was performed to filter out unstable genes between clusters. Figure 1 summarized the
classifier building process.
We trained a deep learning model as the PDAC classifier using the H2O R package [49]. We split the training
dataset into three parts when building the model: 60%
for training, 20% for validation and the remaining 20%
for testing. The parameters we used were as follows:
TanhWithDropout activation, bernoulli distribution, and
two hidden layers with 500 neurons each. The other parameters were set as default. The classification performance of the classifier was verified on the training and
validation datasets.
NMF identifies six subtypes in PDAC
Gene set enrichment analysis (GSEA)
Before GSEA, we used the limma package [50] to calculate the fold changes of one subtype versus all other subtypes in the combined training dataset. For each
subtype, more than 10, 000 genes fold change values
were used as the input data in the GSEA analysis. In our
We applied NMF to the merged training dataset (796
PDAC patients), and obtained 2 to 6 well-defined clusters (Additional file 3: Figure S2). Cophenetic correlation
coefficients were calculated to determine the optimal
number of clusters, and a peak was found at k = 6
(Fig. 2a). The consensus matrix heatmap contains sharp
and crisp boundaries, which implies stable and robust
clustering for the samples (Fig. 2b). Silhouette width
analysis was subsequently performed to select the most
representative samples within each cluster (Fig. 2c). The
average silhouette width was 0.55 (range, from 0.41 to
0.64), indicating the robustness of the classification. A
total number of 781 samples (~ 98%) with positive silhouette width were retained to build the classifier.
Next, 160 metagenes identified by NMF were selected
as features (Table 2), together with 781 sample’s Z-score
normalized data to build a deep learning classifier of
PDAC. We used the H2O package to split the merged
training dataset into three parts: internal training set
(470 PDAC, 60%), internal validation set (152 PDAC,
20%) and internal test set (159 PDAC, 20%). The internal
training set was used for building the model, the internal
validation set for early stopping, and internal test set for
testing the classification error. The classification errors on
the internal training set and internal test set were 0.8
and 13%, respectively (Additional file 4: Table S2).
Zhao et al. BMC Cancer (2018) 18:603
Page 5 of 13
a
b
Cohort 1
Cohort 2
….
Cohort 14
7 training sets (796 PDAC patients,
348 of them have clinical information)
Select variable genes for
each datasets (MAD > 0.5)
Combine (411 genes) and
batch effect correction
7 validation sets (472 PDAC patients,
406 of them have clinical information)
Combine (411 genes) and
batch effect correction
Validation dataset (411
genes * 472 samples)
c
Training dataset (411 genes
* 796 samples)
Determine No. of clusters
Build a classifier
Sample selection
Gene selection
-Cluster 1: PGC, DPCR1, ..
-Cluster 2: CST6, DKK1, …
-Cluster 3: ACTG2, GAS1, ..
-Cluster 4: CCR7, CCL19, ...
-Cluster 5: IAPP, CHGA, …
-Cluster 6: CPA1, CLPS, …
NMF consensus clustering
1
6 biclusters
2
3
4
5
6
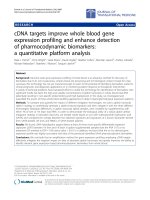
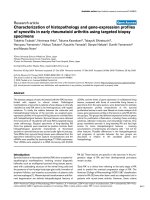
Fig. 1 The flowchart of the classifier building process. a Data processing step. Fourteen datasets were collected and separated into training and
validation datasets. Four hundred eleven most variable genes were then selected based on the median absolute deviation (MAD > 0.5), and were
kept for the clustering process. b NMF clustering step. Six-cluster resulted the maximum cophenetic correlation coefficient was chosen as the optimal
number of clusters. Then, NMF clustering were performed of 200 times with optimal number of clusters to obtain the consensus matrix. c Classifier
building steps. A classifier was built on the most representative samples and most predictive genes for each cluster
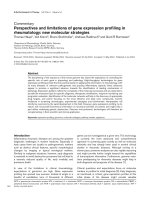
The classifier can be used to classify all the 796
PDAC patients in the training dataset into six subtypes: L1 (174 patients, 21.9%), L2 (176 patients,
22.1%), L3 (93 patients, 11.7%), L4 (113 patients,
14.2%), L5 (56 patients, 7.0%) and L6 (184 patients,
23.1%) (Fig. 2d). We also did the classification with
the combined validation dataset. Patients in this dataset can also be classified into six subtypes with a
similar proportions of patients being distributed
among subtypes (Fig. 2e). In addition, we found that
there were 65 overlapped samples between our training and combined validation dataset. More specifically, 65 samples were overlapped between ICGCarray
set (178 PDAC, microarray platform) and Bailey set
(71 PDAC, RNA-Seq platform). We extracted the 65
predicted sample labels from these two cohorts and
compared the similarities between them. Result shows
that the two lists were similar, except that there were
17 samples with inconsistent classification results,
which may be jointly caused by platform differences
and the classification error of the classifier.
Functional annotation of PDAC subtypes
There are distinct gene expression patterns between subtypes as observed in the heatmaps from both training
and merged validation datasets (Fig. 3a-b). In the heatmap, columns correspond to PDAC patients, and rows
to 160 genes. Gene expression matrices were median
centered and expression values were represented by different colors, red means higher expression values, and
green, lower ones. We have found that carbohydrate metabolism genes such as ALDOB, CA2, NPC1L1 and PGC
are highly expressed in L1. Cell proliferation and
epithelium-associated genes, such as CCNB2, CDKN2A,
SFN, UBE2C, SPRR3, DHRS9 and CRABP2 are enriched
in L2 subtypes. GREM1, MFAP5, COL12A1, COL10A1,
COL8A1 and other collagen or ECM-related genes are
upregulated in L3. Immune related genes such as CCL,
CCR7 and CD gene families are enriched in L4 subtype.
Neuroendocrine-associated genes such as PAX6, IAPP,
G6PC2, ABCC8 and ZBTB16 are highly expressed in L5.
And lastly, CLPS, PLA2G1B, CEL, ALB, CPA1, CPB1,
CTRL, SLC3A1, PRSS3 and ANPEP, which are involved
in lipid and protein metabolism, are enriched in the L6
subtype (Table 2 and Additional file 5: Figure S3).
To identify gene sets enriched in each subtype, we
then performed GSEA analysis. GSEA is a widely used
method to interpret expression data at the level of gene
sets, or groups of genes that share a common biological
function, or regulation [52]. We subsequently selected
altogether 60 most representative gene sets for L1-L6 to
build a pathway heatmap, which reveals distinct gene
sets enriched in each subtype (Fig. 3c). Based on the biological functions of the selected gene sets, we further
Zhao et al. BMC Cancer (2018) 18:603
Page 6 of 13
a
b
c
d
e
Fig. 2 Classification of PDAC into 6 subtypes. a Unsupervised classification of PDAC using NMF. A peak cophenetic correlation was observed for
k = 6 classes. b Consensus matrix for k = 6 is shown. c Silhouette information for k = 6 classes. d Patient distribution in the training dataset (n = 796).
e Patient distribution in the merged validation dataset (n = 472)
grouped the six-subtype into tumor-specific and
stroma-specific subtypes. Tumor-specific subtypes include L1, L2 and L6, which are associated with cell proliferation and metabolism-related gene sets. Specifically,
L1 has enriched carbohydrate metabolism-related gene sets.
L2 is enriched for cell proliferation and epithelium-associated gene sets. And L6 is enriched for lipid and protein
metabolism-related gene sets. Stroma-specific subtypes include L3, L4 and L5, which may contain high nonepithelial
contents such as collagen, immune and islet cells, respectively. For instance, L3 is enriched for collagen and ECM related gene sets. L4 is enriched for various immune related
gene sets. And L5 is enriched for neurotransmitter and insulin secretion related gene sets. Significantly enriched
gene sets for each subtype were displayed in Additional file 6: Table S3.
Clinical characterization of PDAC subtypes
About 348 patients (~ 43.7%) in the training dataset have
clinical information. Their subtype labels and associated
overall survival information were used to perform
survival analysis and clinical characterizations. KaplanMeier analysis indicated that L2 has the worst clinical
outcomes compared with other five subtypes (Fig. 4a). During the first 24 months after diagnosis, approximately 75%
patients in L2 and L3, respectively, were censored. And the
death rate in L2 was larger than that in L3, as observed in a
steeper slope in the survival curves (Fig. 4a). Although there
were no significant survival differences in L1, L3, L4 and L6
during the first 20 months after diagnosis, the survival differences were observed after 20 months, and the death rate
of L3 and L6 rapidly increased compared with L1 and L4.
L5 always has good clinical outcomes compared with the
other 5 subtypes. We also observed a similar overall survival differences between subtypes in the merged validation
dataset (Fig. 4b). Lastly, we did the Fisher’s exact test to investigate if the subtype memberships have any associations
with other clinical factors, such as age, gender, race, tumor
stage and grade. Results shows that only tumor grade have
certain associations with subtypes (p-value < 0.01). For example, more than 97% patients in L2 and more than 95%
patients in L3 have moderately or poorly differentiated
tumor cells, whereas about 32% patients in L5 have well
differentiated tumor cells (Additional file 2: Table S1). This
analysis demonstrates that other clinical factors (such as
age, gender, race and tumor stage) cannot predict overall
Zhao et al. BMC Cancer (2018) 18:603
Page 7 of 13
Table 2 Subtype specific gene lists
Tumor-specific subtypes
Stroma-specific subtypes
L1
L2
L6
L3
L4
L5
AGR2
ADM
AKAP7
ACTG2
ADAMTS1
ABCC8
ALDOB
ANGPTL4
ALB
CDH11
C1orf162
ADAMTSL2
ANXA13
C19orf33
ANPEP
COL10A1
CCL2, 19, 21
C7
AQP5
CCNB2
AQP8
COL12A1
CCR7
CHGA
ARL14
CDH3
CEL
COL8A1
CD2, CD3D,
CD6, CD8A,
CD36, CD48,
CD52, CD69,
CD79B, CD163,
CD247
COLEC11
C4BPB
CDKN2A
CLPS
COLEC12
CFD
CPE
CA2
COL7A1
CPA1
GAS1
CILP
F2RL2
CDCA7
CRABP2
CPB1
GREM1
CXCL9, 10, 12
FRZB
CTSE
CST6
CTRC
LRRC17
CXCR4
G6PC2
CYP3A5
DCBLD2
CTRL
MFAP5
EVI2B
IAPP
DMBT1
DHRS9
GATM
MYH11
FAM107A
NPTX2
DPCR1
DKK1
KLK1
PDGFRL
FCN1
PAX6
F5
ENO2
LEFTY1
RGS16
FOSB
PTGDS
FAM3D
IFI44L
LGALS2
SCUBE2
FPR1
QPCT
GPX2
IFIT1
MT1G
SFRP2
FYB
RAB26
LGALS4
IGF2BP3
PLA2G1B
GIMAP7
SCG5
MMP1
IRX3
PPY
GZMA
STMN2
NPC1L1
ISG15
PRSS3
GZMB
THBS4
PGC
KRT7
REG1A
HBB
ZBTB16
PIGR
LAMA3
SERPINA5
HLA-DQA1
ST6GALNAC1
LAMB3
SLC30A2
IL1B
TFF1
LAMC2
SLC3A1
IL33
TFF2
MYEOV
TMED6
IL6
TFF3
PHACTR3
IL7R
VILL
PSCA
LTB
VNN1
PTGS2
S100A8
VSIG2
S100A4
SCARA5
SFN
SFRP1
SLC2A1
SLIT3
SPRR3
SPOCK2
UBE2C
SRGN
survival, and supports the use of subtypes as a new and reliable prognostic factor in PDAC.
Cross comparison of the identified subtypes with
published studies
To compare our classification system with three previously published results [18, 20, 23], we then used our
PDAC classifier to classify these three cohorts, separately. Gene expression heatmaps (Fig. 3d-f ) and survival
curves (Fig. 4c-e) show much similar patterns between
validation datasets and the training dataset, which indicate the existence of six subtypes in other cohorts as
well. Although some inconsistent results exist, such as
the log rank p-value was not significant in GSE71729
dataset, and the survival curves in all three datasets were
not followed the exact patterns as observed in the training dataset. We believe such inconsistency were caused
by the smaller sample size in the validation datasets
Zhao et al. BMC Cancer (2018) 18:603
a
d
Page 8 of 13
b
e
c
f
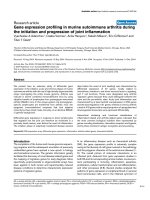
Fig. 3 Functional annotation of PDAC subtypes. a Heatmap showing six subtypes of PDAC in training dataset using the 160 subtype specific genes,
which reveals distinct gene expression patterns between subtypes. b Heatmap also showing six subtypes of PDAC in merged validation dataset using
the 160 subtype specific genes, with similar gene expression patterns (subtype specific genes are highly expressed in the corresponded subtype) as
observed in the training dataset. c GSEA analysis reveals distinct enriched gene sets between subtypes. In the heatmap, rows are defined by the
selected 60 gene sets, and columns by consensus scores for each subtype. Subtype enriched gene sets are highlighted by different color,
L1 (light red), L2 (light brown), L3 (light blue), L4 (light orange), L5 (light purple) and L6 (light green). d-f Heatmaps showing six subtypes of PDAC in
three independent validation datasets (GSE71729, Bailey and Collisson) using the 160 subtype specific genes, with similar gene expression patterns
(subtype specific genes are highly expressed in the corresponded subtype) as observed in the training dataset
(145 PDAC in GSE71729, 71 PDAC in Bailey and 27
PDAC in Collisson set), as compared with a larger cohort
size in the training dataset (796 PDAC). The corresponding sample labels in these three datasets were downloaded
from the published papers, contingency tables were subsequently built and visualized by heatmaps (Fig. 5a-d). L1
and L6 were much similar to the GSE71729’s classical subtype. L2 was close to the GSE71729’s basal subtype. L4
was resemble to the GSE71729’s normal subtype. L6, L1
and L2 were similar to the GSE71729’s activated subtype.
In the Bailey dataset, L6 was similar to the ADEX subtype.
L4 and L1 were close to the immunogenic subtype. L2
was resemble to the squamous subtype, and L3 was
similar to the pancreatic progenitor subtype. Lastly,
L1 and L3 were similar to the Collison’s classical
subtype. L6 was close to the Collison’s exocrine-like
subtype. L2 was related to the Collison’s quasi-mesenchymal subtype. All these similarities corresponded
well with the molecular and clinical characteristics of the
six subtypes identified in our study, which confirmed
the correctness of the characteristics we found on
these six subtypes.
Discussion
Heterogeneity makes a cancer not just a single disease
and this poses a significant challenge to the treatment of
cancer patients. With the advent of genome-wide molecular profiling of cancers, especially the advancements
in gene expression profiling technologies, researchers
can depict genetic changes to better understand the heterogeneity of cancers. Compared with traditional classification of cancers, gene expression based classification
can be used to classify cancers into subgroups with distinct molecular characteristics and clinical implications.
Gene expression based classification of cancer was first
proposed by Golub et al. [12]. The expression pattern of
the 50 most informative genes was measured, and
self-organizing maps (SOMs) clustering method was applied [53] to classify 38 leukemia patients into two prognostic groups without previous knowledge of these
classes. This demonstrated the fidelity of cancer classification based solely on gene expression patterns [12]. In
our study, we applied NMF to perform gene expression
based classification of PDAC. We identified six molecular and clinical distinct subtypes, which not only proved
Zhao et al. BMC Cancer (2018) 18:603
Page 9 of 13
a
c
b
d
e
Fig. 4 Clinical characterization of PDAC subtypes. a Kaplan-Meier survival curve comparing survival of L1 (red), L2 (brown), L3 (blue), L4 (orange),
L5 (purple) and L6 (green) patients in the training dataset. Survival difference was tested using the log-rank test. P-values of less than 0.05 were
considered statistically significant. b Kaplan-Meier survival curve in the merged validation dataset. c-e Kaplan-Meier survival curves in GSE71729,
Bailey and Collisson datasets
that PDAC is a highly heterogeneous disease, but also
demonstrated that gene expression based classification
of cancer is molecular and clinical significant.
The identification of cancer subtypes can be difficult
due to the lack of tumor samples available for study.
The majority of PDAC patients (~ 80%) were first diagnosed with advanced tumor stages and were not suitable
for resection. Some studies have overcome this problem
by combining different sources of samples into their
studies to increase the sample size [18, 54, 55]. Concatenating different datasets into a single dataset can be
both significant and challenging. On one hand, integrating samples from various of independent studies can increase the statistical power and robustness. On the other
hand, there exist batch effects or called non-biological
differences between these datasets. Luckily, methods like
Empirical Bayes (EB) [56], Surrogate Variable Analysis
(SVA) [57] or Distance Weighted Discrimination (DWD)
[58] can be used to remove such batch effects. For example, TCGA’s glioblastoma (GBM) subtyping study [59]
integrated gene expression data from 200 GBM assayed
on three platforms (Affymetrix HuEx array, Affymetrix
U133A array and Agilent 244 K array) into a single dataset. Factor analysis and consensus hierarchical clustering
[60] were subsequently performed for feature selection
and cluster identification, respectively. The above work
also used an independent dataset which contains 260
GBMs from four previously published datasets as
validation dataset, and subtypes were predicted using
840 gene expression profiles and ClaNC (a nearest
centroid-based classifier) [61]. In a recent publication of
diffuse glioma subtyping study from TCGA [62], the authors used ComBat batch effect removal method [45] to
combine multi-platform and multi-tumor mRNA expression data.
Using different patient cohorts, gene expression platforms and clustering methods can produce totally different classification results. For example, epithelial ovarian
cancer (EOC) has been classified into 4 to 6 subtypes
[63–65], colorectal cancer (CRC) 3 to 6 subtypes [66],
and PDAC 2 to 4 subtypes were identified by different
research groups [18–23]. Thus, integrating multiple patient cohorts to reduce the racial/ethnic and platforms
differences, together with a unified clustering method
for classification is necessary and important. In our
study, in order to build a generalizable classification
model for PDAC, we combined multiple PDAC gene expression datasets, and adjusted the introduced batch effect using ComBat. Our study involves more than 1200
PDAC patients, therefore, the statistical power was
Zhao et al. BMC Cancer (2018) 18:603
Page 10 of 13
a
b
c
d
Fig. 5 Cross comparison of identified subtypes with published results. We used our classifier and three published classifiers to classify PDAC patients,
respectively, which produced two-dimensional matrices with rows correspond to our classification results and columns correspond to other
classification results. a Contingency heatmap of GSE71729 dataset. Numbers in the heatmap represent patient numbers. Row labels: our
classifier’s results, and column labels: GSE71729 stroma classifier’s results. b Contingency heatmap of GSE71729 dataset. Numbers in the
heatmap represent patient numbers. Row labels: our classifier’s results, and column labels: GSE71729 tumor classifier’s results. c Contingency heatmap
of Bailey dataset. Numbers in the heatmap represent patient numbers. Row labels: our classifier’s results, and column labels: Bailey classifier’s results. d
Contingency heatmap of Collisson dataset. Numbers in the heatmap represent patient numbers. Row labels: our classifier’s results, and column labels:
Collisson classifier’s classification results
significantly increased. We have several advantages compared with previous studies [18–23], such as we identified novel subtypes in PDAC, we used NMF biclustering
method to extract features which are more subtype specific, and finally we built a deep learning-based classification system for PDAC which can be used to classify
new patients.
The expression profiling of the 160 genes identified
from our study can stratify PDAC patients into six subtypes. And each subtype is characterized by the expression of a subset of genes which sharing similar biological
functions, respectively. For example, L1 and L6 subtypes
have enriched with metabolism-related genes; L2 and L3
have enriched with epithelium-associated and ECM-related genes, respectively; immune response genes in L4,
and neuroendocrine related genes in L5. These specific
expression profiles can be used to predict the clinical
outcomes for each subtype, such as epithelium and cell
proliferation gene profiles in L2 are related with poor
prognosis; metabolism and ECM profiles in L1, L6 and
L3 are associated with intermediate survival; and immune and neuroendocrine-associated profiles in L4 and
Zhao et al. BMC Cancer (2018) 18:603
L5 are correlated with relatively good clinical outcomes.
The subtyping results from our study can also be interpreted at the cellular level. Low tumor cellularity and
the presence of abundant stroma intermixed with normal cells are the common features of PDAC [20, 24]. Although microdissection can be used to enrich tumor
cells, non-tumor components still account for a significant proportion in PDAC tissue biopsies. For example,
stroma comprises on average 48% of Moffitt et al. [20]
primary tumor samples with a standard deviation of
30%; and in the TCGA’s samples [24], the tumor purity
ranged from 0 to 53% (median 18%). Current tissue-level
expression profiling technologies process thousands of
tumor and non-tumor cells at the same time, so differences
or heterogeneity between patients may also result from
changes in the proportions of cell types in samples. If so,
then what machine learning models learned from bulk data
is the cell-type proportions among samples, which can be
benefit from a large group of patient’s data. Perhaps
cell-type proportions are really informative, which have important implications in the treatment strategies for cancer
patients. In our study, epithelial cells concentration in
tumor-specific subtypes (L1, L2 and L6) may greater than
the stroma-specific subtypes (L3, L4 and L5), which may
suggest that L3, L4 and L5 should be treated differently
from L1, L2 and L6. For instance, malignant epithelial cells
in L2 may account for the largest proportion, thus more intensive treatments should be considered for L2 patients. L1
and L6, two metabolism-related subtypes may be treated by
some metabolic drugs [67]. Furthermore, collagen-targeted
therapies for L2, immunotherapies for L4, and endocrine
cell therapies for L5.
Conclusions
In summary, we have identified six biologically informative subtypes of PDAC, which corresponding well with
their molecular features and clinical outcomes. The 160
subtype specific biomarkers and the deep learning model
have the potential to drive personalized therapies [68]
and risk prediction [69] for the PDAC patients.
Additional files
Additional file 1: Figure S1. PCA before and after batch effect correction
for training and validation datasets via ComBat. (a) PCA on training dataset
(n = 796) prior to batch effect correction. (b) PCA on training dataset (n =
796) after batch effect correction. (c) PCA on validation dataset (n =
472) prior to batch effect correction. (b) PCA on validation dataset (n = 472)
after batch effect correction. (PDF 157 kb)
Additional file 2: Table S1. Clinical data with patient characteristics and
statistical associations of six subtypes with clinical outcome. (DOCX 17 kb)
Additional file 3: Figure S2. Heatmap of consensus matrices from 30
runs for each rank (2 to 10) on the training dataset. (PDF 12 kb)
Additional file 4: Table S2. Confusion Matrices in internal training and
validation sets. (XLS 25 kb)
Page 11 of 13
Additional file 5: Figure S3. Boxplots showing mean gene expression
patterns of some interesting biomarkers between six subtypes (L1 gene
list: ALDOB, CA2, NPC1L1 and PGC. L2 gene list: CCNB2, CDKN2A, SFN,
UBE2C, SPRR3, DHRS9 and CRABP2. L3 gene list: GREM1, MFAP5, COL12A1,
COL10A1 and COL8A1. L4 gene list: CCL, CCR7 and CD gene families. L5
gene list: PAX6, IAPP, G6PC2, ABCC8 and ZBTB16. L6 gene list: CLPS, PLA2G1B,
CEL, ALB, CPA1, CPB1, CTRL, SLC3A1, PRSS3 and ANPEP). X-axis: six subtypes,
y-axis: gene expression values. Paired t-test was used to determine whether
there were statistically significant differences in mean gene expression
between subtypes, results show that all six comparisons are significant
(p-value < 2.2e-16). (PDF 62 kb)
Additional file 6: Table S3. Significantly enriched gene sets for each
subtype. (XLS 883 kb)
Abbreviations
cpm: Counts per million; CRC: Colorectal cancer; DWD: Distance Weighted
Discrimination; EB: Empirical Bayes; ECM: Extracellular matrix; EOC: Epithelial
ovarian cancer; GBM: Glioblastoma; GEO: Gene Expression Omnibus;
GSEA: Gene set enrichment analysis; ICGC: International Cancer Genome
Consortium; MAD: Median absolute deviation; NMF: Non-negative matrix
factorization; PDAC: Pancreatic ductal adenocarcinoma; SAM: Significance
Analysis of Microarrays; SVA: Surrogate Variable Analysis; SVD: Singular
value decomposition; TCGA: The Cancer Genome Atlas; TMM: Trimmed
mean of M-values
Acknowledgements
The authors would like to thank the Reviewers for their constructive and
insightful recommendations.
Funding
This work was supported by the Hong Kong Research Grants Council
(Projects CityU 11214814 and C1007-15G) and City University of Hong Kong
(Project 7004862).
Availability of data and materials
All data used in the study can be downloaded from multiple data repositories,
including the International Cancer Genome Consortium (ICGC, www.icgc.org),
the Cancer Genome Atlas (TCGA, Gene
Expression Omnibus (GEO, and ArrayExpress
( />Authors’ contributions
LZ conceived and designed the study; carried out data processing, computational
analysis and wrote the manuscript. HYZ helped check the results. HY did
language correction, and provided the funding support for the study. All
authors read and approved the final manuscript.
Ethics approval and consent to participate
Not applicable.
Consent for publication
All authors consented for publication of the manuscript in BMC Cancer.
Competing interests
The authors declare that they have no competing interests.
Publisher’s Note
Springer Nature remains neutral with regard to jurisdictional claims in
published maps and institutional affiliations.
Received: 26 September 2017 Accepted: 22 May 2018
References
1. Siegel R, Naishadham D, Jemal A. Cancer statistics, 2013. CA Cancer J Clin.
2013;63:11–30.
2. Barugola G, Partelli S, Marcucci S, Sartori N, Capelli P, Bassi C, et al. Resectable
pancreatic cancer: who really benefits from resection? Ann Surg Oncol. 2009;
16:3316–22.
Zhao et al. BMC Cancer (2018) 18:603
3.
4.
5.
6.
7.
8.
9.
10.
11.
12.
13.
14.
15.
16.
17.
18.
19.
20.
21.
22.
23.
24.
25.
26.
27.
28.
29.
Hidalgo M. Pancreatic Cancer. N Engl J Med. 2010;362:1605–17.
Alexakis N, Halloran C, Raraty M, Ghaneh P, Sutton R, Neoptolemos JP. Current
standards of surgery for pancreatic cancer. Br J Surg. 2004;91:1410–27.
Lemke J, Schäfer D, Sander S, Henne-Bruns D, Kornmann M. Survival and
prognostic factors in pancreatic and ampullary cancer. Anticancer Res. 2014;
34:3011–20.
Blackford A, Parmigiani G, Kensler TW, Wolfgang C, Jones S, Zhang X, et al.
Genetic mutations associated with cigarette smoking in pancreatic cancer.
Cancer Res. 2009;69:3681–8.
Klein AP, Brune KA, Petersen GM, Goggins M, Tersmette AC, Offerhaus GJA,
et al. Prospective risk of pancreatic cancer in familial pancreatic cancer
kindreds. Cancer Res. 2004;64:2634–8.
Wang F, Herrington M, Larsson J, Permert J. The relationship between diabetes
and pancreatic cancer. Mol Cancer. 2003;2:4.
Guerra C, Collado M, Navas C, Schuhmacher AJ, Hernández-Porras I,
Cañamero M, et al. Pancreatitis-induced inflammation contributes to
pancreatic cancer by inhibiting oncogene-induced senescence. Cancer
Cell. 2011;19:728–39.
Marusyk A, Polyak K. Tumor heterogeneity: causes and consequences.
Biochim Biophys Acta. 2010;1805:105–17.
Biankin AV, Maitra A. Subtyping Pancreatic Cancer. Cancer Cell. 2015;28:411–3.
Golub TR, Slonim DK, Tamayo P, Huard C, Gaasenbeek M, Mesirov JP, et al.
Molecular classification of cancer: class discovery and class prediction by
gene expression monitoring. Science. 1999;286:531–7.
Zhao L, Lee VHF, Ng MK, Yan H, Bijlsma MF. Molecular subtyping of cancer:
current status and moving toward clinical applications. Briefings in
bioinformatics. 2018; />Russo G, Zegar C, Giordano A. Advantages and limitations of microarray
technology in human cancer. Oncogene. 2003;22:6497–507.
Sørlie T, Perou CM, Tibshirani R, Aas T, Geisler S, Johnsen H, et al. Gene expression
patterns of breast carcinomas distinguish tumor subclasses with clinical
implications. Proceedings of the National Academy of Sciences. National
Acad Sciences. 2001;98:10869–74.
Perou CM, Parker JS, Prat A, Ellis MJ, Bernard PS. Clinical implementation of
the intrinsic subtypes of breast cancer. Lancet Oncol. 2010;11:718–9.
Nutt CL, Mani DR, Betensky RA, Tamayo P, Cairncross JG, Ladd C, et al. Gene
expression-based classification of malignant gliomas correlates better with
survival than histological classification. Cancer Res. AACR. 2003;63:1602–7.
Collisson EA, Sadanandam A, Olson P, Gibb WJ, Truitt M, Gu S, et al. Subtypes
of pancreatic ductal adenocarcinoma and their differing responses to therapy.
Nat Med. 2011;17:500–3.
Donahue TR, Tran LM, Hill R, Li Y, Kovochich A, Calvopina JH, et al. Integrative
survival-based molecular profiling of human pancreatic cancer. Clin Cancer
Res. AACR. 2012;18:1352–63.
Moffitt RA, Marayati R, Flate EL, Volmar KE, Loeza SGH, Hoadley KA, et al.
Virtual microdissection identifies distinct tumor-and stroma-specific subtypes
of pancreatic ductal adenocarcinoma. Nat Genet. 2015;47:1168–78.
Daemen A, Peterson D, Sahu N, McCord R. Du X, Liu B, et al. Metabolite
profiling stratifies pancreatic ductal adenocarcinomas into subtypes with
distinct sensitivities to metabolic inhibitors. Proc Natl Acad Sci U S A.
2015;112:E4410–7.
Waddell N, Pajic M, Patch A-M, Chang DK, Kassahn KS, Bailey P, et al. Whole
genomes redefine the mutational landscape of pancreatic cancer. Nature.
Nature Research. 2015;518:495–501.
Bailey P, Chang DK, Nones K, Johns AL, Patch A-M, Gingras M-C, et al.
Genomic analyses identify molecular subtypes of pancreatic cancer.
Nature. 2016;531:47–52.
Cancer Genome Atlas Research Network. Electronic address: andrew_
, Cancer Genome Atlas Research Network.
Integrated Genomic Characterization of Pancreatic Ductal Adenocarcinoma.
Cancer Cell. 2017;32:185–203. e13
Jiang D, Tang C, Zhang A. Cluster analysis for gene expression data: a survey.
IEEE Trans Knowl Data Eng. IEEE. 2004;16:1370–86.
Madeira SC, Oliveira AL. Biclustering algorithms for biological data analysis: a
survey. IEEE/ACM Trans Comput Biol Bioinform. 2004;1:24–45.
Witten DM, Tibshirani RA. framework for feature selection in clustering.
J Am Stat Assoc. 2010;105:713–26.
Hartigan JA. Direct Clustering of a Data Matrix. J Am Stat Assoc. Taylor &
Francis. 1972;67:123–9.
Cheng Y, Church GM. Biclustering of expression data. Proc Int Conf Intell
Syst Mol Biol. 2000;8:93–103.
Page 12 of 13
30. Kluger Y, Basri R, Chang JT, Gerstein M. Spectral biclustering of microarray
data: coclustering genes and conditions. Genome Res. 2003;13:703–16.
31. Lee DD, Seung HS. Learning the parts of objects by non-negative matrix
factorization. Nature. 1999;401:788–91.
32. Gan X, Liew AW-C, Yan H. Discovering biclusters in gene expression data
based on high-dimensional linear geometries. BMC Bioinformatics. 2008;9:209.
33. Zhao H, Liew AW-C, Xie X, Yan H. A new geometric biclustering algorithm
based on the Hough transform for analysis of large-scale microarray data.
J Theor Biol. 2008;251:264–74.
34. Reiss DJ, Baliga NS, Bonneau R. Integrated biclustering of heterogeneous
genome-wide datasets for the inference of global regulatory networks. BMC
Bioinformatics. 2006;7:280.
35. Li G, Ma Q, Tang H, Paterson AH, Xu Y. QUBIC: A qualitative biclustering
algorithm for analyses of gene expression data. Nucleic Acids Research.
[cited 14 Jul 2017. Available from: />summary?doi=10.1.1.332.33
36. Tanay A, Sharan R, Shamir R. Biclustering algorithms: A survey. Handbook of
computational molecular biology. Chapman and Hall/CRC Boca Raton (Florida).
2005;9:122–4.
37. Kaiser S, Leisch F. A toolbox for bicluster analysis in R. 2008; Available from:
/>38. Zhao H, Yan H. Geometric Biclustering and Its Applications to Cancer Tissue
Classification Based on DNA Microarray Gene Expression Data. In: Computational
Biology. New York, NY: Springer; 2009. p. 19–53.
39. Zhao H, Wee-Chung Liew A, Z Wang D, Yan H. Biclustering Analysis for
Pattern Discovery: Current Techniques, Comparative Studies and Applications.
Curr Bioinform. 2012;7:43–55.
40. Yan H. Coclustering of Multidimensional Big Data: A Useful Tool for Genomic,
Financial, and Other Data Analysis. IEEE Systems, Man, and Cybernetics
Magazine. 2017;3:23–30.
41. Sadanandam A, Lyssiotis CA, Homicsko K, Collisson EA, Gibb WJ,
Wullschleger S, et al. A colorectal cancer classification system that
associates cellular phenotype and responses to therapy. Nat Med.
2013;19:619–25.
42. Cancer Genome Atlas Research Network. Comprehensive molecular
characterization of clear cell renal cell carcinoma. Nature. 2013;499:43–9.
43. Wan Y-W, Allen GI, Liu Z. TCGA2STAT: simple TCGA data access for integrated
statistical analysis in R. Bioinformatics. 2016;32:952–4.
44. Robinson MD, McCarthy DJ, Smyth GK. edgeR: a Bioconductor package for
differential expression analysis of digital gene expression data. Bioinformatics.
2010;26:139–40.
45. Leek JT, Johnson WE, Parker HS, Jaffe AE, Storey JD. The sva package for
removing batch effects and other unwanted variation in high-throughput
experiments. Bioinformatics. 2012;28:882–3.
46. Gaujoux R, Seoighe C. A flexible R package for nonnegative matrix factorization.
BMC Bioinformatics. 2010;11:367.
47. Rousseeuw PJ. Silhouettes: A graphical aid to the interpretation and
validation of cluster analysis. J Comput Appl Math. 1987;20:53–65.
48. Tusher VG, Tibshirani R, Chu G. Significance analysis of microarrays applied
to the ionizing radiation response. Proc Natl Acad Sci U S A. 2001;98:5116–21.
49. Candel A, Parmar V, LeDell E, Arora A. Deep Learning with H2O. H2O. ai. Inc ,
Mountain View. 2015;
50. Smyth GK. limma: Linear Models for Microarray Data. Bioinformatics and
Computational Biology Solutions Using R and Bioconductor. New York, NY:
Springer; 2005. p. 397–420.
51. Väremo L, Nielsen J, Nookaew I. Enriching the gene set analysis of genomewide data by incorporating directionality of gene expression and combining
statistical hypotheses and methods. Nucleic Acids Res. 2013;41:4378–91.
52. Subramanian A, Tamayo P, Mootha VK, Mukherjee S, Ebert BL, Gillette MA,
et al. Gene set enrichment analysis: a knowledge-based approach for
interpreting genome-wide expression profiles. Proc Natl Acad Sci U S A.
National Acad. Sciences. 2005;102:15545–50.
53. Tamayo P, Slonim D, Mesirov J, Zhu Q, Kitareewan S, Dmitrovsky E, et al.
Interpreting patterns of gene expression with self-organizing maps:
methods and application to hematopoietic differentiation. Proceedings
of the National Academy of Sciences. National Acad. Sciences. 1999;96:
2907–12.
54. Badea L, Herlea V, Dima SO, Dumitrascu T, Popescu I. Combined gene
expression analysis of whole-tissue and microdissected pancreatic ductal
adenocarcinoma identifies genes specifically overexpressed in tumor epithelia.
Hepatogastroenterology. 2008;55:2016–27.
Zhao et al. BMC Cancer (2018) 18:603
55. Haider S, Jun W, Nagano A, Desai A, Arumugam P, Dumartin L, et al. A
multi-gene signature predicts outcome in patients with pancreatic ductal
adenocarcinoma. Genome Med. 2014;6:1–23.
56. Johnson WE, Li C, Rabinovic A. Adjusting batch effects in microarray
expression data using empirical Bayes methods. Biostatistics. 2007;8:118–27.
57. Leek JT, Storey JD. Capturing heterogeneity in gene expression studies by
surrogate variable analysis. PLoS Genet. 2007;3:e161.
58. Benito M, Parker J, Du Q, Wu J, Xiang D, Perou CM, et al. Adjustment of
systematic microarray data biases. Bioinformatics. 2004;20:105–14.
59. Verhaak RGW, Hoadley KA, Purdom E, Wang V, Qi Y, Wilkerson MD, et al.
Integrated genomic analysis identifies clinically relevant subtypes of
glioblastoma characterized by abnormalities in PDGFRA, IDH1, EGFR, and
NF1. Cancer Cell. 2010;17:98–110.
60. Monti S, Tamayo P, Mesirov J, Golub T. Consensus clustering: a resamplingbased method for class discovery and visualization of gene expression
microarray data. Mach Learn. 2003;52:91–118.
61. Dabney AR. ClaNC: point-and-click software for classifying microarrays to
nearest centroids. Bioinformatics. 2006;22:122–3.
62. Ceccarelli M, Barthel FP, Malta TM, Sabedot TS, Salama SR, Murray BA, et al.
Molecular Profiling Reveals Biologically Discrete Subsets and Pathways of
Progression in Diffuse Glioma. Cell. 2016;164:550–63.
63. Tothill RW, Tinker AV, George J, Brown R, Fox SB, Lade S, et al. Novel molecular
subtypes of serous and endometrioid ovarian cancer linked to clinical
outcome. Clin Cancer Res. 2008;14:5198–208.
64. Helland Å, Anglesio MS, George J, Cowin PA, Johnstone CN, House CM, et
al. Deregulation of MYCN, LIN28B and LET7 in a molecular subtype of
aggressive high-grade serous ovarian cancers. PLoS One. 2011;6:e18064.
65. Tan TZ, Miow QH, Huang RY-J, Wong MK, Ye J, Lau JA, et al. Functional
genomics identifies five distinct molecular subtypes with clinical relevance
and pathways for growth control in epithelial ovarian cancer. EMBO Mol
Med. 2013;5:1051–66.
66. Guinney J, Dienstmann R, Wang X, de Reyniès A, Schlicker A, Soneson C, et
al. The consensus molecular subtypes of colorectal cancer. Nat Med. 2015;
21:1350–6.
67. Galluzzi L, Kepp O, Heiden MGV, Kroemer G. Metabolic targets for cancer
therapy. Nat Rev Drug Discov. Nature Publishing Group, a division of
Macmillan Publishers Limited. All Rights Reserved. 2013;12:829.
68. Masuda H, Baggerly KA, Wang Y, Zhang Y, Gonzalez-Angulo AM, MericBernstam F, et al. Differential response to neoadjuvant chemotherapy
among 7 triple-negative breast cancer molecular subtypes. Clin Cancer
Res. 2013;19:5533–40.
69. Parker JS, Mullins M, Cheang MCU, Leung S, Voduc D, Vickery T, et al. Supervised
risk predictor of breast cancer based on intrinsic subtypes. J Clin Oncol. 2009;27:
1160–7.
Page 13 of 13