The preoperative neutrophil to lymphocyte ratio is a superior indicator of prognosis compared with other inflammatory biomarkers in resectable colorectal cancer
Bạn đang xem bản rút gọn của tài liệu. Xem và tải ngay bản đầy đủ của tài liệu tại đây (854.32 KB, 8 trang )
Song et al. BMC Cancer (2017) 17:744
DOI 10.1186/s12885-017-3752-0
RESEARCH ARTICLE
Open Access
The preoperative neutrophil to lymphocyte
ratio is a superior indicator of prognosis
compared with other inflammatory
biomarkers in resectable colorectal cancer
Yongxi Song1, Yuchong Yang1, Peng Gao1, Xiaowan Chen1, Dehao Yu1, Yingying Xu2, Junhua Zhao1
and Zhenning Wang1*
Abstract
Background: Growing evidence has indicated that some inflammatory markers, including lymphocyte to monocyte
ratio (LMR), neutrophil to lymphocyte ratio (NLR), platelet to lymphocyte ratio (PLR), and prognostic nutritional
index (PNI), can be used as indicators in the prognosis of colorectal cancer (CRC). However, there is controversy
concerning what is the best predictor of prognosis in CRC.
Methods: A cohort of 1744 CRC patients in our institution was analyzed retrospectively. Harrell’s concordance index
(c-index) and Bayesian information criterion (BIC) were used to determine the optimal cut-off values of
inflammatory markers and compare their predictive capacity. The association of inflammatory markers with overall
survival (OS) and cancer-specific survival (CSS) was analyzed using Kaplan-Meier methods with log-rank test,
followed by multivariate Cox proportional hazards model.
Results: The multivariate analysis indicated that among these inflammatory markers, NLR (< 2.0 vs. ≥ 2.0) was the
only independent prognostic factor for poor OS [hazard ratio (HR) = 0.758, 95% confidence intervals (CI) = 0.598–0.
960, P = 0.021)] and CSS (HR = 0.738, 95% CI = 0.573–0.950, P = 0.018). Among these inflammatory markers, the cindex and BIC value for NLR were maximum and minimum for OS, respectively. In addition, the c-index was higher
and the BIC value was smaller in TNM staging combined with NLR compared with the values obtained in TNM
staging alone.
Conclusion: NLR is a superior indicator of prognosis compared with LMR, PLR, and PNI in CRC patients, and NLR
may serve as an additional indicator based on the current tumor staging system.
Keywords: Colorectal neoplasms, Lymphocyte to monocyte ratio, Neutrophil to lymphocyte ratio, Platelet to
lymphocyte ratio, Prognosis, Prognostic nutritional index, TNM staging
Background
Colorectal cancer (CRC) is the second most commonly
diagnosed cancer in women and third in men, with an estimated occurrence of 1.4 million cases and 693,900 deaths
in 2012 [1]. At present, TNM staging has been the most
commonly used method to predict the prognosis of CRC.
* Correspondence:
1
Department of Surgical Oncology and General Surgery, The First Hospital of
China Medical University, 155 North Nanjing Street, Heping District,
Shenyang City 110001, People’s Republic of China
Full list of author information is available at the end of the article
However, prognostic heterogeneity still exists in patients
with the same TNM stage [2]. Therefore, novel biomarkers
are necessary to improve the current tumor staging system
and accurately predict the prognosis of CRC.
Recently, growing evidence has indicated that the progression and prognosis of cancer are affected not only
by tumor features but also by the inflammatory response
of the host [3, 4]. The inflammatory response involves
neutrophils, lymphocytes, monocyte, platelets, and
acute-phase proteins, including albumin in peripheral
blood. The combination of some parameters, including
© The Author(s). 2017 Open Access This article is distributed under the terms of the Creative Commons Attribution 4.0
International License ( which permits unrestricted use, distribution, and
reproduction in any medium, provided you give appropriate credit to the original author(s) and the source, provide a link to
the Creative Commons license, and indicate if changes were made. The Creative Commons Public Domain Dedication waiver
( applies to the data made available in this article, unless otherwise stated.
Song et al. BMC Cancer (2017) 17:744
lymphocyte to monocyte ratio (LMR), neutrophil to
lymphocyte ratio (NLR), platelet to lymphocyte ratio
(PLR), and prognostic nutritional index (PNI), has been
used in the prognosis of cancers [5–8], including CRC
[9–12]. However, there is controversy about which is the
best predictor of prognosis of CRC among these inflammatory biomarkers. On the other hand, to the best of
our knowledge, no previous studies have focused on the
use of inflammatory biomarkers as a complementary
index on the basis of the current TNM staging system.
In addition, there are controversies on the optimal cutoff values of these inflammatory biomarkers for predicting prognosis.
In this study, we explored the prognostic value of
LMR, NLR, PLR, and PNI in CRC, and compared their
ability to predict prognosis. Moreover, we also investigated the optimal cut-off values of these inflammatory
biomarkers for predicting prognosis.
Page 2 of 8
multivariate analyses using the Cox proportional hazards
model with an enter method.
We assessed the predictive capacity of different categories by measuring discrimination, which is the ability
to distinguish between high-risk and low-risk patients.
We quantified discrimination and determined the optimal cut-off values for inflammatory biomarkers using
Harrell’s concordance index (c-index) [14, 15] and the
Bayesian information criterion (BIC) [16]. The maximum c-index value of 1.0 indicates a perfect discrimination. A higher c-index or a smaller BIC value indicated
a more desirable model for predicting the outcome.
Statistical analysis was performed using STATA software version 12.0 (Stata Corporation, College Station,
TX, USA) and SPSS software version 20.0 (SPSS, Chicago, IL, USA). A p-value of less than 0.05 from a twotailed test was considered statistically significant.
Results
Methods
Patient cohort
We retrospectively analyzed a cohort of CRC patients
who underwent curative resection at the Department of
Surgical Oncology at the First Hospital of China Medical
University (CMU-SO) between December 2003 and
January 2013. Patients without detailed preoperative laboratory data, those who underwent neoadjuvant treatment, and those who used anti-inflammatory
medications before surgery were excluded. Finally, 1744
patients were enrolled in the study. Follow-up was completed for all patients until October 2015. The median
follow-up was 45.5 months (range of 4–136). Clinical
data, including age, sex, clinicopathological features, and
preoperative laboratory data, were obtained from the
medical records of the patients. The albumin level was
obtained using the hepatic function test, and neutrophil,
lymphocyte, monocyte, and platelet counts were collected using a routine blood test. PNI was calculated as
10 × albumin level (g/dl) + 0.005 × total lymphocyte
count (per mm3) [13]. The CRC stage was classified according to the seventh edition of the AJCC/UICC TNM
classification system.
Statistical analysis
Categorical variables were presented as absolute values
and percentages and were compared using the chisquare test. Survival rates, including overall survival
(OS) and cancer-specific survival (CSS), were analyzed
using the Kaplan-Meier method, and differences in variables were compared using log-rank tests. Univariate
analysis was used to determine the relationship between
the prognostic factors, OS, and CSS. Significant prognostic factors for OS and CSS were included in the
Optimal cut-off value of inflammatory biomarkers
The c-index method was used to determine the optimal
cut-off values of LMR, NLR, PLR, and PNI for predicting
OS. We calculated c-index values for different cut-off
values. Our results indicated that the c-index values were
maximum for LMR, NLR, PLR, and PNI values of 5.8, 2.0,
134.6, and 46.4, respectively (Table 1). We divided patients
into two groups (LMR < 5.8 and ≥ 5.8; NLR < 2.0 and ≥
2.0; PLR < 134.6 and ≥ 134.6; PNI < 46.4 and ≥ 46.4) for
further analysis. There was a minor difference between
optimal cut-off values of CSS and those of OS (Table 1) so
that the cut-off values of OS were adopted for CSS to
maintain consistency and prevent confusion.
Clinicopathological features and inflammatory biomarkers
Among the 1744 patients evaluated, the median age was
62 (range 13–86); 982 (56.3%) patients were men and
762 (43.7%) were women; 1004 (57.6%) patients were diagnosed with rectal cancer and 740 (42.4%) with colon
cancer. The characteristics of the study patients stratified
by LMR, NLR, PLR, and PNI are presented in Table 2.
The results indicated that LMR was significantly associated with sex, tumor size, tumor location, pT category,
and TNM stage (P < 0.05); NLR was significantly associated with age, sex, tumor size, tumor differentiation, pT
category, and TNM stage (P < 0.05); PLR was significantly associated with sex, tumor size, tumor location,
tumor differentiation, pT category, and TNM stage
(P < 0.05); PNI was significantly associated with age,
tumor size, tumor location, tumor differentiation, pT
category, and TNM stage (P < 0.05, Table 2).
Prognostic ability of inflammatory biomarkers
Kaplan-Meier survival analysis with log-rank tests and
univariate analysis were performed to evaluate the
Song et al. BMC Cancer (2017) 17:744
Page 3 of 8
Table 1 The five greatest c-index values of different cut-off values for LMR, NLR, PLR and PNI
Survival
OS
CSS
LMR
NLR
PLR
PNI
Cut-off
C-index
N
Cut-off
C-index
N
Cut-off
C-index
N
Cut-off
C-index
N
5.8
0.5461
1192/552
2.0
0.5637
930/814
134.6
0.5540
1015/729
46.4
0.5408
342/1402
5.3
0.5461
1072/672
2.1
0.5616
1016/728
134.5
0.5536
1014/730
46.3
0.5405
331/1413
5.2
0.5454
1041/703
2.2
0.5611
1078/666
134.4
0.5533
1012/732
45.5
0.5404
268/1476
5.4
0.5445
1097/647
1.8
0.5580
770/974
134.3
0.5531
1011/733
45.6
0.5399
283/1461
5.9
0.5444
1208/536
1.9
0.5578
857/887
130.3
0.5530
954/790
45.9
0.5396
310/1434
5.2
0.5474
1041/703
2.0
0.5648
930/814
134.6
0.5646
1015/729
46.3
0.5468
331/1413
5.8
0.5465
1192/552
2.1
0.5613
1016/728
134.5
0.5642
1014/730
45.9
0.5449
310/1434
5.3
0.5454
1072/672
2.2
0.5611
1078/666
129.4
0.5635
945/799
46.4
0.5447
342/1402
5.9
0.5453
1208/536
1.9
0.5563
857/887
129.5
0.5635
945/799
45.5
0.5444
268/1476
5.1
0.5437
998/746
1.8
0.5559
770/974
129.6
0.5635
945/799
45.6
0.5443
283/1461
Abbreviations: CSS cancer-specific survival, LMR lymphocyte to monocyte ratio, N number of patients for each group, NLR neutrophil to lymphocyte ratio, OS overall
survival, PLR platelet to lymphocyte ratio, PNI prognostic nutritional index
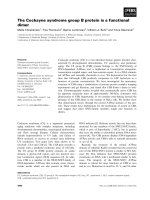
association between inflammatory biomarkers and prognosis. Our results indicated that LMR, NLR, PLR, and
PNI were significantly associated with prognosis of OS
and CSS (P < 0.05, Fig. 1, Table 3). However, Cox multivariate analysis indicated that, among the four inflammatory biomarkers, NLR (< 2.0 vs. ≥ 2.0) was the only
independent prognostic factor for poor OS (HR = 0.758,
95% CI = 0.598–0.960, P = 0.021) and CSS (HR = 0.738,
95% CI = 0.573–0.950, P = 0.018, Table 3). Moreover, we
regarded LMR, NLR, PLR, and PNI as continuous variables and evaluated the association between these variables and prognosis. The result was similar to that in
which inflammatory biomarkers were regarded as dichotomous variables (Additional file 1).
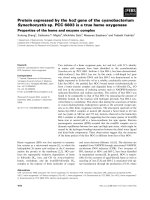
Comparison of the prognostic ability of inflammatory
biomarkers
The c-index and BIC were used to compare the prognostic ability of these four inflammatory biomarkers.
When these biomarkers were regarded as binary variables, NLR (< 2.0 vs. ≥ 2.0) had the maximum c-index
and minimum BIC for prognosis of both OS and CSS,
and when regarded as continuous variables, the NLR
presented the maximum c-index and minimum BIC for
prognosis of OS (Fig. 2, Additional file 2).
Evaluation of the prognostic capacity of TNM staging
combined with NLR
We calculated the c-index and BIC values of TNM staging combined with NLR (< 2.0 vs. ≥ 2.0) (TNM + NLR)
and of TNM staging alone for OS and CSS. The c-index
values were greater (OS: 0.7468 vs. 0.7337; CSS: 0.7650
vs. 0.7495) and the BIC values were smaller (OS:
−289.723 vs. –271.832; CSS: –299.626 vs. –283.697) in
TNM + NLR than those in TNM staging alone.
Discussion
At present, TNM staging is considered the primary predictor of prognosis. However, this predictor has its limitation because patients at the same TNM stage may
have a different prognosis. The introduction of laboratory indexes as additional factors is important for the accurate prediction of prognosis.
Recently, a growing body of evidence suggests that inflammatory biomarkers are associated with clinicopathological features and prognosis in patients with CRC.
Accordingly, our results showed that LMR, NLR, PLR,
PNI were associated with tumor size, tumor depth, and
TNM stage. The results of Kaplan–Meier survival analysis
with log-rank tests indicated that these inflammatory biomarkers were significantly associated with prognosis in
CRC. However, the actual mechanisms of the association
between these inflammatory biomarkers and prognosis in
CRC are unclear. There are several potential explanations.
First, neutrophils, monocytes, and platelets have been
reported to promote tumor development via different
mechanisms [17–19], whereas lymphocytes are essential
for the elimination of cancer cells [20], and serum albumin is the main plasma protein used to indicate the nutritional status of the host; this may partly explain why
elevated NLR, elevated PLR, low LMR, and low PNI were
associated with poor prognosis in CRC. Second, elevated
NLR and PLR together with low LMR and PNI were significantly associated with advanced tumor features, such
as larger tumor size, deeper tumor depth, and advanced
TNM stages. Therefore, these variables were associated
with the extent of tumor progression, and consequently,
affect the survival of CRC patients. Whether they are the
causes or consequences of cancer progression remains
unknown. Third, the presence of a systemic inflammatory
response and/or the poor nutritional status may influence
tolerance and compliance with active treatment in cancer
Song et al. BMC Cancer (2017) 17:744
Page 4 of 8
Table 2 Associations of clinicopathological features with LMR, NLR, PLR and PNI in colorectal cancer
Variable
LMR
< 5.8
NLR
≥ 5.8
Age(y)
P
< 2.0
PLR
≥ 2.0
P
0.086
< 134.6
PNI
≥ 134.6
0.001
P
< 46.4
≥ 46.4
0.556
< 0.001
≥ 60
700(58.7)
300(54.3)
499(53.7) 501(61.5)
588(57.9) 421(56.5)
233(68.1) 767(54.7)
< 60
492(41.3)
252(45.7)
431(46.3) 313(38.5)
427(42.1) 317(43.5)
109(31.9) 635(45.3)
Male
738(61.9)
244(44.2)
Female
454(38.1)
308(55.8)
Gender
< 0.001
Tumor size (cm)
< 0.001
481(51.7) 501(61.5)
449(48.3) 313(38.5)
< 0.001
< 0.001
404(39.8) 371(50.9)
0.543
198(57.9) 784(55.9)
611(60.2) 358(49.1)
< 0.001
144(42.1) 618(44.1)
< 0.001
< 0.001
≥ 4.6
637(53.4)
238(43.1)
395(42.5) 480(59.0)
438(43.2) 437(59.9)
236(69.0) 639(45.6)
< 4.6
555(46.6)
314(56.9)
535(57.5) 334(41.0)
577(56.8) 292(40.1)
106(31.0) 763(54.4)
Colon
544(45.6)
196(35.5)
Rectum
648(54.4)
356(64.5)
Tumor location
< 0.001
Differentiation
Well - moderate
0.073
376(40.4) 364(44.7)
1086(91.1) 517(93.7)
Poor - undifferentiated 106(8.9)
35(6.3)
pT category
< 0.001
342(33.7) 398(54.6)
554(59.6) 450(55.3)
0.069
< 0.001
193(56.4) 547(39.0)
673(66.3) 331(45.4)
0.001
149(43.6) 855(61.0)
0.001
0.001
873(93.9) 730(89.7)
952(93.8) 63(6.2)
299(87.4) 1304(93.0)
57(6.1)
84(10.3)
651(89.3) 78(10.7)
43(12.6)
98(7.0)
22(2.7)
3(0.9)
49(3.5)
268(19.1)
0.006
0.019
0.003
30(2.5)
22(4.0)
30(3.2)
T2
188(15.8)
119(21.6)
187(20.1) 120(14.7)
206(20.3) 101(13.9)
39(11.4)
T3
470(39.4)
197(35.7)
350(37.6) 317(38.9)
378(37.2) 289(39.6)
157(45.9) 510(36.4)
T4
504(42.3)
214(38.8)
363(39.0) 355(43.6)
0.497
18(2.5)
< 0.001
T1
pN category
34(3.3)
397(39.1) 321(44.0)
0.558
143(41.8) 575(41.0)
0.184
0.412
pN0
689(57.8)
335(60.7)
557(59.9) 467(57.4)
611(60.2) 413(56.7)
194(56.7) 830(59.2)
pN1
365(30.6)
160(29.0)
273(29.4) 252(31.0)
301(29.7) 224(30.7)
103(30.1) 422(30.1)
pN2
138(11.6)
57(10.3)
Distant metastasis
100(10.8) 95(11.7)
0.130
103(10.1) 92(12.6)
0.947
45(13.2)
150(10.7)
0.577
0.337
Negative
1161(97.4) 544(98.6)
909(97.7) 796(97.8)
994(97.9) 711(97.5)
332(97.1) 1373(97.9)
Positive
31(2.6)
8(1.4)
21(2.3)
21(2.1)
10(2.9)
29(2.1)
I
176(14.8)
112(20.3)
177(19.0) 111(13.6)
193(19.0) 95(13.0)
32(9.4)
256(18.3)
II
505(42.4)
221(40.0)
376(40.4) 350(43.0)
415(40.9) 311(42.7)
158(46.2) 568(40.5)
III
480(40.3)
211(38.2)
356(38.3) 335(41.2)
386(38.0) 305(41.8)
142(41.5) 549(39.2)
IV
31(2.6)
8(1.4)
21(2.3)
21(2.1)
10(2.9)
TNM stage
18(2.2)
0.018
18(2.5)
0.026
18(2.2)
0.010
18(2.5)
P
0.001
29(2.1)
Abbreviations: LMR lymphocyte to monocyte ratio, NLR neutrophil to lymphocyte ratio, PLR platelet to lymphocyte ratio, PNI prognostic nutritional index
patients [21]. However, we did not explore the association
between inflammatory biomarkers and active treatment in
this study owing to the lack of data; therefore, future studies should evaluate this association.
Controversy still exists concerning the optimal cut-off
values of these inflammatory biomarkers for predicting
prognosis. In fact, different studies used different cut-off
values and different methods to calculate them. Until
now, there is no standard method for establishing a universal threshold suitable for every cohort of patients.
Some studies used receiver operating characteristic
curve analysis (ROC) to dichotomize the inflammatory
biomarkers [22–24]. We also used ROC curve analyses
to calculate the cut-off values of these four inflammatory
biomarkers. Using the 5-year overall survival as an endpoint, the area under the ROC curve for NLR was maximum (See Additional file 3). These results were similar
to our results and also indicated NLR had better predictive ability for prognosis compared with other inflammatory biomarkers (See Additional file 3). The results of
ROC curve analyses showed that the Youden index was
maximum for LMR, NLR, PLR, and PNI values of 5.2,
Song et al. BMC Cancer (2017) 17:744
Page 5 of 8
Fig. 1 Kaplan-Meier curves of overall survival (OS) and cancer-specific survival (CSS) in CRC patients based on inflammatory biomarkers: a LMR; b
NLR; c PLR; d PNI
2.0, 134.6, and 50.8, respectively. We can observe that
the cut-off values of LMR and PNI in ROC curve analyses were different from those in c-index analyses. Pencina et al. reported that c-index introduced by Harrell
was a natural extension of the ROC curve area to survival analysis, and the method of c-index was calculated
based on the survival time and survival state while ROC
curve analysis only based on survival state [25]. Therefore, c-index was used to determine cut-off values, in a
cohort of 1744 CRC patients in our study. However, the
cut-off values identified in this cohort may not apply to
other independent cohorts. Therefore, these results need
to be confirmed by other studies.
To date, there is no agreement as to which inflammatory biomarkers are the most clinically useful and the best
predictors of prognosis in CRC. Some studies showed that
NLR was superior to other inflammatory biomarkers as a
predictor of prognosis in CRC [23, 26]. Chan et al. [10]
reported that LMR was superior to NLR and PLR as a predictor of overall survival; Kwon et al. reported that PLR
was a better prognostic serum biomarker than NLR [27],
and Park et al. [24] reported that PNI was superior to
NLR as a predictor of prognosis in CRC. Our results indicated that either as dichotomous variables or continuous
variables, NLR was the only independent prognostic factor
for poor OS and CSS among these four inflammatory biomarkers. In addition, we used the c-index and BIC to
compare the prognostic capacity of these inflammatory
biomarkers, and our results indicated that either as
dichotomous variables or continuous variables, NLR had
the maximum c-index value and minimum BIC value for
OS. These results confirmed that NLR was superior to the
other inflammatory biomarkers as a biomarker for predicting prognosis of CRC.
The reason why NLR was superior to other inflammatory biomarkers as a prognostic biomarker in CRC
remains unclear. Neutrophils are a major component of
leukocyte and can induce several procancer factors,
including neutrophil elastase, matrix metalloprotein 9
(MMP9), and vascular endothelial growth factor (VEGF),
and therefore are involved in the remodeling of the extracellular matrix and promotion of angiogenesis and tumor
development [19, 28, 29]. While lymphocytes are vital
components of the host immune system, and lymphocyte
infiltration into the tumor is regarded as an anticancer
immunologic reaction associated with improved survival
[20, 30]. Therefore, NLR may represent a balance between
procancer inflammatory reaction and anticancer immune
function [9]. We hypothesize that neutrophils and lymphocytes may play more important roles in cancer progression and prognosis than monocytes, platelets, and
albumin, which may partly explain our results, although
these results need to be confirmed.
Moreover, we first explored the use of NLR as an additional index on the basis of the current TNM staging
system. We calculated the c-index and BIC values of
TNM + NLR and TNM staging alone. The results showed
that TNM + NLR had a greater c-index and a smaller BIC
Song et al. BMC Cancer (2017) 17:744
Page 6 of 8
Table 3 Univariate and multivariate survival analyses of OS and CSS in patients with colorectal cancer
Variable
Overall survival
Cancer-Specific Survival
Univariate
HR (95% CI)
Age (y)
Multivariate
P
HR (95% CI)
0.016
1
1
<60
0.777 (0.632–0.955)
0.737 (0.597–0.910)
0.011
Male
1
Female
0.766 (0.624–0.940)
Tumor Size (cm)
P
HR (95% CI)
0.005
≥60
Gender
Univariate
0.873 (0.702–1.086)
0.003
0.084
1
1
0.730 (0.591–0.902)
0.825 (0.663–1.026)
0.354
1
1
<4.6
0.917 (0.751–1.120)
0.904 (0.729–1.120)
0.732
1
Rectum
1.036 (0.846–1.268)
Differentiation
0.876
1
1.017 (0.819–1.264)
<0.001
0.001
<0.001
0.001
Well - moderate
1
1
1
1
Poor - undifferentiated
2.438 (1.836–3.237)
1.647 (1.233–2.198)
2.621 (1.950–3.524)
1.644 (1.216–2.221)
pT category
T1
<0.001
<0.001
1
1
<0.001
1
<0.001
1
T2
1.596 (0.486–5.239)
1.390 (0.423–4.573)
0.996 (0.293–3.382)
0.825 (0.243–2.808)
T3
4.362 (1.393–13.665)
2.132 (0.677–6.715)
3.725 (1.187–11.691)
1.689 (0.534–5.338)
T4
6.353 (2.029–19.890)
pN category
2.910 (0.924–9.165)
<0.001
5.670 (1.809–17.765)
<0.001
2.416 (0.766–7.627)
<0.001
<0.001
pN0
1
1
1
1
pN1
4.779 (3.702–6.170)
4.132 (3.189–5.354)
5.678 (4.249–7.587)
4.856 (3.622–6.512)
pN2
11.353 (8.583–15.016)
Distant metastasis
10.215 (7.648–13.643)
<0.001
11.760 (8.565–16.147)
14.388 (10.556–19.610)
0.001
<0.001
0.001
Negative
1
1
1
1
Positive
3.690 (2.349–5.797)
2.226 (1.407–3.524)
3.974 (2.497–6.324)
2.200 (1.375–3.522)
TNM stage
I
<0.001
<0.001
1
1
II
2.398 (1.327–4.332)
4.854 (1.944–12.118)
III
12.092 (6.931–21.097)
27.933 (11.524–67.709)
IV
20.970 (10.408–42.248)
LMR
50.019 (18.648–134.163)
<0.001
0.698
0.001
0.663
≥5.8
1
1
1
1
<5.8
1.565 (1.239–1.976)
1.054 (0.809–1.373)
1.541 (1.201–1.977)
1.064 (0.804–1.409)
NLR
<0.001
≥2.0
1
<2.0
0.621 (0.508–0.760)
PLR
0.021
1
<0.001
1
0.758 (0.598–0.960)
0.001
0.620 (0.499–0.770)
0.239
0.018
1
0.738 (0.573–0.950)
<0.001
0.160
≥134.6
1
1
1
1
<134.6
0.710 (0.582–0.867)
0.873 (0.697–1.094)
0.652 (0.526–0.807)
0.841 (0.661–1.070)
PNI
P
1
≥4.6
Colon
HR (95% CI)
0.222
0.397
Tumor location
Multivariate
P
<0.001
0.084
<0.001
0.065
≥46.4
1
1
1
1
<46.4
1.503 (1.199–1.884)
1.238 (0.972–1.576)
1.552 (1.220–1.975)
1.272 (0.985–1.643)
Abbreviations: CI confidence interval, HR hazard ratio, LMR lymphocyte to monocyte ratio, NLR neutrophil to lymphocyte ratio, PLR platelet to lymphocyte ratio, PNI
prognostic nutritional index
Song et al. BMC Cancer (2017) 17:744
Page 7 of 8
Additional files
Additional file 1: Univariate and multivariate survival analyses of OS and
CSS in patients with colorectal cancer. This table presents the
comprehensive results of univariate and multivariate survival analyses of
OS and CSS in patients with colorectal cancer. (DOCX 22 kb)
Additional file 2: Comparison of the c-index and BIC values for LMR,
NLR, PLR and PNI. This table lists the c-index and BIC values for LMR, NLR,
PLR and PNI to make a comparison of these four inflammatory biomarkers. (DOCX 18 kb)
Additional file 3: Receiver operating curve analysis of these four
inflammatory biomarkers for 5-year overall survival. This figure shows the
ROC curves of LMR, NLR, PLR and PNI along with the area under the ROC
curve and p-values. (TIFF 953 kb)
Abbreviations
BIC: Bayesian information criterion; CI: Confidence intervals; c-index: Harrell’s
concordance index; CMU-SO: The Department of Surgical Oncology at the
First Hospital of China Medical University; CRC: Colorectal cancer;
CSS: Cancer-specific survival; HR: Hazard ratio; LMR: Lymphocyte to
monocyte ratio; MMP9: Matrix metalloprotein 9; NLR: Neutrophil to
lymphocyte ratio; OS: Overall survival; PLR: Platelet to lymphocyte ratio;
PNI: Prognostic nutritional index; ROC: Receiver operating characteristic curve
analysis; VEGF: Vascular endothelial growth factor
Acknowledgements
We thank the department of Surgical Oncology of First Hospital of China
Medical University for technical assistance.
Funding
This work was supported by National Science Foundation of China
(81,372,549, 81,372,550), the Special Prophase Program for National Key Basic
Research Program of China (No.2014CB560712) and Clinical Capability
Construction Project for Liaoning Provincial Hospitals (LNCCC-A01–2014). The
funding bodies have no roles in the design of the study and collection,
analysis, and interpretation of data and in writing the manuscript.
Availability of data and materials
The data that support the findings of this study are available from CMU-SO
but restrictions apply to the availability of these data, which were used under
license for the current study, and so are not publicly available. Data are however available from the authors upon reasonable request and with permission of CMU-SO.
Fig. 2 Comparison of the c-index and BIC values for inflammatory
biomarkers on overall survival (OS) and cancer-specific survival (CSS):
a c-index value; b BIC values
value than TNM staging alone, indicating that TNM + NLR
is a better predictive model of prognosis than TNM
staging alone. Therefore, NLR may serve as a supplemental index in the current TNM staging system and may
increase the prognostic accuracy in CRC.
The present study has several limitations. First, our
study was retrospective and uncontrolled. Second, we
did not explore the association between prognosis and
other inflammatory biomarkers, such as acute-phase
proteins, in CRC, owing to the lack of relevant data.
Conclusion
The preoperative NLR was superior to LMR, PLR, and
PNI as a predictor of prognosis, and may serve as an additional index in the current TNM staging system in CRC.
Authors’ contributions
YXS, YCY, and ZNW were responsible for conception and design of the
study. YXS, PG and XWC collected clinical cases, did data extraction,
statistical analyses and the writing of report. YXS, YCY and DHY participated
in data extraction and provided statistical expertise. JHZ and YYX provided
clinical expertise and interpretation of data. The report was drafted, revised,
and approved by all authors.
Ethics approval and consent to participate
This study was approved by the Research Ethics Committee of China Medical
University. Written informed consent was obtained from all patients. For the
minors, written informed consent was obtained by the parents or legal
guardians.
Consent for publication
Not applicable.
Competing interests
The authors declare that they have no conflict of interest.
Publisher’s Note
Springer Nature remains neutral with regard to jurisdictional claims in
published maps and institutional affiliations.
Song et al. BMC Cancer (2017) 17:744
Author details
1
Department of Surgical Oncology and General Surgery, The First Hospital of
China Medical University, 155 North Nanjing Street, Heping District,
Shenyang City 110001, People’s Republic of China. 2Department of Breast
Surgery, The First Hospital of China Medical University, 155 North Nanjing
Street, Heping District, Shenyang City 110001, People’s Republic of China.
Received: 7 August 2016 Accepted: 1 November 2017
References
1. Torre LA, Bray F, Siegel RL, Ferlay J, Lortet-Tieulent J, Jemal A. Global cancer
statistics, 2012. CA Cancer J Clin. 2015;65(2):87–108.
2. Hari DM, Leung AM, Lee JH, Sim MS, Vuong B, Chiu CG, Bilchik AJ. AJCC
cancer staging manual 7th edition criteria for colon cancer: do the complex
modifications improve prognostic assessment? J Am Coll Surg. 2013;217(2):
181–90.
3. Balkwill F, Mantovani A. Inflammation and cancer: back to Virchow? Lancet.
2001;357(9255):539–45.
4. Mantovani A, Allavena P, Sica A, Balkwill F. Cancer-related inflammation.
Nature. 2008;454(7203):436–44.
5. Sun K, Chen S, Xu J, Li G, He Y. The prognostic significance of the
prognostic nutritional index in cancer: a systematic review and metaanalysis. J Cancer Res Clin Oncol. 2014;140(9):1537–49.
6. Templeton AJ, Ace O, McNamara MG, Al-Mubarak M, Vera-Badillo FE,
Hermanns T, Seruga B, Ocana A, Tannock IF, Amir E. Prognostic role of
platelet to lymphocyte ratio in solid tumors: a systematic review and metaanalysis. Cancer Epidemiol Biomark Prev. 2014;23(7):1204–12.
7. Gu L, Li H, Chen L, Ma X, Li X, Gao Y, Zhang Y, Xie Y, Zhang X.
Prognostic role of lymphocyte to monocyte ratio for patients with
cancer: evidence from a systematic review and meta-analysis.
Oncotarget. 2016;7(22):31926–42.
8. Yang Y, Gao P, Song Y, Sun J, Chen X, Zhao J, Ma B, Wang Z. The
prognostic nutritional index is a predictive indicator of prognosis and
postoperative complications in gastric cancer: a meta-analysis. Eur J Surg
Oncol. 2016;42(8):1176–82.
9. Li MX, Liu XM, Zhang XF, Zhang JF, Wang WL, Zhu Y, Dong J, Cheng JW,
Liu ZW, Ma L, et al. Prognostic role of neutrophil-to-lymphocyte ratio in
colorectal cancer: a systematic review and meta-analysis. Int J Cancer. 2014;
134(10):2403–13.
10. Chan JC, Chan DL, Diakos CI, Engel A, Pavlakis N, Gill A, Clarke SJ. The
lymphocyte-to-Monocyte ratio is a superior predictor of overall survival in
comparison to established biomarkers of Resectable colorectal cancer. Ann
Surg. 2017;265(3):539–46.
11. You J, Zhu GQ, Xie L, Liu WY, Shi L, Wang OC, Huang ZH, Braddock M, Guo
GL, Zheng MH: Preoperative platelet to lymphocyte ratio is a valuable
prognostic biomarker in patients with colorectal cancer. Oncotarget 2016,
[Epub ahead of print].
12. Yang Y, Gao P, Chen X, Song Y, Shi J, Zhao J, Sun J, Xu Y, Wang Z.
Prognostic significance of preoperative prognostic nutritional index in
colorectal cancer: results from a retrospective cohort study and a metaanalysis. Oncotarget. 2016;7(36):58543–52.
13. Onodera T, Goseki N, Kosaki G. Prognostic nutritional index in
gastrointestinal surgery of malnourished cancer patients. Nihon Geka Gakkai
zasshi. 1984;85(9):1001–5.
14. Harrell FE Jr, Lee KL, Mark DB. Multivariable prognostic models: issues in
developing models, evaluating assumptions and adequacy, and measuring
and reducing errors. Stat Med. 1996;15(4):361–87.
15. Newson RB. Comparing the predictive powers of survival models using
Harrell's C or Somers' D. Stata J. 2010;10(3):339–58.
16. Volinsky CT, Raftery AE. Bayesian information criterion for censored survival
models. Biometrics. 2000;56(1):256–62.
17. Bambace NM, Holmes CE. The platelet contribution to cancer progression. J
Thromb Haemost. 2011;9(2):237–49.
18. Augier S, Ciucci T, Luci C, Carle GF, Blin-Wakkach C, Wakkach A.
Inflammatory blood monocytes contribute to tumor development and
represent a privileged target to improve host immunosurveillance. J
Immunol. 2010;185(12):7165–73.
19. Powell DR, Huttenlocher A. Neutrophils in the tumor microenvironment.
Trends Immunol. 2016;37(1):41–52.
Page 8 of 8
20. Rosenberg SA. Progress in human tumour immunology and
immunotherapy. Nature. 2001;411(6835):380–4.
21. Scott HR, McMillan DC, Forrest LM, Brown DJ, McArdle CS, Milroy R. The
systemic inflammatory response, weight loss, performance status and
survival in patients with inoperable non-small cell lung cancer. Br J Cancer.
2002;87(3):264–7.
22. Song A, Eo W, Lee S. Comparison of selected inflammation-based
prognostic markers in relapsed or refractory metastatic colorectal cancer
patients. World J Gastroenterol. 2015;21(43):12410–20.
23. Ying HQ, Deng QW, He BS, Pan YQ, Wang F, Sun HL, Chen J, Liu X, Wang
SK. The prognostic value of preoperative NLR, d-NLR, PLR and LMR for
predicting clinical outcome in surgical colorectal cancer patients. Med
Oncol. 2014;31(12):305.
24. Park BK, Park JW, Han EC, Ryoo SB, Han SW, Kim TY, Chie EK, Jeong SY, Park
KJ. Systemic inflammatory markers as prognostic factors in stage IIA
colorectal cancer. J Surg Oncol. 2016;114(2):216–21.
25. Pencina MJ, D'Agostino RB. Overall C as a measure of discrimination in
survival analysis: model specific population value and confidence interval
estimation. Stat Med. 2004;23(13):2109–23.
26. Choi WJ, Cleghorn MC, Jiang H, Jackson TD, Okrainec A, Quereshy FA.
Preoperative Neutrophil-to-lymphocyte ratio is a better prognostic serum
biomarker than platelet-to-lymphocyte ratio in patients undergoing
resection for nonmetastatic colorectal cancer. Ann Surg Oncol. 2015;
22(Suppl 3):S603–13.
27. Kwon HC, Kim SH, Oh SY, Lee S, Lee JH, Choi HJ, Park KJ, Roh MS, Kim SG,
Kim HJ, et al. Clinical significance of preoperative neutrophil-lymphocyte
versus platelet-lymphocyte ratio in patients with operable colorectal cancer.
Biomarkers. 2012;17(3):216–22.
28. Dumitru CA, Lang S, Brandau S. Modulation of neutrophil granulocytes in
the tumor microenvironment: mechanisms and consequences for tumor
progression. Semin Cancer Biol. 2013;23(3):141–8.
29. He S, Lamers GE, Beenakker JW, Cui C, Ghotra VP, Danen EH, Meijer AH,
Spaink HP, Snaar-Jagalska BE. Neutrophil-mediated experimental metastasis
is enhanced by VEGFR inhibition in a zebrafish xenograft model. J Pathol.
2012;227(4):431–45.
30. Rabinowich H, Cohen R, Bruderman I, Steiner Z, Klajman A. Functional
analysis of mononuclear cells infiltrating into tumors: lysis of autologous
human tumor cells by cultured infiltrating lymphocytes. Cancer Res. 1987;
47(1):173–7.
Submit your next manuscript to BioMed Central
and we will help you at every step:
• We accept pre-submission inquiries
• Our selector tool helps you to find the most relevant journal
• We provide round the clock customer support
• Convenient online submission
• Thorough peer review
• Inclusion in PubMed and all major indexing services
• Maximum visibility for your research
Submit your manuscript at
www.biomedcentral.com/submit