Gene expression signatures of neuroendocrine prostate cancer and primary small cell prostatic carcinoma
Bạn đang xem bản rút gọn của tài liệu. Xem và tải ngay bản đầy đủ của tài liệu tại đây (2.61 MB, 21 trang )
Tsai et al. BMC Cancer (2017) 17:759
DOI 10.1186/s12885-017-3729-z
RESEARCH ARTICLE
Open Access
Gene expression signatures of
neuroendocrine prostate cancer and
primary small cell prostatic carcinoma
Harrison K. Tsai1,4*, Jonathan Lehrer2, Mohammed Alshalalfa2, Nicholas Erho2, Elai Davicioni2 and Tamara L. Lotan1,3
Abstract
Background: Neuroendocrine prostate cancer (NEPC) may be rising in prevalence as patients with advanced
prostate cancer potentially develop resistance to contemporary anti-androgen treatment through a neuroendocrine
phenotype. While prior studies comparing NEPC and prostatic adenocarcinoma have identified important
candidates for targeted therapy, most have relied on few NEPC patients due to disease rarity, resulting in thousands
of differentially expressed genes collectively and offering an opportunity for meta-analysis. Moreover, past
studies have focused on prototypical NEPC samples with classic immunohistochemistry profiles, whereas there
is increasing recognition of atypical phenotypes. In the primary setting, small cell prostatic carcinoma (SCPC)
is frequently admixed with adenocarcinomas that may be clonally related, and a minority of SCPCs express
markers typical of prostatic adenocarcinoma while rare cases do not express neuroendocrine markers. We
derived a meta-signature of prototypical high-grade NEPC, then applied it to develop a classifier of primary
SCPC incorporating disease heterogeneity.
Methods: Prototypical NEPC samples from 15 patients across 6 frozen tissue microarray datasets were
assessed for genes with consistent outlier expression relative to adenocarcinomas. Resulting genes were used
to determine subgroups of primary SCPCs (N=16) and high-grade adenocarcinomas (N=16) profiled by exon
arrays using formalin-fixed paraffin-embedded (FFPE) material from our institutional archives. A subgroup
classifier was developed using differential expression for feature selection, and applied to radical
prostatectomy cohorts.
Results: Sixty nine and 375 genes demonstrated consistent outlier expression in at least 80% and 60% of
NEPC patients, with close resemblance in expression between NEPC and small cell lung cancer. Clustering by
these genes generated 3 subgroups among primary samples from our institution. Nearest centroid
classification based on the predominant phenotype from each subgroup (9 prototypical SCPCs, 9 prototypical
adenocarcinomas, and 4 atypical SCPCs) achieved a 4.5% error rate by leave-one-out cross-validation. The
classifier identified SCPC-like expression in 40% (2/5) of mixed adenocarcinomas and 0.3-0.6% of
adenocarcinomas from prospective (4/2293) and retrospective (2/355) radical prostatectomy cohorts, where
both SCPC-like retrospective cases subsequently developed metastases.
Conclusions: Meta-analysis generates a robust signature of prototypical high-grade NEPC, and may facilitate
development of a primary SCPC classifier based on FFPE material with potential prognostic implications.
Keywords: Neuroendocrine prostate cancer, Small cell carcinoma, Mixed prostatic adenocarcinoma, FFPE,
Gene signature, Meta-analysis, Nearest centroid classifier
* Correspondence:
1
Department of Pathology, Johns Hopkins University School of Medicine,
Baltimore, MD, USA
4
Present address: Department of Pathology, Brigham and Women’s Hospital,
Boston, MA, USA
Full list of author information is available at the end of the article
© The Author(s). 2017 Open Access This article is distributed under the terms of the Creative Commons Attribution 4.0
International License ( which permits unrestricted use, distribution, and
reproduction in any medium, provided you give appropriate credit to the original author(s) and the source, provide a link to
the Creative Commons license, and indicate if changes were made. The Creative Commons Public Domain Dedication waiver
( applies to the data made available in this article, unless otherwise stated.
Tsai et al. BMC Cancer (2017) 17:759
Background
Neuroendocrine prostate cancer (NEPC) is a rare aggressive variant of prostate cancer comprising a
spectrum of diseases emerging in different clinical settings, from de novo primary small cell prostatic carcinoma (SCPC) to treatment-related metastatic NEPC [1].
The 2016 WHO classification of NEPC consists of
adenocarcinoma with neuroendocrine differentiation
(Ad+NED), well-differentiated neuroendocrine tumor,
small cell neuroendocrine carcinoma (synonymous with
SCPC), and large cell neuroendocrine carcinoma
(LCNEC), of which the last two are particularly aggressive and referred to in this paper as high-grade NEPC.
Prevalence of NEPC is anticipated to rise as patients
with metastatic prostate cancer receive newer antiandrogen treatments and potentially develop resistance
through a neuroendocrine phenotype [2].
Molecular characteristics associated with high-grade
NEPC include absence of androgen receptor (AR) signaling, RB loss combined with p53 dysfunction, and reduced
REST activity together with up-regulation of neuroendocrine genes [3, 4]. Diagnosis is often supported through
immunohistochemistry (IHC) of corresponding proteins,
with high-grade NEPC exhibiting the prototypical profile
of negative AR, high Ki-67, and positive neuroendocrine
markers. In the primary setting however, IHC studies have
demonstrated PSA positivity in 17-20% of SCPC and retention of other markers associated with adenocarcinomas
in up to 25%, while panels of neuroendocrine markers can
be entirely negative in up to 12% [5, 6]. In the metastatic
setting, intermediate NEPC-like characteristics have been
observed among some adenocarcinomas progressing to
androgen-independence [7, 8]. Although prognostic implications of atypical features have not been formally established, rare hybrid tumors with aggressive progression
have been described [9, 10].
Diagnostically, NEPC may be challenging to distinguish histologically from poorly differentiated high-grade
adenocarcinoma, however prompt recognition is important since NEPC is relatively resistant to anti-androgen
treatment but initially sensitive to platinum-based
chemotherapy. Comparisons of NEPC and adenocarcinomas have led to candidates for diagnostic markers or
targeted therapy, such as AURKA [11]. Studies have generally been based on few NEPC patients with classic
immunophenotype and have resulted in at least 8 lists
with thousands of differentially expressed genes collectively [4, 8, 11–15], suggesting potential opportunity for
meta-analysis. Alternatively, larger populations of NEPC
tumors might be profiled by leveraging archived
formalin-fixed paraffin-embedded (FFPE) diagnostic
samples. Improved technology has demonstrated gene
expression concordance between FFPE and fresh frozen
tissue despite RNA degradation in FFPE, with an ability
Page 2 of 21
to detect molecular subtypes of prognostic and predictive importance [16, 17].
In this study, we first compared and assessed published
NEPC gene expression studies on the level of differentially
expressed gene-lists, cohort details, and gene expression
signatures. Using a meta-analysis approach, we consolidated common patterns of prototypical high-grade NEPC,
specifically identifying genes with consistent outlier expression among SCPC and LCNEC samples of classic immunophenotype across 6 frozen tissue microarray datasets,
yielding a 69-gene model with almost indistinguishable behavior between high-grade NEPC and small cell lung cancer (SCLC). We next analyzed an FFPE exon array dataset
from our institution (JHU-FFPE) profiling 16 primary
SCPCs and 16 adenocarcinomas (predominantly Gleason
9), notable for inclusion of mixed cases, AR-positive SCPCs,
PSA-positive SCPCs, and NE-marker negative SCPCs.
Based on meta-analysis genes, we identified 3 subgroups
(labeled prototypical SCPC, prototypical adenocarcinoma,
and atypical SCPC) and developed a LIMMA-based
3-centroid-classifier. Although we lacked a validation set,
the classifier achieved a 4.5% estimated error rate on leaveone-out cross-validation and detected SCPC-expression in
40% (2/5) of mixed adenocarcinomas and 0.3-0.6% of
adenocarcinomas from radical prostatectomy (RP) cohorts,
with a possible enrichment for adverse events.
Methods
NEPC gene-lists in the literature
We searched the literature for published gene-lists of differentially expressed genes between NEPC and prostatic
adenocarcinoma based on expression profiling of patient
tumor samples or patient-derived xenografts (Table 1) [4,
8, 11–15]. To compare gene-lists and identify common
genes, we updated gene names and probe assignments
with current HGNC symbols, and where possible, resolved
un-annotated probes and non-standard transcripts
through BLAT alignment of underlying sequences to
hg19. For rough statistical assessment of similarity, we
evaluated pair-wise overlaps of gene-sets via Fisher exact
test, with a presumptive background of ~20000 genes.
Bioinformatic processing and analysis
We collected various datasets for meta-analysis and
ancillary tests (Table 2). Microarrays were processed by
RMA-based pipelines to arrive at absolute log-intensities.
Gene signatures of AR signaling (ARS) (“Hieronymus up”
genes) [18], neuronal phenotype (Lapuk) [4], and cell cycle
progression (CCP) (Cuzick) [19] were scored by average
expression. LIMMA and DAVID/PANTHER were used
for differential expression and gene-ontology analyses
[20]. Details are provided in Additional file 1.
Tsai et al. BMC Cancer (2017) 17:759
Page 3 of 21
Table 1 Differential expression studies between NEPC & prostatic adenocarcinoma
NEPC samples
AdCa samples
Gene-list
Study
Type
U
M
L
P
U
M
L
P
WCMC mCRPC
T
10
10
3
2
25
18
9
7
41
37
24
5
a
WCMC 2011
T/X
7
6
UW mCRPC
T
6
7
2
LuCaP xeno
X
3
MDA xeno
X
3
VPC xeno
X
1
VPC 2012
T/X*
1
JHU 2009
T
Total
1
3
30
5-9
1
1
16
11
4
4
1
3
1
2
1
6
1
11
3
2
3
7-9
1
7
3
1
30
GS
1
29
1
9
114
Up
Dn
1226
1132
494
460
126
29
17
16
45
67
254
185
202
127
41
41
1782
1785
Legend: (Notation): U: unique patients, T: tumor, X: xenograft, P: primary, M: metastases, L: bladder, rectum, or lymph node, GS: Gleason score, Up/Dn: size of
gene-lists up/down-expressed in NEPC. (a): WCMC 2011 and VPC 2012 each contained one xenograft NEPC sample. (Notes): WCMC studies shared 2 NEPC
patients, while UW mCRPC and LuCaP studies shared 1 NEPC patient. Adenocarcinomas with NE differentiation were grouped with NEPCs in WCMC mCRPC, with
adenocarcinomas in MDA xeno, and with either cohort in UW mCRPC depending on IHC status of chromogranin and synaptophysin (NEPC when both positive).
The VPC xeno gene-list cross-referenced other studies and consisted of genes with expression changes following transdifferentiation in a xenograft model,
concomitant alterations in the same direction prior to transdifferentiation relative to adenocarcinomas, and exhibiting the same trend in WCMC 2011. The JHU
study consisted of a single patient tumor with adjacent small cell carcinoma and adenocarcinoma components
Outlier-based meta-analysis
For an NEPC sample, a gene was considered an outlier if
its expression was greater than 2 standard deviations
and log2-fold change 1 away from the mean of the dataset’s adenocarcinoma cohort. For adenocarcinomas, this
definition was applied after first removing the evaluated
sample from the adenocarcinoma cohort, although not
possible for the smallest dataset. For each gene, the
number of NEPC (or adenocarcinoma) samples with
outlier up-expression or down-expression was tabulated
Table 2 Gene expression datasets used
Dataset
Platform
Source
Patients
NEPC
AdCa
Ad+NED
Meta-analysis NEPC datasets
LuCaP xeno
Agilent
Internal
3
16
VPC xeno
Agilent
GSE41192
2
6
MDA xeno
Affymetrix 3'
GSE32967
3
2
MDA l-CRPC
Agilent
GSE33277
4
16
UM mCRPC
Agilent
GSE35988
2
33
UW mCRPC
Agilent
GSE66187
2
41
4
RNA-seq
cBioPortal
5a
113
*
25
*
1
Other NEPC and prostate datasets
SU2C (mCRPC)
WCMC (mCRPC)
RNA-seq
cBioPortal
TCGA
RNA-seq
cBioPortal
JHU-FFPE
Affymetrix Exon
GSE104786
Mayo-FFPE
Affymetrix Exon
GSE61126
a
10
333
16
16
1
235
MSKCC
Affymetrix Exon
GSE21034
UW-extra
Agilent
GSE77930
150
Prospective
Affymetrix Exon
GenomeDx
2293
JHU-RP
Affymetrix Exon
GSE79958
355
Mayo
Affymetrix Exon
GSE46691
780
2
39
2
GRID datasets (FFPE)
GSE61126
Legend: aNEPCs in SU2C and WCMC included adenocarcinomas with NE differentiation, SCPCs, and LCNECs, but without specification of subtype. NEPCs in other
datasets were entirely SCPCs except for one LCNEC sample from MDA xeno
Tsai et al. BMC Cancer (2017) 17:759
Page 4 of 21
and further summarized by patient using fractional
counts for multiple samples from the same patient.
Genes with outlier status in the same direction in N or
more NEPC patients were referred to as meta-N genes.
NEPC and adenocarcinoma centroids were similarly calculated on the patient level through fractional weights,
and used for correlation-based scoring and classification.
JHU-FFPE patient sample selection
Thirty-three FFPE samples (Table 3), diagnosed as 16
SCPC’s, 16 high-grade adenocarcinomas (majority
Gleason 9), and 1 adenocarcinoma with neuroendocrine
differentiation, including 4 matched pairs from mixed
Table 3 Pathology ofPathology of JHU-FFPE dataset samples
SCPC
AdCa
Ad+NED Gleason Block age Source
Type
Mixed samples (by ID)
56104_S 56104_A
3+4
2.5
TURP
Consult
56105_S 56105_A
5+4
2.5
TURP
Consult
56321_S 56321_A
5+4
14.2
TURP
Consult
57912_S 57912_A
5+4
0.2
RP
JH
56111_S
5+4
4.2
TURP
Consult
56106
5+5
2.2
TURP
Consult
56322
4+4
1.5
TURP
Consult
57914
5+5
4.6
Biopsy
Consult
57916
5+4
3.7
Biopsy
Consult
5+4
4.6
Biopsy
Consult
5+4
3.8
Biopsy
Consult
54674
15.9
Autopsy JH
56057
5.7
Biopsy
JH
56107
0.9
TURP
Consult
56110
2.2
TURP
Consult
57915
2.3
Biopsy
Consult
57920
2.9
Biopsy
Consult
57917
57918_A
Small cell only samples
Adenocarcinoma only samples
tumors, were retrieved from surgical pathology and
consultation files of Johns Hopkins Hospital from 19992013 after IRB approval and successfully processed for
gene expression profiling with Human Exon 1.0 ST GeneChips (Affymetrix), as described in a previous study
using 22 of these samples [21]. Diagnoses were in accordance with recently proposed morphologic criteria of
neuroendocrine differentiation in prostate cancer [1]. A
tissue microarray (TMA) containing 11 of the 33
samples with IHC of Rb1 and cyclin D1 was described
previously [21], and additional IHC was performed for
the prostate-related markers PSA (Ventana), AR
(Ventana SP107), and Nkx3.1 (Biocare), and the neuroendocrine markers chromogranin A (Ventana LK2H10),
synaptophysin (Novocastra 27G12), and CD56 (Cell
Marque 123C3.D5) [1, 22].
LIMMA-based centroid models
For binary classification based on training subgroups A
and B, LIMMA was used for feature selection (differentially expressed genes between A and B with adjusted pvalues < 0.05), and a nearest centroid model based on A
and B was developed. For ternary classification based on
training subgroups A, B, and C, feature selection consisted of differentially expressed genes common to 2 or
more LIMMA comparisons (A versus B, A versus C, and
B versus C), and a nearest centroid model based on A,
B, and C was developed. Leave-one-out cross-validation
(LOOCV) with mixed pairs removed together was used
to evaluate models, starting from new feature selection
upon each removal.
GRID® database
Expression profiles (N=3428) of adenocarcinomas from
RP specimens were retrieved from Decipher GRID®
prostate cancer database [23], consisting of high risk
cases from clinical use of the Decipher test
(NCT02609269; Prospective cohort) or from retrospective institutional studies with outcomes data (JHU-RP
and Mayo cohorts) [24–26]. Specimen selection, RNA
extraction, and Human Exon 1.0 ST Array hybridization
were done in a Clinical Laboratory Improvement
Amendments (CLIA/CAP/NYS)-certified laboratory facility (GenomeDx Biosciences, San Diego, CA, USA) as
previously described [27]. Normalization was performed
using Single Channel Array Normalization (SCAN).
57585
4+5
2.0
Biopsy
JH
57589
4+5
2.0
Biopsy
JH
57591
4+5
1.9
Biopsy
JH
57619
4+5
2.6
Biopsy
JH
57632
4+5
2.5
Biopsy
JH
57634
5+5
2.4
Biopsy
JH
57637
4+5
2.3
Biopsy
JH
Results
57640
4+5
2.1
Biopsy
JH
57641
5+4
2.1
Biopsy
JH
57642
4+5
2.0
Biopsy
JH
Literature NEPC gene-lists comprise thousands of genes
with significant overlap but no universal genes despite a
common NEPC immunophenotype and common gene signature patterns
3.7
Biopsy
JH
Adenocarcinomas with NE differentiation
56061_A 56061_S 5+4
We identified 8 gene-lists from the literature comparing
gene expression of NEPCs and prostatic adenocarcinomas,
Tsai et al. BMC Cancer (2017) 17:759
based on a collective total of 29 and 114 unique patients
respectively (Table 1) [4, 8, 11–15]. Cohort definitions varied slightly between studies, specifically regarding treatment of adenocarcinomas with NE differentiation, which
were grouped with NEPCs in WCMC mCRPC, with
adenocarcinomas in MDA xeno, and variably with either
cohort depending on IHC status in UW mCRPC (grouped
with NEPC when synaptophysin and chromogranin both
positive). NEPC cohorts thus contained significant proportions of adenocarcinomas with NE differentiation for
WCMC mCRPC and UW mCRPC (46% and 50% of
NEPCs respectively), but otherwise consisted exclusively
of SCPCs and one rare LCNEC for most gene-lists (6 of
8). IHC of annotated SCPCs and the LCNEC, when provided, was always negative for PSA (17/17 patients) and
AR (10/10), always positive for synaptophysin (17/17), and
usually positive for chromogranin (9/15). Thus most genelists, in particular the 6 of 8 based on SCPCs / LCNEC,
corresponded to a classic NEPC immunophenotype and
notably lacked AR-positive or PSA-positive SCPCs, which
have been reported in 17-20% of primary SCPCs [5, 6].
Collectively, the 8 gene-lists consisted of 1782 upgenes and 1785 down-genes with increased and decreased expression in NEPC, including 433 (24%) and
235 (13%) common to multiple lists although some studies were not entirely independent (Additional file 2:
Table S1). No genes were common to all lists, with the
most frequent comprised of 9 largely neuronal up-genes
in 5/8 lists (BSN, CRMP1, GPRIN1, INA, MAST1,
MYT1, RAB3C, SNAP25, UNC13A) and 5 largely
androgen-related down-genes in 4/8 lists (CYP1B1,
KLK2, KLK3, STEAP1, TRPV6). Gene-lists demonstrated pair-wise similarity, often related to cohort or
statistical details (Additional file 2: Table S2); the study
with greatest statistical power (WCMC mCRPC) generated the largest list (>2000 genes) [8] and overlapped
most with other gene-lists, while comparisons of metastatic NEPC versus primary adenocarcinoma (WCMC
2011, VPC 2012) resulted in enrichment of metastasisassociated genes (Additional file 2: Table S3).
We obtained available NEPC gene expression data corresponding to 5 of the 8 gene-lists, 3 more studies with
known SCPCs (including an FFPE dataset from our institution), and 1 study (SU2C) with rare NEPCs consisting mostly (80%) of adenocarcinomas with NE
differentiation (Table 2). Gene signature scores were
used to assess samples (Fig. 1), similar to a recent study
[7]. Annotated SCPCs (and the LCNEC) from frozen tissue datasets almost always demonstrated a prototypical
pattern of low ARS, high neuronal phenotype, and high
CCP scores, in accordance with a classic NEPC immunophenotype. In xenograft and frozen tissue primary
datasets, ARS and neuronal phenotype scores completely
separated SCPCs / LCNEC from adenocarcinomas (AUC
Page 5 of 21
100%). Annotated adenocarcinomas with NE differentiation generally demonstrated gene signature scores similar to adenocarcinomas, except possibly with slightly
elevated neuronal phenotype scores. A few NEPCs from
WCMC and SU2C also demonstrated gene signature
scores similar to adenocarcinomas, and possibly represented adenocarcinomas with NE differentiation, however specific NEPC subtype was not provided in
annotations of these datasets [8].
Outlier-based meta-analysis identifies NEPC expression
patterns on the patient level
We produced a meta-analysis signature of prototypical
high-grade NEPC (omitting adenocarcinomas with NE
differentiation) by utilizing 6 frozen tissue microarray
datasets profiling 23 NEPC samples (from 15 patients)
with SCPC or LCNEC morphology, classic immunophenotype (when provided), and low ARS and high neuronal
phenotype scores (Table 2, Additional file 2: Table S4)
[12–14, 21, 28, 29]. These datasets largely contained
NEPCs and adenocarcinomas from similar clinical
stages, ideally reducing confounding effects; known
adenocarcinomas with NE differentiation were considered separately. RNA-seq datasets were excluded from
meta-analysis as it was not possible to separate adenocarcinomas with NE differentiation from the NEPC cohorts based on available annotations. The FFPE dataset,
which will be analyzed in detail in a later section, was
excluded due to attenuated expression and cohort heterogeneity. We compiled the meta-12 (Table 4) and
meta-9 (Additional file 2: Table S5) gene-sets, comprised
of 69 and 375 genes with consistent outlier status in at
least 80% (12/15) and 60% (9/15) of high-grade NEPC
patients. Meta-12 genes, which required agreement between NEPCs from at least 4 datasets due to cohort
sizes, were enriched for “generation of neurons” (adj
p=2.6e-6 in up-genes) and “androgen receptor signaling”
(adj p=3.8e-3 in down-genes) but not cell cycle. Rather,
“cell division” became the most enriched gene-ontology
term among meta-9 up-genes (adj p=2.6e-6), partly due
to cell-cycle genes meeting outlier criteria in primary
but not necessarily metastatic NEPC. Most meta genes
appeared in the literature: 90% of meta-12 including AR,
ASCL1, SRRM4, and CCND1, and 78% of meta-9 including PEG10, REST, EZH2, CHGA, and RB1, as expected since published NEPC gene-lists (Additional file 2:
Table S1) used 9 of the NEPC patients. However, outlier
analysis potentially missed genes with modest foldchanges or large variability such as HIST1H4C, which
was an outlier in 55% of NEPC patients but increased
to 92% under relaxed criteria. Metastatic CRPC NEPC
samples demonstrated the least outlier agreement overall, while rare adenocarcinomas had NEPC-like outlier
Tsai et al. BMC Cancer (2017) 17:759
Page 6 of 21
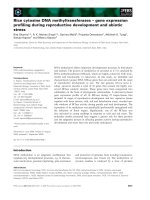
Fig. 1 Gene signature scores across datasets profiling NEPC and adenocarcinomas. (A[A’]:B[B’]) denotes cohort sizes of A adenocarcinomas and B
NEPCs including A’ or B’ adenocarcinomas with NE differentiation, u denotes mean score of the adenocarcinoma cohort, p denotes p-value under
t-test comparison of NEPCs versus adenocarcinomas, and (*) signifies p-values after averaging over multiple samples from the same patient.
ARS and neuronal phenotype scores completely separated cohorts (AUC 100%) in xenograft and frozen tissue primary datasets (Lucap-x, VPC-x,
MDA-x, MDA), and ARS demonstrated significant cohort differences (p<0.05) across all datasets. CCP was highly correlated to an RB loss signature
(mean r=0.96 across datasets; not shown), in agreement with reports showing correlation of CCP and E2F1 targets [7]. In UW, NEPCs annotated as
adenocarcinomas with NE differentiation mostly demonstrated ARS and CCP scores similar to adenocarcinomas. In WCMC and SU2C, NEPCs also
sometimes demonstrated gene signature scores similar to adenocarcinomas, and may have corresponded to adenocarcinomas with NE differentiation,
however NEPC subtypes were not specified in annotations provided. In JHU-FFPE, 5 SCPCs exhibited ARS scores similar to adenocarcinomas (fold-change
> -0.5 and z-score > -1), and are investigated further in the JHU-FPE results section. JHU-FFPE scores also demonstrated the least dynamic range across
gene signatures, likely related to RNA degradation in FFPE. Gene signature scores were formed by average expression of genes. Among single-sample
scoring methods, SVD-based PLAGE has been recognized as a top performer and is equivalent to (signed) average expression for perfectly correlated (and
anti-correlated) genes. Indeed, PLAGE and average expression were highly correlated across the NEPC datasets (correlations for CCP > 0.99,
Neuronal > 0.96, ARS > 0.95)
Tsai et al. BMC Cancer (2017) 17:759
Page 7 of 21
Table 4 Meta-12 genes with outlier expression in > 80% (12/15) high-grade NEPC patients
Gene
NEPC outliers
% NEPC [15]
% AdCa [114]
% Ad+NED [5]
NEPC centroid
AdCa centroid
AP3B2
15
100
6
80
8.5
6.5
TUBB2B
14.4
96
4
0
11.8
7.3
CRMP1
14
93
4
60
9.9
6.7
PCSK1
14
93
3
20
10.8
6.2
SEZ6
14
93
4
60
8.5
6.5
CDC25B
13.8
92
7
0
11.5
9.5
KCNC1
13.8
92
2
40
7.8
5.7
TMEM145
13.7
91
6
40
11.7
9.1
CCDC88A
13.4
89
4
40
9.0
7.6
ASCL1
13.3
89
5
0
10.9
6.8
ENO2
13.2
88
5
0
11.6
9.4
MIAT
13.1
87
6
0
10.1
7.1
SRRM4
13.1
87
5
40
8.8
6.4
Up genes
NPTX1
13
87
4
0
10.7
7.2
PHF19
13
87
6
0
10.8
9.2
RNF183
13
87
6
0
9.4
7.2
TOX
13
87
4
40
8.6
6.2
INSM1
12.9
86
4
0
10.1
6.9
IGFBPL1
12.8
85
6
0
9.5
7.1
ELAVL3
12.6
84
2
60
7.7
6.0
RUNDC3A
12.6
84
5
20
9.1
7.0
NKX2-1
12.5
83
5
0
10.0
7.8
UNC13A
12.5
83
6
100
7.8
6.0
FANCL
12.4
83
1
0
12.3
11.6
SH3GL2
12.4
83
4
20
10.0
7.0
FAM161A
12.1
81
6
0
9.6
8.9
APLP1
12
80
4
40
9.3
7.2
DLL3
12
80
4
40
9.2
6.7
DNMT1
12
80
4
20
10.5
8.7
ELAVL4
12
80
3
50
7.7
5.7
FGF9
12
80
6
0
9.5
7.3
INA
12
80
8
20
11.0
7.6
NPPA
12
80
4
0
8.6
5.9
PCSK2
12
80
1
0
8.1
5.5
SNAP25
12
80
8
100
9.5
6.2
SOX2
12
80
5
0
11.0
7.3
STMN1
12
80
3
0
10.6
9.9
AR
14.3
95
5
0
7.0
13.3
AIM1
14.3
95
5
20
7.7
10.2
ADRB2
14
93
3
20
7.8
11.5
SPDEF
14
93
4
0
8.9
12.0
STEAP1
14
93
5
0
7.0
12.7
Down genes
Tsai et al. BMC Cancer (2017) 17:759
Page 8 of 21
Table 4 Meta-12 genes with outlier expression in > 80% (12/15) high-grade NEPC patients (Continued)
Gene
NEPC outliers
% NEPC [15]
% AdCa [114]
% Ad+NED [5]
NEPC centroid
STEAP2
14
93
6
0
7.6
AdCa centroid
13.3
C1orf116
13.9
93
4
0
7.8
11.4
ERGIC1
13.9
93
5
0
8.2
10.5
LATS2
13.8
92
4
0
7.3
10.5
NKX3-1
13.6
91
6
0
8.9
14.9
PMEPA1
13.6
91
4
0
10.2
14.5
HOMER2
13.4
89
3
0
7.8
10.9
ZBTB16
13.4
89
5
0
8.3
12.4
ZG16B
13.4
89
4
0
8.2
13.0
EPHX2
13.1
87
2
0
9.1
12.5
SLC45A3
13
87
5
0
9.1
14.6
GLUD1
12.7
85
4
0
10.0
12.7
SLC44A4
12.7
85
5
20
7.5
10.5
CCND1
12.6
84
8
40
6.9
10.1
KLK3
12.6
84
4
0
9.3
12.8
PPAP2A
12.6
84
7
0
10.7
14.8
GRTP1
12.5
83
4
0
6.0
7.9
YAP1
12.5
83
4
60
6.4
9.1
SYNGR2
12.4
83
4
0
10.8
13.0
ALDH6A1
12.3
82
2
0
8.7
11.7
NAP1L2
12.3
82
5
0
6.3
9.8
HPN
12.2
81
5
20
8.0
11.3
RGS10
12.1
81
4
0
10.1
14.1
RILPL2
12.1
81
4
0
9.1
11.4
ACPP
12
80
3
20
7.3
11.5
HOXB13
12
80
6
0
10.4
14.2
ICAM3
12
80
6
0
8.7
11.0
Legend: List of meta-12 genes with % outlier status [# patients] among meta-analysis patients (NEPC, adenocarcinoma, or adenocarcinoma with NE differentiation).
Centroids were formed by averaging each gene over NEPC or adenocarcinoma patients
behavior and were often associated with notable features
(Additional file 3: Figure S1).
We next examined genes not present on all microarrays but still demonstrating consistent outlier expression. The most prevalent was CCEPR, overexpressed in
11.5/13 (88%) NEPC patients [30]. This sparsely studied
long non-coding RNA did not appear in probe annotation files or GENCODE (v25), but was targeted by
probes A_32_P216820 (Agilent), 228679_at (Affymetrix),
and 3290641 (Affymetrix exon) based on BLAT; one
NEPC gene-list included 228679_at without gene annotation [13]. Genomic location of CCEPR almost overlapped with the meta-9 up-gene PHYHIPL from the
opposite strand, and these genes were highly correlated
in meta-analysis datasets (r=0.70-0.93). PHYHIPL probeset 226623_at moreover had the top co-expression similarity score (3.2e-138) to CCEPR probe-set 228679_at
under Multi-Experiment Matrix analysis based on hundreds of Affymetrix datasets [31].
Meta-12 genes were derived from conceptually similar
criteria underlying the recent integrated NEPC classifier
[8]. We adopted further modifications, including nearest
centroid scoring and equal weighting of patients,
whereas the integrated classifier relied on a single centroid (NEPC) and utilized equal weighting of samples,
with significant influence from one patient providing almost half of NEPC samples (6/13) with highly similar
expression profiles. The classifiers were similarly sized
(69 versus 70 genes; 11 shared), highly correlated across
NEPC mCRPC datasets (UM 0.73, SU2C 0.87, WCMC
0.90), and produced identical classifications of SU2C,
but disagreed on rare respective discovery samples (2
WCMC NEPCs and 2 UM adenocarcinomas). Both
classifiers were based on NEPCs with below average
Tsai et al. BMC Cancer (2017) 17:759
ARS scores (WCMC initially included one NEPC with
elevated ARS, which was excluded before derivation
of the final classifier). Nearest centroid classification
relative to meta-12 centroids (Table 4) yielded sensitivities and specificities of 91% and 100% on training
samples (AUC 100% for correlation difference), and
60-80% and 94-100% in non-training NEPC datasets
(Additional file 3: Figure S2). In non-prostate datasets, SCLC had the most similar profiles to NEPC,
followed by CNS samples (Fig. 2); rare cell lines from
other sites, including gastric small cell carcinomas,
also resembled NEPC. In JHU-FFPE, meta-12 centroid
profiles appeared to generate two main clusters, with
the predominantly adenocarcinoma cluster containing
5 SCPCs. These SCPCs will be further characterized
in the next section.
Page 9 of 21
JHU-FFPE demonstrates heterogeneity of primary SCPC
with associated gene expression patterns relative to
signatures and meta-9 genes
We used exon arrays to profile FFPE material of 16
primary SCPCs, 16 high-grade adenocarcinomas, and 1
adenocarcinoma with NE differentiation from our institutional archives (JHU-FFPE) (Table 3), intended to represent the natural heterogeneity of primary SCPC.
Primary SCPC is known to frequently co-occur with
adenocarcinoma (43% in the largest published series),
typically of high Gleason grade (> 8 in 85% of cases) [6].
In JHU-FFPE, 10/16 (62.5%) SCPCs were mixed with
adenocarcinomas, mostly of primary Gleason pattern 5
(80%), although only 4 fully matched pairs were available
for gene expression profiling. Overall, JHU-FFPE adenocarcinomas were predominantly Gleason grade 9 (88%)
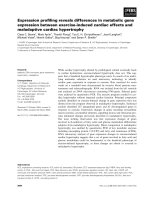
Fig. 2 Correlation profiles relative to meta-12 adenocarcinoma and NEPC centroids across datasets. Nearest centroid classification of NEPC datasets
demonstrated NEPC sensitivities and specificities of 91% and 100% on training samples, 60% and 98% in SU2C, 80% and 100% in WCMC, and 63% and
94% in JHU-FFPE. Centroid correlation profiles were also evaluated for prostatic adenocarcinoma datasets (TCGA, MSK, Mayo-FFPE) and various human
tissue or cell line datasets including SCLC (GSE43346), CCLE (cBioPortal), Human Body Index (GSD7307), ENCODE (GSE19090), and NIH Roadmap
(GSE18927). Correlations were generally weaker in FFPE datasets (JHU-FFPE, Mayo-FFPE) and in WCMC derived primarily from biopsies. Rare outlier
adenocarcinomas were present across datasets, usually related to low ARS. SCLCs generally had the most similar centroid profile to NEPC followed by
small cell gastric carcinoma and CNS-related samples. In JHU-FFPE, 5 SCPCs appeared to cluster with adenocarcinomas, demonstrated ARS scores
similar to adenocarcinomas (Fig. 1, Additional file 3: Figure S3), and are discussed further in the JHU-FFPE results section
Tsai et al. BMC Cancer (2017) 17:759
Page 10 of 21
by design, and most had primary Gleason pattern 4
(56%).
Primary SCPC is also known to infrequently retain expression of adenocarcinoma markers (AR 17%; PSA 1719%) or lack expression across neuroendocrine panels
(12%) [5, 6]. Among SCPC samples from JHU-FFPE with
available IHC status, 2/9 (22%) expressed AR robustly,
3/9 (33%) expressed AR weakly, 1/12 (9%) expressed
PSA, and 1/9 (11%) had joint negativity of synaptophysin, chromogranin, and CD56 (Table 5). SCPCs with robust AR IHC (mixed 57912_S and pure 56107) exhibited
unusual hybrid IHC profiles with uniform positivity of
some androgen-related (AR, Nkx3.1) and neuroendocrine (synaptophysin, CD56) markers, and negativity of
others (PSA and chromogranin) (Fig. 3). On the gene expression level, ARS scores were retained at levels similar
to adenocarcinomas (fold-change > -0.5 and z-score > -1
relative to adenocarcinomas) in 5/16 (31%) SCPCs (Fig.
1), corresponding to the SCPCs clustering with adenocarcinomas in the meta-12 centroid profiles (Fig. 2), including both pure and mixed cases, and comprised of
the SCPCs with robustly positive AR IHC (57912_S,
56107) and SCPCs with unknown AR status (56057,
57914, 57915). The robust AR-positive SCPCs both had
elevated KLK3 expression despite absence of the PSA
protein product on IHC. In other public datasets, annotated SCPCs with similarly retained ARS scores were
rare, if present at all (Additional file 3: Figure S3).
Hierarchical clustering relative to meta-9 genes generated 3 main subgroups, labeled “prototypical” adenocarcinomas, “prototypical” SCPCs, and “atypical” SCPCs,
which generally corresponded to pure adenocarcinomas,
SCPCs with reduced ARS, and SCPCs with retained ARS
respectively (Fig. 4). The exceptions were one SCPC outlier with retained ARS (57914) that clustered with
prototypical adenocarcinomas, one pure adenocarcinoma
outlier (57634) described previously in a case report for its
unusually aggressive clinical progression [32] that clustered with prototypical SCPCs, and heterogeneous behavior of mixed adenocarcinomas. Highly similar hierarchical
clusters were generated using the collective genes of the
ARS, CCP, and neuronal phenotype signatures, of which
38% (49/128 genes) overlapped with meta-9 genes. By
contrast, hierarchical clustering relative to meta-12 genes
(noted previously to lack enrichment for cell cycle) failed
to produce the subgroup of SCPCs with retained ARS.
The pure adenocarcinoma outlier (57634), which behaved similar to prototypical SCPCs under meta-9 and
also meta-12, clustered adjacent to the SCPC with joint
neuroendocrine marker negativity (56322). Both samples
were characterized by low ARS, non-elevated neuronal
phenotype, and high CCP scores relative to adenocarcinomas (Fig. 5). We queried for the first 2 joint conditions
in other datasets (relaxing the CCP constraint initially),
specifically searching for outlier ARS scores (fold-change
< -1, z-score < -2) and non-elevated neuronal phenotype
scores (fold-change < 0.5, z-score < 1), with slightly relaxed ARS criteria (fold-change < -0.75, z-score < -1.5)
for JHU-FFPE and WCMC CRPC due to attenuated expression. We identified 20 such clinical samples from 18
patients across metastatic datasets (Fig. 5). RAB3B, upregulated in prostate cancer through AR [33], was the
top-most jointly differentially expressed gene in this subgroup, with reduced expression relative to either NEPCs
or adenocarcinomas (Additional file 3: Figure S4). CCP
levels varied widely among these samples. High levels
occurred across multiple datasets and included UM
WA46, which was noted to have morphologic features
of prostate cancer with NE differentiation [8]. Low levels
potentially reflected response to treatment, as
demonstrated in a previous study where ARS and CCP
decreased in every patient after ADT (Additional file 3:
Table 5 IHC results of selected JHU-FFPE samples
SCPC
AdCa
Rb1
ccnd1
PSA
nkx3.1
AR
chga
syp
CD56
n|p
w|p
p|n
p|n
p|n
Mixed samples (by ID)
56104_S
56104_A
n|w
n|p
n|p
56105_S
56105_A
n|w
n|p
n|w
n|p
n|p
w|n
w|n
w|w
56321_S
56321_A
n|w
n|p
n|p
n|p
n|p
n|n
w|n
w|n
57912_S
57912_A
n|n
n|p
p|p
p|p
n|n
p|n
p|p
56111_S
n
n
n
n
w
w
p
p
56106
n
n
n
n
n
n
w
w
56322
n
p
n
n
w
n
n
n
56107
p
n
n
w
p
n
p
n
56110
n
n
n
n
n
n
p
p
Small cell only samples
Legend: IHC data was available from a tissue microarray including 11 of the samples and for the radical prostatectomy mixed case (57912_A and 57912_S), and
scored as positive (p), negative (n), or weak (w). Chromogranin A status for 57912_A and 57912_S was obtained from the diagnostic report
Tsai et al. BMC Cancer (2017) 17:759
Page 11 of 21
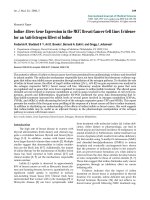
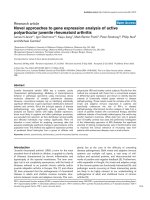
Fig. 3 Hybrid immunohistochemistry of an unusual mixed tumor. A hybrid IHC profile was observed in an unusual mixed case from JHU-FFPE with
concurrent small cell (57912_S) and Gleason 5+4 adenocarcinoma (57912_A) components. The SCPC component appeared to uniformly co-express
androgen-related markers (Nkx3.1, AR) and neuroendocrine markers (synaptophysin and CD56/NCAM1 but not chromogranin) by IHC. Unusually, IHC
was negative for PSA despite moderate expression of the underlying gene KLK3 (Additional file 3: Figure S11). By contrast, the
adenocarcinoma component was IHC positive for PSA and negative for synaptophysin and CD56. Both components were IHC
negative for cyclin D1, a proposed marker of SCPC [21]
Figure S5) [34]. This variation in CCP may partially
explain the discordance between a recent report of
negative correlation between AR signaling and proliferation signatures in metastatic CRPC versus earlier
analysis reporting positive correlation between AR and
E2F1 [7, 35].
Mixed adenocarcinomas were distributed among all 3
meta-9 clustering subgroups, possibly associated with
degree of clonal relation with SCPCs. Clonal genomic alterations shared by components of a mixed tumor have
been observed in key SCPC genes such as TP53 [15],
and are capable of driving gene expression changes
despite maintenance of morphology; for instance, gene
expression changes intermediate to SCPC were recently
reported in a xenograft model of transdifferentiation derived from a primary prostatic adenocarcinoma with biallelic alterations in TP53, RB1, and PTEN [12, 36]. On
the other hand, mixed tumors are also susceptible to improper sampling, especially when components are intermingled. One mixed adenocarcinoma (56104_A), which
clustered adjacent to its SCPC component (56104_S),
was suspicious for such contamination. It unusually had
the highest CCP score among JHU-FFPE adenocarcinomas (and #6 overall versus #2 for 56104_S) despite
having the lowest Gleason grade (3+4), and one of the
highest neuroendocrine phenotype scores (#3 overall
versus #1 for 56104_S), including elevated expression
levels of genes underlying chromogranin, synaptophysin,
and CD56 despite IHC negativity. On one TMA core of
the mixed tumor, an adenocarcinoma gland appeared
upon deeper cuts of the SCPC component, demonstrating their close proximity (Additional file 3: Figure S6).
We also speculated whether the mixed SCPC outlier
(57914) might similarly be contaminated with adenocarcinoma, but had no evidence other than the remote possibility gleaned from its diagnostic report, which noted
areas of merging with Gleason grade 5+5 prostatic
adenocarcinoma.
Meta-9 derived subgroups yield a differential expression
based classifier for prototypical and atypical SCPC in the
primary setting
Comparison of SCPC and adenocarcinomas from JHUFFPE produced 385 differentially expressed genes by
LIMMA (111 up, 274 down) (Additional file 3: Figure
S6), including 124 (32%) from literature NEPC gene lists.
Down-genes included numerous prostate specific genes
(e.g., KLK3, NKX3-1) and the known NEPC-related
Tsai et al. BMC Cancer (2017) 17:759
Page 12 of 21
Fig. 4 Hierarchical clustering of JHU-FFPE relative to meta-9 genes. There were 3 main groups, which we labeled “prototypical” adenocarcinomas,
“prototypical” SCPCs, and “atypical” SCPCs, and which generally corresponded to pure adenocarcinomas, SCPCs with reduced ARS, and SCPCs with
retained ARS respectively. The only exceptions were one SCPC outlier with retained ARS (57914) that clustered with prototypical adenocarcinomas, one pure adenocarcinoma outlier (57634) described previously in a case report that clustered with prototypical SCPCs, and heterogeneous
behavior of mixed adenocarcinomas. The adenocarcinoma 57634 clustered near 56322, an SCPC with negative IHC for all 3 neuroendocrine
markers synaptophysin, chromogranin, and CD56. The oldest SCPC’s (54674 and 56321_S) had low CCP and also clustered together. Meta-9 clustering was consistent with subsequent nearest centroid classification based on 9 prototypical SCPC, 9 prototypical adenocarcinoma, and 4 atypical
SCPC with LIMMA-based feature selection (Fig. 6)
genes CCND1 and REST [4]. Up-genes were enriched
for “cell cycle” (adj p=7.8e-10) but included only 1 neuronal phenotype gene despite presence of the neuronal
gene repressor REST among the down genes. We explored the exon array’s ability to detect known truncated
splice variants associated with reduced REST activity,
given that probe-set 2728423 targeted the 50-62bp cryptic exon found in neuroblastoma (hREST-N62), small
cell lung cancer (sREST), and presumably NEPC [14, 37,
38]. There was no evidence of cryptic exon use in JHUFFPE, however we could not rule out poor probe-set
performance (Additional file 3: Figure S7) [39]. Differential expression increased substantially by reducing cohort
heterogeneity (e.g., 5.8-fold to 2235 genes by removing
SCPCs with retained ARS). Nearest centroid classification, based on SCPC versus adenocarcinoma with
LIMMA feature selection, reflected this known heterogeneity and achieved an estimated error rate of 25% (8/
32) under LOOCV, with incorrect predictions of cases
highlighted by meta-9 clustering: the 5 SCPCs with
retained ARS, the 2 mixed adenocarcinomas clustering
with SCPCs, and the pure adenocarcinoma outlier.
We constructed a new set of cohorts based on meta-9
clusters. We selected 9 prototypical SCPCs and 9 prototypical adenocarcinomas by excluding non-standard
samples: specifically mixed adenocarcinomas, the outlier
adenocarcinoma, adenocarcinomas associated with NE
differentiation, SCPCs with robust AR positive IHC or
retained ARS, and samples archived over 10 years in
FFPE. We then selected the 4 atypical SCPCs with
retained ARS, excluding the outlier 57914. LIMMA
produced 1624 differentially expressed genes between
Tsai et al. BMC Cancer (2017) 17:759
Page 13 of 21
Fig. 5 Low ARS without elevated neuronal phenotype samples across clinical datasets. Twenty samples with low ARS and low/average neuronal
phenotype scores were identified based on outlier-style cut-offs relative to adenocarcinomas (fold-change < -1, z-score < -2 for ARS; fold-change
< 0.5, z-score < 1 for neuronal phenotype), including known unusual cases such as the case report adenocarcinoma 57634 (JHU-FFPE), and also
samples from pure adenocarcinoma datasets (MSKCC). Differential expression analysis was notable for down-expression of RAB3B in this group
relative to the remaining adenocarcinomas or NEPCs (Additional file 3: Figure S4). These samples also demonstrated a wide range of CCP scores
(color axis), where low CCP possibly reflected response to treatment (Additional file 3: Figure S5)
prototypical categories, 118 between atypical SCPC and
prototypical adenocarcinoma, and 115 between atypical
and prototypical SCPC (Additional file 3: Figure S7).
Most differentially expressed genes involving atypical
SCPC were already differentially expressed between
prototypical categories (79/118 and 97/115 genes;
p=1.7e-63 and 4.8e-95), with greatest enrichment for
“cell cycle phase” (p=1.9e-28) and including known
NEPC-related epigenetic genes (EZH2, DNMT1,
HIST1H4C). Thus, atypical SCPCs demonstrated a hybrid or intermediate phenotype.
Nearest centroid classification based on the 3 newly
defined cohorts and common genes between > 2 pair-
wise LIMMA comparisons (Table 6) achieved an estimated error rate of 4.5% (1/22), with incorrect prediction of the atypical SCPC training sample 56107
(although correct classification before LOOCV). On
remaining non-training samples, 4/10 classified discordantly with diagnoses: the meta-9 outliers (57914, 57634)
and 2/5 mixed adenocarcinomas (56321_A as atypical
SCPC, 56104_A as prototypical SCPC; also under
models derived after excluding their matched SCPC
from training). Behavior of mixed adenocarcinomas, especially considering biopsies, may thus potentially be
prognostic of an underlying undetected SCPC component in a subset of cases presumably enriched for mixed
Tsai et al. BMC Cancer (2017) 17:759
Page 14 of 21
Table 6 Differentially expressed genes common to 2 or more
LIMMA comparisons between: 9 prototypical SCPC, 9 prototypical
AdCa, and 4 atypical SCPC, with associated centroids
Table 6 Differentially expressed genes common to 2 or more
LIMMA comparisons between: 9 prototypical SCPC, 9 prototypical
AdCa, and 4 atypical SCPC, with associated centroids (Continued)
Gene
AD
SC
AS
AD (SCAN)
SC (SCAN)
AS (SCAN)
Gene
AD
SC
AS
AD (SCAN)
SC (SCAN)
AS (SCAN)
TPX2
5.40
6.73
7.41
0.16
1.10
1.33
CENPK
4.11
5.32
5.94
-0.01
0.47
0.57
CHEK1
4.42
5.54
6.12
0.02
0.46
0.55
GINS1
4.49
5.59
6.22
-0.11
0.43
0.66
CKAP2L
4.67
5.57
5.70
-0.04
0.41
0.29
CDKN3
4.81
6.06
6.81
-0.03
0.49
0.59
HMMR
3.99
4.76
5.17
-0.07
0.25
0.30
CNIH2
6.08
6.60
6.84
0.04
0.28
0.33
CDCA2
4.32
5.05
5.45
-0.13
0.19
0.29
ESCO2
4.06
4.55
4.69
-0.17
0.00
0.05
KIF15
4.16
5.15
5.26
-0.07
0.41
0.39
NUF2
4.54
5.79
5.66
-0.01
0.57
0.35
ARHGAP11B
5.11
5.94
6.23
0.05
0.44
0.51
NUSAP1
5.47
6.91
7.45
0.15
1.15
1.25
ANLN
4.60
5.57
6.10
0.00
0.49
0.61
KIF23
4.74
5.64
5.85
-0.01
0.46
0.38
WDHD1
4.35
5.07
5.75
0.02
0.31
0.47
CDK1
4.10
5.08
5.22
-0.04
0.40
0.41
NCAPG2
4.60
5.37
5.73
0.03
0.39
0.48
FBXO5
5.15
6.19
6.63
0.09
0.56
0.63
TMPO
5.88
6.74
7.37
0.30
0.97
1.21
CDC20
5.95
6.55
6.71
0.07
0.39
0.45
KIF2C
4.60
5.21
5.29
-0.11
0.14
0.15
PLK4
3.94
4.78
5.03
-0.03
0.40
0.39
CASC5
4.35
5.18
5.44
-0.04
0.43
0.44
HIST1H3B
4.87
6.59
7.29
0.19
1.44
1.71
DLGAP5
4.21
5.49
5.96
-0.04
0.68
0.73
CCNB1
4.96
6.11
6.57
0.05
0.70
0.80
TIMELESS
5.28
5.65
6.04
-0.06
0.14
0.28
SGOL1
3.99
4.95
5.07
-0.01
0.59
0.54
HMGB2
7.22
8.47
9.12
0.29
0.84
0.94
CENPE
3.83
4.78
5.17
-0.09
0.36
0.42
IQGAP3
5.49
6.18
6.25
-0.04
0.38
0.35
DEPDC1B
4.43
5.51
5.59
-0.11
0.33
0.27
MKI67
5.15
6.51
6.97
0.01
0.90
0.96
CLSPN
4.54
5.82
5.69
-0.10
0.53
0.40
STMN1
5.94
7.12
7.23
0.11
0.92
0.91
CENPW
4.30
5.64
6.14
-0.09
0.50
0.72
PBK
3.80
4.85
5.34
-0.12
0.28
0.34
FANCI
4.42
5.30
5.67
-0.01
0.46
0.48
SKA3
4.30
5.49
5.85
-0.02
0.56
0.63
LIN9
4.25
4.86
5.26
-0.09
0.14
0.22
ARHGAP11A
4.51
5.49
5.87
-0.10
0.37
0.36
DNMT1
6.61
7.25
7.39
0.31
0.71
0.72
TOP2A
5.21
6.94
7.84
0.16
1.37
1.66
KIF4B
5.74
6.30
6.38
0.04
0.48
0.72
E2F7
5.17
5.91
6.05
-0.08
0.33
0.30
ESPL1
5.26
5.77
5.90
-0.14
0.10
0.17
HJURP
5.65
6.67
6.77
0.00
0.54
0.55
EZH2
5.48
6.38
6.61
0.14
0.68
0.68
CDC7
4.15
4.97
5.27
-0.07
0.27
0.34
LMNB1
5.34
6.66
6.91
0.04
0.63
0.67
BRIP1
4.03
4.92
5.46
-0.08
0.36
0.52
CEP55
4.50
5.39
5.40
-0.15
0.25
0.18
KIF11
3.94
4.95
5.49
-0.09
0.49
0.58
WDR76
4.79
6.06
6.25
0.06
0.69
0.69
UBE2C
6.45
7.38
7.59
0.12
0.96
1.12
TUBB2B
7.07
8.17
7.90
-0.08
1.18
0.78
PTTG1
7.10
9.16
9.20
0.23
1.25
1.08
DTL
4.53
5.71
6.23
-0.05
0.56
0.69
NCAPG
4.46
5.81
6.25
0.11
0.90
0.95
KIF18A
3.62
4.73
4.73
-0.16
0.33
0.24
HIST1H2AJ
7.10
8.15
8.55
0.32
0.99
1.27
GTSE1
5.29
5.87
5.93
-0.02
0.31
0.31
CENPF
4.86
6.51
6.96
-0.02
0.90
1.00
TROAP
6.58
7.07
7.26
0.12
0.51
0.64
ASPM
4.27
5.74
6.28
-0.06
0.71
0.83
BUB1
4.78
5.78
5.79
-0.06
0.47
0.40
CIT
5.29
6.02
6.17
-0.06
0.38
0.38
RN7SL720P
3.47
4.19
4.56
-0.35
-0.14
-0.04
NEK2
4.90
5.63
5.98
-0.06
0.24
0.33
SPAG5
5.40
6.11
6.53
0.01
0.39
0.47
CDKN2C
5.32
6.21
6.37
-0.19
0.19
0.25
MYLK-AS1
6.94
6.22
6.00
0.77
0.41
0.37
HIST1H2BO
6.51
8.04
7.88
-0.08
1.06
1.32
CCND1
8.13
7.08
7.32
0.89
0.23
0.44
MELK
4.20
5.26
5.54
-0.04
0.58
0.53
KLK3
9.85
6.40
9.58
2.87
0.22
2.21
NDC80
4.20
5.54
5.82
-0.02
0.65
0.63
KLK2
9.81
6.22
9.51
2.56
0.12
2.13
HIST1H4C
7.86
9.06
9.35
1.25
2.35
2.26
ZNF615
6.56
4.71
6.84
0.89
0.06
0.96
Tsai et al. BMC Cancer (2017) 17:759
Page 15 of 21
Table 6 Differentially expressed genes common to 2 or more
LIMMA comparisons between: 9 prototypical SCPC, 9 prototypical
AdCa, and 4 atypical SCPC, with associated centroids (Continued)
Table 6 Differentially expressed genes common to 2 or more
LIMMA comparisons between: 9 prototypical SCPC, 9 prototypical
AdCa, and 4 atypical SCPC, with associated centroids (Continued)
Gene
AD
SC
AS
AD (SCAN)
SC (SCAN)
AS (SCAN)
Gene
AD
SC
AS
AD (SCAN)
SC (SCAN)
AS (SCAN)
TMPRSS2
8.25
5.02
8.01
1.74
-0.01
1.36
ENOSF1
6.27
5.51
6.90
0.48
0.19
0.75
NKX3-1
8.29
6.44
8.41
1.19
-0.24
1.25
AMELX
5.64
4.66
6.33
0.49
-0.09
0.65
PMEPA1
7.94
6.31
7.89
1.49
0.29
1.28
SLC30A4
7.90
5.40
7.18
1.54
0.09
0.91
HOXB13
8.50
5.43
8.52
1.34
0.08
1.17
THRB
5.94
5.27
6.10
0.33
0.04
0.40
KLK4
8.85
6.55
8.85
1.92
0.15
1.70
HEATR5B
5.58
4.92
5.68
0.48
0.22
0.52
SNORA59A
5.84
4.94
7.22
0.92
0.35
1.23
CROT
5.11
4.44
5.11
0.31
0.02
0.23
ACPP
8.58
4.79
8.04
2.35
0.04
1.59
SLC44A4
8.12
6.08
7.98
1.24
0.14
1.16
FOLH1
7.34
4.66
7.25
1.80
0.06
1.37
TTC19
6.74
6.02
7.26
0.79
0.43
0.87
TRGC1
9.10
4.73
9.17
1.34
-0.02
1.02
AADAT
5.86
4.61
6.39
0.62
0.13
0.85
ZNF350
6.80
4.77
6.51
0.94
0.11
0.74
ZNF616
5.48
4.65
5.71
0.37
0.16
0.49
BMPR1B
6.51
4.79
7.32
0.99
-0.01
1.28
CCDC160
4.51
2.93
4.73
0.26
-0.10
0.27
DSC2
6.29
4.94
6.98
0.57
0.02
0.93
STEAP2
8.17
5.62
7.86
2.06
0.25
1.58
PDE3B
6.41
5.10
6.27
0.60
0.08
0.58
ADPRM
5.11
4.37
5.25
0.28
-0.01
0.33
FOLH1B
7.23
4.52
7.07
1.42
-0.05
0.97
TBX3
7.10
6.03
7.56
0.63
-0.04
0.90
ZNF613
7.51
5.95
7.51
1.09
0.44
1.02
AR
7.65
6.02
7.84
1.05
0.16
1.15
RNF138P1
7.21
3.64
7.50
1.71
0.19
1.76
EEF2
9.77
8.60
9.66
2.47
1.48
2.22
GCNT2
5.33
4.64
5.97
0.22
-0.02
0.44
ZNF880
6.65
5.81
6.93
0.55
0.22
0.76
SLC45A3
8.18
6.42
8.02
1.44
0.04
1.10
HERC3
6.69
5.54
6.71
0.97
0.32
0.87
PRR16
6.75
5.41
7.02
0.72
0.10
0.81
NEDD4L
7.45
5.39
7.06
1.11
0.20
0.78
ZNF614
5.88
4.77
6.04
0.33
0.01
0.47
ARSD-AS1
6.76
5.14
6.72
1.69
0.38
1.60
TULP3
6.15
5.68
6.64
0.67
0.54
0.91
ZNF33A
5.91
5.06
6.29
0.55
0.33
0.71
MID2
6.22
5.14
6.20
0.53
0.05
0.51
MIOS
6.13
4.91
6.48
0.74
0.28
0.84
ZG16B
8.30
7.01
8.42
0.72
0.23
0.72
CPNE4
7.81
4.49
6.25
1.66
0.00
0.72
TRGC2
7.46
4.36
7.37
1.52
-0.03
1.27
ARSD
6.71
5.61
6.72
0.14
-0.20
0.14
ERGIC1
8.17
6.53
8.02
1.37
0.45
1.21
IQGAP2
5.76
4.62
5.57
0.53
0.03
0.38
NCOR1
7.25
6.36
7.50
0.92
0.52
1.03
ACACA
7.16
5.69
7.38
1.08
0.34
1.15
SPDEF
7.90
6.44
7.50
0.96
-0.02
0.66
MALT1
6.63
4.97
6.44
1.11
0.15
0.86
ALG13
5.81
5.02
6.09
0.66
0.30
0.76
KIAA1551
6.74
5.97
7.04
1.02
0.73
1.35
POTEF
7.68
5.37
8.41
1.43
0.36
1.32
KIAA1244
7.94
6.21
7.93
1.31
0.31
1.26
GRHL2
7.38
5.24
7.13
1.14
0.14
0.96
REPS2
7.03
5.62
7.20
0.75
0.05
0.71
SH3RF1
7.21
6.09
7.56
0.93
0.22
1.08
RASSF3
6.16
5.16
6.40
0.75
0.20
0.88
CREB3L4
7.20
5.96
7.23
0.94
0.20
0.90
ADIPOR2
6.74
6.21
7.09
0.53
0.33
0.73
CAMKK2
7.28
6.14
7.35
0.77
0.20
0.85
CLK4
6.11
4.96
6.33
0.62
0.25
0.69
WNK1
7.56
6.79
7.91
1.12
0.77
1.38
AMD1
7.13
5.86
7.68
1.24
0.48
1.45
ZNF649
8.19
6.41
7.90
1.37
0.48
1.19
SLC35F2
5.68
4.57
5.47
0.05
-0.24
-0.04
PPAP2A
7.68
5.97
8.46
1.54
0.43
1.85
SCMH1
7.15
6.38
7.33
0.93
0.52
1.00
C1orf116
7.44
5.93
7.40
1.03
0.20
1.01
ALDH6A1
6.38
5.63
6.33
0.58
0.16
0.51
ABCC4
7.86
5.32
6.61
1.61
0.07
0.66
PDE9A
7.15
5.59
6.73
0.73
0.02
0.54
ARHGAP6
6.48
5.43
6.79
0.50
-0.11
0.55
KDM5A
5.97
5.32
6.41
0.44
0.27
0.67
RAB27B
5.92
4.77
6.09
0.65
0.09
0.65
ANKRD50
6.73
5.65
7.62
0.90
0.50
1.52
ZNF432
6.24
5.02
6.49
0.68
0.18
0.72
C1orf21
7.85
6.74
8.10
1.02
0.45
1.16
Tsai et al. BMC Cancer (2017) 17:759
Page 16 of 21
Table 6 Differentially expressed genes common to 2 or more
LIMMA comparisons between: 9 prototypical SCPC, 9 prototypical
AdCa, and 4 atypical SCPC, with associated centroids (Continued)
Gene
AD
SC
AS
AD (SCAN)
SC (SCAN)
AS (SCAN)
GNB2L1
10.03
8.98
10.40
1.33
1.00
1.49
RANBP3L
5.85
4.26
6.10
0.71
0.00
0.76
IGBP1
6.68
6.16
6.97
0.63
0.40
0.79
PPAPDC1B
7.17
6.12
7.02
0.78
0.11
0.63
MSMB
8.43
4.45
8.34
2.39
0.03
1.94
C12orf4
5.08
4.50
5.45
0.33
0.09
0.50
ZNF577
7.30
5.57
6.78
1.16
0.28
0.90
ZNF841
6.67
5.55
6.69
1.15
0.51
1.11
RN7SL97P
3.75
4.77
3.57
-0.45
-0.16
-0.54
POTEH
8.09
4.74
9.36
POTEH-AS1
7.54
5.60
7.79
FAM115A
6.88
6.04
6.98
Legend: Cohorts of 9 prototypical adenocarcinomas, 9 prototypical SCPCs, and
4 atypical SCPCs were formed from meta-9 clusters after removing outliers,
mixed adenocarcinomas, adenocarcinomas associated with NE differentiation,
and samples archived over 10 years in FFPE. Differentially expressed genes
were calculated by LIMMA for all possible pair-wise comparisons of cohorts,
and filtered for genes shared by 2 or more comparisons. This resulted in 176
genes consisting of 79 genes (77 up, 2 down) differentially expressed in
common between either prototypical SCPCs or atypical SCPCs versus prototypical adenocarcinomas, and 97 genes (1 up, 96 down) differentially expressed in
common between prototypical SCPCs and either prototypical adenocarcinomas
or atypical SCPCs. Centroids for each cohort (values in the table) were formed for
this gene-set and transferred to the GRID database under SCAN normalization for
use in a nearest-centroid classifier model
tumors with shared clonal driver alterations. On the
other hand, 56104_A may have contained an admixed
population of SCPC cells as discussed earlier, and if so,
it is possible its true adenocarcinoma component might
no longer be prognostic.
We transferred the 3-centroid classifier to the GenomeDx GRID® by reformulating centroids under SCAN
(Table 6), a single-sample normalization method compatible with routine clinical lab environments although
susceptible to batch effects. JHU-FFPE samples were
handled relatively uniformly, yet demonstrated notable
effects based on RNA processing date (Additional file 3:
Figure S8); nevertheless SCAN (compared to RMA) empirically produced identical classification of JHU-FFPE,
suggesting robustness. We applied the 3-centroid model
to selected GRID® adenocarcinoma cohorts, and found
that 2 Prospective (0.09%), no JHU-RP (0%), and 2 Mayo
(0.3%) samples classified as prototypical SCPC, and 4
Prospective (0.17%), 2 JHU-RP (0.6%), and 10 Mayo
(1.3%) samples classified as atypical SCPC (Fig. 6). Both
JHU-RP samples with atypical SCPC classification were
part of a distinct cluster of 4 samples featuring the highest CCP and 3 lowest ARS scores among JHU-RP, and
all 4 subsequently developed metastases. Mayo had
greater proportions classifying as SCPC but included
suspected false positives far from training samples with
low correlations to all 3 centroids. In the earlier meta-12
analysis (Fig. 2), the Mayo-FFPE dataset similarly exhibited multiple samples with low correlations to both
meta-12 centroids. Mayo samples overall also had
weaker correlations to the adenocarcinoma centroid
(r=0.82) versus samples from Prospective (r=0.92) or
JHU-RP (r=0.89).
We remark that our JHU-FFPE datasets had variable
archive ages (Table 3), which potentially impacted expression and is discussed further in the next section.
SCPCs and adenocarcinomas were at least relatively balanced (mean 3.6 and 3.0 years after removing the oldest
sample), ideally minimizing differential bias. By contrast,
cohorts demonstrated a few notable differences in tissue
sources, for example pure adenocarcinomas were all biopsies. This potentially affected both expression and differential expression, however we at least found no
significant differences by LIMMA between biopsies and
TURPs (the most common sources) when restricted to
SCPCs, or among all samples.
FFPE introduces an extra source of variability to the JHUFFPE dataset
Principal components analysis of JHU-FFPE, considering
all genes for an unsupervised approach, demonstrated
rough separation of phenotypes, intermediate behavior
of mixed adenocarcinomas, and discordant behavior of
the meta-9 outlier samples (57914, 57634) (Fig. 7). Of all
33 principal components, the second (PC2) best separated phenotypes (AUC 86.3%) and had the greatest
magnitude correlations to each of CCP (r = -0.88), ARS
(r=0.69), and neuronal phenotype scores (r=-0.54), with
higher correlation to the difference of ARS and CCP
(r=0.93). Indeed, under GSEAPreranked applied to the
PC2 gene coefficients, NELSON-RESPONSE-TO-ANDROGEN-UP was the #2 most up-regulated gene-set
(out of 3739 gene-sets from the Molecular Signatures
Database curated collection C2 after size filters), while
the top down-regulated gene-sets were largely cell cycle
related (ROSTY-CERVICAL-PROLIFERATION-CLUSTER was #1, REACTOME-CELL-CYCLE was the top
Reactome pathway at #28, and KEGG-CELL-CYCLE was
the top KEGG pathway at #82). By contrast, in principal
component analyses of the 4 frozen tissue primary or
xenograft NEPC datasets, the first principal component
(PC1) always separated NEPCs from adenocarcinomas
(AUC 100%) (Additional file 3: Figure S9), and moreover
always had the greatest magnitude correlations to ARS
(r=-0.76 to -0.98), neuronal phenotype (r=0.87 to 0.98),
and CCP scores (r=0.57 to 0.93), with the exception of
CCP in 1/4 datasets.
Thus in JHU-FFPE, its first principal component (PC1,
representing the direction of greatest variability) appeared to include a different source of variability. While
Tsai et al. BMC Cancer (2017) 17:759
Page 17 of 21
Fig. 6 Nearest 3-centroid classification of GRID® RP adenocarcinoma cohorts. We assessed performance of nearest centroid classification in GRID®
RP adenocarcinoma cohorts Prospective (N=2993), JHU-RP (N=355), and Mayo (N=780) relative to centroids AD (prototypical adenocarcinoma), SC
(prototypical SCPC), and AS (atypical SCPC). Two Prospective (0.09%) and no JHU-RP (0%) samples were classified as prototypical SCPC while 4
Prospective (0.17%) and 2 JHU-RP (0.6%) samples were classified as atypical SCPC. A greater proportion of Mayo samples (1.6%) were classified as
SCPC but likely included false positives with low correlations to all 3 centroids
still demonstrating moderate correlations to ARS (r=-0.62)
and neuronal phenotype (r=0.46) and to lesser degree to
CCP (r=-0.20), PC1 did not separate phenotypes very well
(AUC 61.7%), and its greatest magnitudes were notably
from SCPCs of oldest FFPE age (54674, 56321_S), both archived 14-16 years (versus 0-6 years for other SCPCs).
There was moderate correlation between PC1 and archive
age (r=0.50), and PC1 modestly differentiated older
archived samples (> 3y in FFPE) versus newer samples
(p=0.04). We also tested whether PC1 was associated with
sample type (biopsies versus TURPs) but did not find
evidence for this (p=0.48). We applied GSEAPreranked to
better characterize the source of variability captured
by PC1. The most down-regulated gene-sets were
related to RNA translation (REACTOME-SRPDEPENDENT-COTRANSLATIONAL-TARGETING-
Tsai et al. BMC Cancer (2017) 17:759
Page 18 of 21
Fig. 7 Principal components analysis of JHU-FFPE. SCPCs and adenocarcinomas were generally separated by principal components analysis. Mixed
adenocarcinomas exhibited roughly intermediate behavior, although we questioned whether 56104_A contained an accidental admixture with its
neighboring small cell component 56104_S. One SCPC (57915) and one pure adenocarcinoma (57634) clustered with opposite phenotypes, similar to meta-9 clustering. Among SCPCs with known AR or PSA-positivity, two clustered side by side in a relatively intermediate territory (57915,
56107) while the third was loosely in the vicinity (57912_S). Of all principal components, PC2 separated SCPCs from adenocarcinomas best (AUC
86%) and was highly correlated to the difference between ARS and CCP (r=0.93). By contrast in frozen tissue primary and xenograft NEPC datasets, respective PC1's separated SCPCs from adenocarcinomas best (AUC 100%) and was highly correlated to the difference between CCP and
ARS (r=0.75-0.98) (Supp Figure 9). Thus in JHU-FFPE, PC1 represented a different source of greatest variability. Examination of its top coefficients
by magnitude revealed that PC1 was highly anti-correlated to the average expression of various ribosomal subunits (r = -0.93) including RPL19,
known to be an effective reference gene. Two SCPCs (56321_S, autopsy 54674) had the largest PC1 magnitudes and were archived 14-16 years
(versus 0-6 years for other SCPCs), perhaps reflecting higher levels of RNA degradation; however the oldest adenocarcinoma (56321_A) did not exhibit this trend
TO-MEMBRANE was #1 while KEGG-RIBOSOME was
the top KEGG pathway at #5). Eighteen of the top 100
gene coefficients by magnitude corresponded to ribosomal
protein subunits, with PC1 highly anti-correlated to their
average gene expression (r=-0.93). These genes included
RPL19, which has been used previously in FFPE gene expression analysis to normalize sample input [40]. Upregulated gene-sets were considerably rarer (47 versus
2104 with nominal p-val < 0.01), and included epigeneticrelated gene-sets (e.g., KONDO-PROSTATE-CANCERWITH-H3K27ME3 was #3).
Given the possible influence of the variable archive
ages in JHU-FFPE on gene expression, we attempted to
investigate individual gene performance. Since the exon
array contained probe-sets for almost every exon of a
gene, probe-sets targeting the same transcript ideally behaved concordantly, and we defined correlation strength
(CS) as average correlation between probe-sets targeting
the same gene and restricted here to genes with 10 or
more probe-sets. CS was considerably weaker in FFPE
datasets versus a frozen tissue dataset, with decline related to archive age and presumably to RNA degradation
(Additional file 3: Figure S10). In JHU-FFPE, CS was
lower for neuronal phenotype genes (mean 0.24) versus
cell cycle progression genes (0.36) or AR-signaling genes
(0.56), consistent with the relative paucity of neuronal
Tsai et al. BMC Cancer (2017) 17:759
genes in differential expression analysis. For instance,
CHGA had relatively weak CS versus frozen tissue
(CS=0.31 versus 0.77), while androgen-related genes
(KLK3, KLK2, ACPP) had the highest CS (0.86-0.88) and
standard deviations (1.90-1.95) (Additional file 3: Figure
S11). Accuracy in FFPE has been reported to improve
upon using each gene’s most variable probe-set [16].
Compatible with this, CS increased on average by 0.14
in JHU-FFPE upon restricting to each gene’s 5 most variable probe-sets, likely through exclusion of weakly binding, oversaturated, or unused alternative exon probesets. We also investigated expression in JHU-FFPE of
the gene CCEPR, elevated in 88% of NEPCs in the metaanalysis. CS no longer applied since only one exon
probe-set (3290641) targeted CCEPR. This probe-set did
not differentiate between phenotypes (nominal p=0.54
compared with its neighbor PHYHIPL p=0.05), had relatively narrow dynamic range, and lost correlation to
PHYHIPL (r=0.17 versus 0.71 in NIH Roadmap data),
suggesting poor performance in FFPE.
Discussion
We utilized an outlier-based meta-analysis approach to
study prototypical high-grade NEPC across multiple frozen tissue datasets, although more sophisticated
methods have also been described [41]. We believe
meta-12 centroids may provide a useful tool to assess
for prototypical high-grade NEPC status given high quality frozen tissue expression data, however we also found
evidence of highly similar meta-12 centroid correlation
profiles between prototypical high-grade NEPC and
small cell carcinomas from lung and possibly other sites,
reflecting the challenge of determining site of origin in
small cell carcinoma of unknown primary. Although we
did not validate individual genes in this study, e.g. via
PCR or RNA in-situ hybridization, we believe meta-12
genes are strong candidates for potential diagnostic
markers, either through RNA or protein; in a previous
study, we found that cyclin D1 performed effectively as a
negative IHC marker of SCPC [21], and further evaluation of selected meta-12 genes, both up and down, is
currently underway.
We provided one of the largest gene expression datasets to date of primary SCPC and high-grade adenocarcinoma, albeit in FFPE, including significant proportions
of mixed SCPCs (63%), slightly above estimates from the
literature (40-50%), and SCPCs with preserved AR signaling (31%), slightly above reported frequencies of ARpositive or PSA-positive SCPC (17-20%) [5, 6]. Based on
meta-signature-derived subgroups of this dataset, we
developed a nearest 3-centroid classifier for primary
samples profiled by exon array. One adenocarcinoma,
with highly aggressive metastatic progression described
in a previous case report, was classified as prototypical
Page 19 of 21
SCPC. Two mixed adenocarcinomas (40%) were additionally classified as SCPC (1 prototypical, 1 atypical),
suggesting that mixed cases might be enriched for SCPC
signatures in their adenocarcinoma components, due
perhaps to shared clonal origins although possibly false
positives from admixture. The classifier may thus provide utility for detection of mixed cases in the biopsy
setting, where only the adenocarcinoma component
might get sampled.
Rare adenocarcinomas among GRID® cohorts were
also classified as SCPCs under the 3-centroid model,
similar to behavior of the JHU-FFPE outlier or unusual
mixed adenocarcinomas. Percentages of such GRID®
cases (0.3-0.6%, excluding Mayo due to suspected false
positives) were generally below the presumptive frequency of SCPC (often reported as 0.5-2%) [42], roughly
in line with expectations given that GRID® cohorts consisted of RP adenocarcinomas and inherently excluded
SCPCs. We suspect these cases may correspond to diagnostically challenging poorly differentiated tumors, misdiagnosed samples, mixed adenocarcinomas, or
fortuitously sampled occult SCPC components, however
further investigation is necessary. Cases were also too
scarce for meaningful Kaplan-Meier analysis, however
the 2 JHU-RP cases with atypical SCPC classification
belonged to a cluster of 4 cases that all subsequently developed metastases. Thus, we speculate the classifier
may detect unusually aggressive cases and potentially
have prognostic relevance.
One main limitation of our study was the lack of an
independent validation set of primary SCPCs to test the
3-centroid classifier. In contrast to the multiple large
GRID® adenocarcinoma cohorts, few SCPCs have been
profiled on the GRID®, due to rarity of diagnosis and also
scarcity of tissue, given that SCPC patients have traditionally been treated with systemic therapy (usually after
biopsy-based diagnosis) and not with RP. Moreover, patients found to have unexpected SCPC upon RP would
typically have little need for prognostic clinical RNA expression testing on the GRID®. Consequently we were
not aware of other exon array datasets with annotated
SCPCs. However, it was at least encouraging that the 2
JHU-FFPE SCPCs excluded from training due to old
archive age were indeed classified as prototypical SCPCs
despite their outlier PCA trends.
Another limitation of the classifier was its derivation
from relatively few atypical SCPCs, indicating a need for
more samples to definitively establish whether cases
such as 57912_S with a uniform hybrid IHC pattern and
small cell morphology are indeed a true subcategory
with common underlying genomic properties. Similarly,
the pattern of low ARS without neuronal overexpression may deserve a separate category in the primary or metastatic setting, but also requires more
Tsai et al. BMC Cancer (2017) 17:759
examples. Such non-standard cases, often manifesting as
hybrid or unusual IHC profiles, can be puzzling for pathologists to evaluate. The ultimate clinical question will
be whether these potential expression-based subtypes
have prognostic relevance or predict response to therapy. Anecdotally, the outlier adenocarcinoma in our
JHU-FFPE dataset with low ARS and non-elevated neuronal expression had unusually aggressive metastatic progression described in a case report [32]. We did not
have access to outcome data of the atypical hybrid
SCPCs in our dataset and were not aware of other hybrid SCPCs in the literature, however rare adenocarcinoma cases with aggressive progression and hybrid IHC
co-expression of AR and chromogranin have been reported [9, 10]. There is also increasing evidence for
lineage plasticity between adenocarcinoma and neuroendocrine phenotypes in metastatic prostate cancer, induced upon anti-androgen therapy and partially reversed
through epigenetic interventions such as EZH2 inhibition [43–45]. Our atypical hybrid SCPCs, as well as the
outlier adenocarcinoma, overexpressed epigenetic genes
including EZH2. We hope increased recognition of these
unusual phenotypes will lead to larger collections of
cases and eventual clarity on their clinical relevance.
Conclusions
Meta-analysis generates a robust signature of prototypical high-grade NEPC, with close resemblance to small
cell lung cancer. Atypical NEPC potentially includes a
hybrid subcategory exhibiting preserved AR-signaling
and a non-neuronal subcategory with AR loss and high
proliferation but without expression of neuroendocrine
markers that may overlap with adenocarcinomas. In the
primary setting, FFPE material may be used to generate
a classifier of SCPC incorporating disease heterogeneity,
with potential prognostic implications. However, further
testing with a proper validation set is required.
Additional Files
Additional file 1: Additional methods on bioinformatic processing and
analysis, and additional legends. (DOCX 49 kb)
Additional file 2: Additional tables on NEPC gene-lists, meta-9 genes,
and LIMMA comparisons. (XLSX 266 kb)
Additional file 3: Additional figures on meta-12 scores, AR signaling
versus AR / CCP / RAB3B, mixed tumors, REST exons, batch effects, principal
components, and correlation strengths. (PDF 13484 kb)
Abbreviations
AdCa (or Ad): Adenocarcinoma; ARS: AR-signaling (gene signature); CCP: Cell
cycle progression (gene signature); CRPC: Castration-resistant prostate cancer;
FFPE: Formalin-fixed paraffin-embedded; LCNEC: Large cell neuroendocrine
carcinoma; LOOCV: Leave-one-out cross-validation; NED: Neuroendocrine
differentiation; NEPC: Neuroendocrine prostate cancer; SCLC: Small cell lung
cancer; SCPC: Small cell prostatic cancer
Page 20 of 21
Acknowledgements
The authors would like to thank Angelo M. De Marzo for contributing several
cases to the study, Luigi Marchionni for comments and advice, and the
reviewers for valuable suggestions.
Funding
Funding was provided in part by NIH/NCI Prostate SPORE P50CA58236 (TLL).
None of the funding bodies had any part in the design of the study and
collection, analysis, and interpretation of data, or in writing the manuscript.
Availability of data and materials
Gene expression datasets used in this study are available from the Gene
Expression Omnibus database GEO (microarrays), cBioPortal (RNA-seq), or the
corresponding author on reasonable request. Inquiries regarding the GRID
Prospective dataset can be directed to authors from GenomeDx.
Authors’ contributions
HKT, ED, and TLL conceived of the study. HKT, MA, ED, and TLL drafted the
manuscript. HKT and TLL assessed the pathology. JL, MA, NE, and ED generated
the gene expression data. HKT, JL, MA, and NE carried out the computational
analyses. All authors participated in design of the study and interpretation of
the data. All authors reviewed and approved the manuscript.
Ethics approval and consent to participate
Informed consent to use the tissue samples in this study was waived by the
John Hopkins School of Medicine Institutional Review Board.
Consent for publication
Not applicable.
Competing interests
JL, MA, NE and ED are employees of GenomeDx Biosciences; TLL has received
research funding from GenomeDx. HKT declares no competing interests.
Publisher’s Note
Springer Nature remains neutral with regard to jurisdictional claims in
published maps and institutional affiliations.
Author details
1
Department of Pathology, Johns Hopkins University School of Medicine,
Baltimore, MD, USA. 2GenomeDx Biosciences, Vancouver, British Columbia,
Canada. 3Department of Oncology, Johns Hopkins University School of
Medicine, Baltimore, MD, USA. 4Present address: Department of Pathology,
Brigham and Women’s Hospital, Boston, MA, USA.
Received: 12 December 2016 Accepted: 30 October 2017
References
1. Epstein, JI.,et al., Proposed morphologic classification of prostate cancer
with neuroendocrine differentiation. Am J Surg Pathol, 2014. 38(6):
p. 756-767.
2. Wang HT, et al. Neuroendocrine prostate cancer (nepc) progressing from
conventional prostatic adenocarcinoma: factors associated with time to
development of nepc and survival from nepc diagnosis-a systematic review
and pooled analysis. J Clin Oncol. 2014;32(30):3383–90.
3. Tan, HL, et al., Rb loss is characteristic of prostatic small cell neuroendocrine
carcinoma. Clin Cancer Res, 2014. 20(4): p. 890-903.
4. Lapuk AV, et al. From sequence to molecular pathology, and a mechanism
driving the neuroendocrine phenotype in prostate cancer. J Pathol.
2012;227(3):286–97.
5. Yao JL, et al. Small cell carcinoma of the prostate: an immunohistochemical
study. Am J surg pathol. 2006;30(6):705–12.
6. Wang W, Epstein JI. Small cell carcinoma of the prostate. A morphologic
and immunohistochemical study of 95 cases. Am J Surg Pathol. 2008;32(1):
65–71.
7. Kumar A, et al. Substantial interindividual and limited intraindividual
genomic diversity among tumors from men with metastatic prostate
cancer. Nat Med. 2016;22(4):369–78.
8. Beltran H, et al. Divergent clonal evolution of castration-resistant
neuroendocrine prostate cancer. Nat Med. 2016;22(3):298–305.
Tsai et al. BMC Cancer (2017) 17:759
9.
10.
11.
12.
13.
14.
15.
16.
17.
18.
19.
20.
21.
22.
23.
24.
25.
26.
27.
28.
29.
30.
31.
32.
33.
34.
35.
36.
Roudier MP, et al. Metastatic conventional prostatic adenocarcinoma with
diffuse chromogranin a and androgen receptor positivity. J Clin Pathol.
2004;57(3):321–3.
Wu C, et al. Integrated genome and transcriptome sequencing identifies a novel
form of hybrid and aggressive prostate cancer. J Pathol. 2012;227(1):53–61.
Beltran H, et al. Molecular characterization of neuroendocrine prostate cancer
and identification of new drug targets. Cancer Discov. 2011;1(6):487–95.
Lin D, et al. High fidelity patient-derived xenografts for accelerating prostate
cancer discovery and drug development. Cancer Res. 2014;74(4):1272–83.
Tzelepi V, et al. Modeling a lethal prostate cancer variant with small-cell
carcinoma features. Clin Cancer Res. 2012;18(3):666–77.
Zhang X, et al. Srrm4 expression and the loss of rest activity may promote
the emergence of the neuroendocrine phenotype in castration-resistant
prostate cancer. Clin Cancer Res. 2015;21(20):4698–708.
Hansel DE, et al. Shared tp53 gene mutation in morphologically and
phenotypically distinct concurrent primary small cell neuroendocrine
carcinoma and adenocarcinoma of the prostate. Prostate. 2009;69(6):603–9.
Gravendeel LA, et al. Gene expression profiles of gliomas in formalin-fixed
paraffin-embedded material. Br J Cancer. 2012;106(3):538–45.
Abdueva D, et al. Quantitative expression profiling in formalin-fixed paraffinembedded samples by affymetrix microarrays. J Mol Diagn. 2010;12(4):409–17.
Hieronymus H, et al. Gene expression signature-based chemical genomic
prediction identifies a novel class of hsp90 pathway modulators. Cancer cell.
2006;10(4):321–30.
Cuzick J, et al. Prognostic value of an rna expression signature derived from
cell cycle proliferation genes in patients with prostate cancer: a
retrospective study. Lancet Oncol. 2011;12(3):245–55.
Ritchie ME, et al. Limma powers differential expression analyses for rnasequencing and microarray studies. Nucleic Acids Res. 2015;43(7):E47.
Tsai H, et al. Cyclin d1 loss distinguishes prostatic small-cell carcinoma from
most prostatic adenocarcinomas. Clin Cancer Res. 2015;21(24):5619–29.
Travis WD. Update on small cell carcinoma and its differentiation from
squamous cell carcinoma and other non-small cell carcinomas. Mod Pathol.
2012;(25 suppl 1):S18–30.
Dalela D, et al. Contemporary role of the decipher(r) test in prostate cancer
management: current practice and future perspectives. Rev Urol.
2016;18(1):1–9.
Karnes RJ, et al. Validation of a genomic classifier that predicts metastasis
following radical prostatectomy in an at risk patient population. J Urol.
2013;190(6):2047–53.
Erho N, et al. Discovery and validation of a prostate cancer genomic
classifier that predicts early metastasis following radical prostatectomy. Plos
One. 2013;8(6):E66855.
Ross AE, et al. Tissue-based genomics augments post-prostatectomy risk
stratification in a natural history cohort of intermediate- and high-risk men.
Eur Urol. 2016;69(1):157–65.
Glass AG, et al. Validation of a genomic classifier for predicting postprostatectomy recurrence in a community based health care setting. J Urol.
2016;195(6):1748–53.
Grasso CS, et al. The mutational landscape of lethal castration-resistant
prostate cancer. Nature. 2012;487(7406):239–43.
Sircar K, et al. Mitosis phase enrichment with identification of mitotic
centromere-associated kinesin as a therapeutic target in castration-resistant
prostate cancer. Plos One. 2012;7(2):E31259.
Yang M, et al. Long noncoding rna cche1 promotes cervical cancer cell
proliferation via upregulating pcna. Tumour Biol. 2015;36(10):7615–22.
Adler P, et al. Mining for coexpression across hundreds of datasets using
novel rank aggregation and visualization methods. Genome biol.
2009;10(12):R139.
Haffner MC, et al. Diagnostic challenges of clonal heterogeneity in prostate
cancer. J Clin Oncol. 2015;33(7):E38–40.
Tan PY, et al. Integration of regulatory networks by nkx3-1 promotes androgendependent prostate cancer survival. Mol cell biol. 2012;32(2):399–414.
Rajan P, et al. Next-generation sequencing of advanced prostate cancer
treated with androgen-deprivation therapy. Eur urol. 2014;66(1):32–9.
Sharma A, et al. The retinoblastoma tumor suppressor controls androgen
signaling and human prostate cancer progression. J clin invest.
2010;120(12):4478–92.
Akamatsu S, et al. The placental gene peg10 promotes progression of
neuroendocrine prostate cancer. Cell rep. 2015;12(6):922–36.
Page 21 of 21
37. Palm K, Metsis M, Timmusk T. Neuron-specific splicing of zinc finger transcription
factor rest/nrsf/xbr is frequent in neuroblastomas and conserved in human,
mouse and rat. Brain res mol brain res. 1999;72(1):30–9.
38. Shimojo M, et al. The small cell lung cancer-specific isoform of re1-silencing
transcription factor (rest) is regulated by neural-specific ser/arg repeatrelated protein of 100 kda (nsr100). Mol Cancer Res. 2013;11(10):1258–68.
39. Greytak SR, et al. Accuracy of molecular data generated with ffpe
biospecimens: lessons from the literature. Cancer Res. 2015;75(8):1541–7.
40. Yang W, et al. Direct quantification of gene expression in homogenates of
formalin-fixed, paraffin-embedded tissues. Biotechniques. 2006;40(4):481–6.
41. Hughey JJ, Butte AJ. Robust meta-analysis of gene expression using the
elastic net. Nucleic acids res. 2015;43(12):E79.
42. Helpap B, Kollermann J, Oehler U. Neuroendocrine differentiation in
prostatic carcinomas: histogenesis, biology, clinical relevance, and future
therapeutical perspectives. Urol int. 1999;62(3):133–8.
43. Kleb B, et al. Differentially methylated genes and androgen receptor reexpression in small cell prostate carcinomas. Epigenetics. 2016;11(3):184–93.
44. Ku SY, et al. Rb1 and trp53 cooperate to suppress prostate cancer lineage
plasticity, metastasis, and antiandrogen resistance. Science.
2017;355(6320):78–83.
45. Mu P, et al. Sox2 promotes lineage plasticity and antiandrogen resistance in
tp53- and rb1-deficient prostate cancer. Science. 2017;355(6320):84–8.
Submit your next manuscript to BioMed Central
and we will help you at every step:
• We accept pre-submission inquiries
• Our selector tool helps you to find the most relevant journal
• We provide round the clock customer support
• Convenient online submission
• Thorough peer review
• Inclusion in PubMed and all major indexing services
• Maximum visibility for your research
Submit your manuscript at
www.biomedcentral.com/submit