Perioperative blood transfusion does not affect recurrence-free and overall survivals after curative resection for intrahepatic cholangiocarcinoma: A propensity score matching analysis
Bạn đang xem bản rút gọn của tài liệu. Xem và tải ngay bản đầy đủ của tài liệu tại đây (713.29 KB, 11 trang )
Zhou et al. BMC Cancer (2017) 17:762
DOI 10.1186/s12885-017-3745-z
RESEARCH ARTICLE
Open Access
Perioperative blood transfusion does not
affect recurrence-free and overall survivals
after curative resection for intrahepatic
cholangiocarcinoma: a propensity score
matching analysis
Pei-Yun Zhou1,2†, Zheng Tang1,2†, Wei-Ren Liu1,2†, Meng-Xin Tian1,2, Lei Jin1,2, Xi-Fei Jiang1,2, Han Wang1,2,
Chen-Yang Tao1,2, Zhen-Bin Ding1,2, Yuan-Fei Peng1,2, Shuang-Jian Qiu1,2, Zhi Dai1,2, Jian Zhou1,2,3, Jia Fan1,2,3
and Ying-Hong Shi1,2*
Abstract
Background: Whether perioperative blood transfusions (PBTs) adversely influence oncological outcomes for
intrahepatic cholangiocarcinoma (ICC) patients after curative resection remains undetermined.
Methods: Of the 605 patients who underwent curative liver resection for ICC between 2000 and 2012, 93 received
PBT. We conducted Cox regression and variable selection logistic regression analyses to identify confounding
factors of PBT. Propensity score matching (PSM) and Cox regression analyses were used to compare the overall
survival (OS) and disease-free survival (DFS) between the patients with or without PBT.
Results: After exclusion, 93 eligible patients (15.4%) received PBT, compared with 512 (84.6%) who did not receive PBT;
the groups were highly biased in terms of the propensity score (PS) analysis (0.096 ± 0.104 vs. 0.479 ± 0.372, p < 0.001).
PBT was associated with an increased risk of OS (HR: 1.889, 95% CI: 1.446–2.468, p < 0.001) and DFS (HR: 1.589, 95% CI:
1.221–2.067, p < 0.001) in the entire cohort. After propensity score matching (PSM), no bias was observed between the
groups (PS,0.136 ± 0.117 VS. 0.193 ± 0.167, p = 0.785). In the multivariate Cox analysis, PBT was not associated with
increased risks of OS (HR: 1.172, 95% CI: 0.756–1.816, p = 0.479) and DFS (HR: 0.944, 95% CI: 0.608–1.466, p = 0.799).
After propensity score adjustment, PBT was still not associated with OS or DFS after ICC curative resection.
Conclusions: The present study found that PBT did not affect DFS and OS after curative resection of ICC.
Keywords: Intrahepatic cholangiocarcinoma, Hepatectomy, Perioperative blood transfusion, Overall survival,
Disease-free survival
* Correspondence:
†
Equal contributors
1
Department of Liver Surgery, Liver Cancer Institute, Zhongshan Hospital,
Fudan University, 180 FengLin Road, Shanghai 200032, China
2
Key Laboratory of Carcinogenesis and Cancer Invasion of Ministry of
Education, Shanghai, China
Full list of author information is available at the end of the article
© The Author(s). 2017 Open Access This article is distributed under the terms of the Creative Commons Attribution 4.0
International License ( which permits unrestricted use, distribution, and
reproduction in any medium, provided you give appropriate credit to the original author(s) and the source, provide a link to
the Creative Commons license, and indicate if changes were made. The Creative Commons Public Domain Dedication waiver
( applies to the data made available in this article, unless otherwise stated.
Zhou et al. BMC Cancer (2017) 17:762
Background
Cholangiocarcinoma is the second most prevalent primary liver tumor worldwide, and its 3-year survival rate
ranges from 20% to 60% in different regions due to difficulties in its diagnosis and poor responses to current
therapies [1–5]. Surgical resection is the only feasible
treatment modality that has a curative outcome for patients. Despite fast-paced improvements in surgical technique and experience, there is still a risk of massive
blood loss and a subsequent need for blood transfusion.
Blood transfusion is a double-edged clinical weapon that
maintains blood volume to control hemorrhagic shock,
supplies blood components to improve oxygen carrying
capacity of blood, and regulates hemostasis by increasing
blood coagulation factors. However, transfusions may
cause short or severe complications including allergic reactions, hemolytic reactions, and immunosuppression.
Several recent studies found PBT may be associated with
worse postoperative outcomes for cancer patients [6–8].
However, without random controlled trials, it was debated
whether systemic and statistic bias existed that led to this
unreliable sign. Indeed, some reports argued that PBT has
no impact on tumor recurrence and long-term mortality
[9–12]. In this study, we summarize more than a decade
of data at our institute and implemented a propensity
score matching system to investigate the association between PBT and long-term outcome in ICC patients.
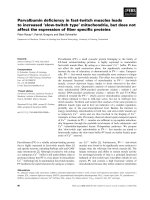
Fig. 1 Study flow chart
Page 2 of 11
Methods
Participants and criteria
The study enrolled 758 consecutive ICC patients who
underwent curative surgery between 2000 and 2012 at the
Liver Cancer Institute, Zhongshan Hospital, Fudan
University. All resections were performed or supervised by
experienced hepatobiliary surgeons and used standardized
procedures [13]. Additionally, all surgical specimens were
confirmed by pathologic histology [2]. The following exclusion criteria were used: pre-interventional therapy before
liver surgery (n = 35, 27 underwent transcatheter arterial
chemoembolization (TACE), 1 underwent radiofrequency
ablation(RFA), 2 underwent radiotherapy, and 5 underwent
RFA plus TACE); hemoglobin less than 70 g/L (n = 1);
widespread metastasis (n = 4); TNM staging IVb (n = 89);
missing data of hemoglobin before surgery (n = 14); missing data of blood transfusion (n = 5); and clinical source
loss (n = 5) (Fig. 1). The eligible 605 patients included 93
cases who received perioperative allogeneic blood transfusion and 512 cases without transfusion. We defined the
perioperative period as the time between the third
preoperative day and the seventh postoperative day.
Data source
All data on the patients’ demographics, morbidity, postoperative mortality, and histological results were obtained
from the hospital medical system. The TNM classification
Zhou et al. BMC Cancer (2017) 17:762
was based on the AJCC Cancer Staging Manual, Seventh
edition (2010) by springer New York, Inc. All patients
were followed-up regularly at outpatient clinics and the
Liver Cancer Institute, Zhongshan Hospital, Fudan University. The follow-up results were obtained via telephone
by an experienced researcher working in the Liver Cancer
Institute. All patients were regularly followed in the outpatient department and tumor markers were measured
every 3 months during the first 3 years and thereafter
every 6 months until the study end or loss of follow-up.
An abdominal ultrasound was performed every 3 months,
and abdominal computed tomography or MRI was
performed 6 months postoperatively or upon suspected
recurrence. The median follow-up time was 20 months
(range 0–134 months), and the end follow-up time was
November 2015. The primary research endpoint was the
death of patient or the end follow-up time, and the
secondary endpoint was follow-up dropout. The OS was
defined as the period from surgery until death due to any
cause. DFS was defined as the duration from surgery until
the date of intrahepatic cholangiocarcinoma recurrence.
The transfusion of any blood visible components including red blood cells and blood plasma were considered
blood transfusion. Blood management, including processing, testing, and transporting, were quality controlled by
Shanghai Blood Center. The ABO and Rh status as well as
blood cross matching were conducted by the blood
department of Zhongshan hospital [14].
Variables and statistics
The categorical variables are shown as whole numbers and
proportions, and the continuous variables are described as
the means with standard deviation as appropriate. Twosided p values of <0.05 were considered statistically significant. Statistical analyses were performed using IBM SPSS
Statistics 22 and R statistical software. To compare continuous variables that followed Gaussian distributions, t tests
were used; the K-Independent-Samples Test (Kruskal Wallis
H(K) test) was used for those variables did not follow Gaussian distributions. To compare proportional variables, a TwoIndependent-Samples Test (Mann-Whitney U test) was used,
and a Two-Related-Samples Test (Wilcoxon Signed Ranks
Test) was applied to matched propensity scores [15]; all
missing data are reflected in the available data [16]. We examined the following parameters: age, gender, preoperative
hemoglobin (Hb), platelets (PLT), aspartate aminotransferase
(AST), alanine transaminase (ALT), alpha fetoprotein (AFP),
carcinoembryonic antigen (CEA), carbohydrate antigen 19–9
(CA19–9), prothrombin time (PT), international normalized
ratio (INR), hepatitis B surface antigen (HBsAg), antihepatitis C virus (Anti-HCV), tumor maximum dimension
(TMD), tumor node metastasis (TNM), intraoperative blood
loss (IBL), degree of differentiation (DD), and transcatheter
arterial chemoembolization (TACE). The confounders were
Page 3 of 11
measured accurately using univariate Cox regression through
an enter variable selection procedure. The full variable
selection logistic regression was used to specify a mathematical relationship for the variables related to blood transfusion
[17]. The regression models were based on Akaike’s information criterion. We then adjusted for further confounding parameters in the propensity score analysis. This is a useful
technique that focuses on the relationship between confounders and the treatment [18, 19]. The “PS MATCHING
3.03” and “SPSS Statistics R Essentials 22.0” and “R-2.15.3win” R packages [20] were used to perform the matching
propensity score analysis. The matching confounders was
estimated by the regression models described above, and
balance matching showed the values of absolute standard
mean difference (SMD). The demographics and characteristics of the matched patients were compared to ensure that
there were no significant differences in the baseline settings.
We used univariate and multivariate Cox regressions to
assess the prognostic value of blood transfusion through
balanced data. The GraphPad Prism 6 software was used to
draw the survival curves depicting OS and DFS.
Results
Demographics and clinical characteristics of the 605
eligible patients before PSM
Of these patients, 93 (15.37%) received blood transfusion,
and 512 (84.63%) did not. We described the patient
demographics and clinical characteristics for the two
groups separately (Table 1). The clinical data for 9 of the 21
variables differed significantly (P < 0.05) as a result of a
conspicuous bias with pre-described PS (0.096 ± 0.104 vs.
0.479 ± 0.372 P < 0.001).
Confounding factors between the PBT groups and outcome
To investigate whether the existing confounders led to
any bias, a univariate Cox regression was conducted to
filter out the 8 variables that were associated with the
outcome without considering treatment. In the OS Cox
regression model, the preoperative Hb, total bilirubin,
ALT, CA19–9, anti-HCV, TMD, TNM stage, intraoperative blood loss variables were selected as independent
prognostics for ICC patients. In the DFS Cox regression
model, CEA, which was an extended prognostic, was
picked out. Then, a univariate logistic regression was
performed between patients who received blood transfusion and those who did not; the gender, preoperative
Hb, PLT, total bilirubin, CA19–9, HBsAg, and intraoperative blood loss differed significantly. After multivariate
analysis, only the preoperative Hb, total bilirubin, and
intraoperative blood loss were left and were thus considered confounders that had to be adjusted to synthesize
all of the regression models (Table 2).
Zhou et al. BMC Cancer (2017) 17:762
Page 4 of 11
Table 1 Demographics and clinical characteristics of 605 eligible patients before PSM
Characteristic
Variable
Before PSM
No-PBT
PBT
(n = 512)
(n = 93)
P value
Age
Y ± SD
57.42 ± 10.815
56.54 ± 11.801
0.176a
Gender
female/ male
190/322
48/45
0.008c
Preoperative Hb
g/L ± SD
132.53 ± 16.22
118.63 ± 17.68
0.329a
0.038a
9
Platelet
1 × 10 /L ± SD
179.25 ± 64.02
201.30 ± 97.35
Total bilirubin
available data
510(99.61%)
92 (98.92%)
umol /L ± SD
24.98 ± 55.35
86.79 ± 134.47
available data
502(98.05%)
90 (96.77%)
U/L ± SD
44.56 ± 87.09
56.21 ± 57.45
available data
509 (99.41%)
92 (98.92%)
U/L ± SD
50.40 ± 95.22
57.90 ± 67.28
available data
497 (97.07%)
91 (97.85%)
ng/mL ± SD
95.28 ± 953.72
93.02 ± 585.95
available data
489 (95.51%)
87 (93.55%)
ng/mL ± SD
22.42 ± 154.07
61.84 ± 330.14
available data
486 (94.92%)
86 (92.47%)
U/mL ± SD
1152.16 ± 3116.14
2698.09 ± 4923.75
available data
506 (98.83%)
91 (97.85%)
s ± SD
11.20 ± 9.23
11.87 ± 3.11
available data
502 (98.05%)
89 (95.70%)
Value ±SD
0.98 ± 0.11
0.98 ± 0.14
available data
506 (98.83%)
93 (100.00%)
(−)/(+)
302/204
71/22
available data
502 (98.05%)
93 (100.00%)
(−)/(+)
493/9
91/2
available data
511 (99.80%)
92 (98.92%)
1/>1
426/85
81/11
available data
509 (99.41%)
93 (100.00%)
cm
6.48 ± 3.16
6.92 ± 3.44
available data
489 (95.51%)
74 (79.57%)
I/II/III/IVa
294/80/17/98
47/15/0/12
available data
512 (100.00%)
91 (97.85%)
no/ yes
344/168
70/21
available data
412 (80.47%)
76 (81.72%)
I/II-III/IV
2/408/2 (0.49%)
0/76/0 (0.00%)
AST
ALT
AFP
CEA
CA19–9
PT
INR
HBsAg
Anti-HCV
Tumor number
TMD
TNM stage
Cirrhotic nodule
DD
IBL
<0.001b
<0.001b
0.002b
0.982b
0.060b
<0.001b
0.093b
0.910b
0.002c
0.814c
0.259c
0.284b
0.433c
0.065c
1.000c
available data
503 (98.24%)
93 (100.00%)
<1 L/≥1 L
499/4 (99.20%)
61/32 (65.59%)
<0.001c
Preventive TACE
no/yes
474/38 (92.58%)
86/7 (92.47%)
0.972c
Propensity Score
available data
a
501 (84.49%)
92 (15.51%)
0.096 ± 0.104
0.479 ± 0.372
<0.001b
t test
K-Independent-Samples Test (Kruskal Wallis H(K) test)
Two-Independent-Samples Test (Mann-Whitney U test)
Values are presented as n (%) or mean ± standard deviation(SD)
Hb: hemoglobin; AST: aspartate aminotransferase; ALT: alanine transaminase; AFP: alpha fetoprotein; CEA: carcinoembryonic antigen; CA19–9: carbohydrate antigen
19–9; PT: prothrombin time; INR: international normalized ratio; HBsAg: hepatitis B surface antigen; Anti-HCV: anti-hepatitis C virus; TMD: tumor maximum dimension;
TNM: tumor node metastasis; IBL: intraoperative blood loss; DD: The degree of differentiation;
TACE: transcatheter arterial chemoembolization. PSM: propensity score matching; No-PBT: no-perioperative transfusion; PBT: perioperative transfusion
b
c
reference
1.184 (0.956–1.466)
Y ± SD
female
male
Age
Gender
1.000 (0.999–1.002)
1.001 (1.000–1.002)
1.000 (1.000–1.000)
1.000 (1.000–1.000)
1.000 (1.000–1.000)
1.000 (0.988–1.012)
umol/L + SD
U/L ± SD
U/L ± SD
ng/mL ± SD
ng/mL ± SD
U/mL ± SD
Total bilirubin
AST
ALT
AFP
CEA
CA19–9
0.912 (0.737–1.130)
DD
Cirrhotic nodule
2997.401 (0.000-.)
2632.881 (0.000-.)
II-III
IV
1.127 (0.910–1.397)
reference
yes
I
reference
2.088 (1.592–2.739)
IVa
no
1.105 (0.804–1.518)
2.167 (1.104–4.255)
reference
1.052 (1.017–1.087)
II
I
III
cm
1.122 (0.835–1.507)
TNM stage
reference
>1
0.395 (0.163–0.956)
(+)
1
reference
(−)
TMD
Tumor number
Anti-HCV
reference
(−)
(+)
HBsAg
2.307 (0.949–5.605)
s ± SD
Value ±SD
PT
INR
1.003 (1.002–1.004)
0.988 (0.981–0.994)
1.001 (1.000–1.003)
g/L ± SD
1 × 10⁹/L ± SD
Preoperative Hb
Platelet
1.007 (0.998–1.017)
HR (95% CI)
Univariate
(OS, COX Regression)
Before PSM
Variables
Characteristic
0.982
0.274
<0.001
0.003
0.446
0.04
0.401
0.065
0.99
<0.001
0.745
0.379
0.029
0.487
<0.001
0.177
<0.001
0.121
0.131
P valuea
8450.077 (0.000-.)
8142.694 (0.000-.)
reference
1.028 (0.834–1.266)
reference
1.657 (1.273–2.157)
1.823 (0.961–3.455)
1.192 (0.882–1.611)
reference
1.057 (1.025–1.090)
1.088 (0.821–1.441)
reference
0.507 (0.240–1.073)
reference
0.882 (0.718–1.084)
reference
1.692 (0.742–3.855)
1.008 (0.994–1.022)
1.000 (1.000–1.000)
1.001 (1.000–1.001)
1.000 (1.000–1.000)
1.001 (1.000–1.002)
1.001 (1.000–1.002)
1.002(1.001–1.003)
1.001 (0.999–1.002)
0.990 (0.985–0.996)
1.163 (0.949–1.425)
reference
1.006 (0.997–1.014)
HR (95% CI)
Univariate
(DFS, COX Regression)
0.997
0.799
0.001
<0.001
0.559
0.076
0.232
0.211
0.28
<0.001
0.01
0.451
0.049
0.205
0.001
0.222
0.001
0.145
0.219
P valuea
1.000 (0.000-.)
300,921,742.177 (0.000-.)
reference
0.614 (0.365–1.035)
reference
0.766 (0.390–1.503)
0.000(0.000-.)
1.173 (0.624–2.206)
reference
1.041 (0.975–1.113)
0.681 (0.348–1.332)
reference
1.204 (0.256–5.663)
reference
0.459 (0.275–0.764)
reference
0.714 (0.095–5.388)
1.007 (0.986–1.028)
1.000 (1.000–1.000)
1.001 (1.000–1.002)
1.000 (1.000–1.000)
1.001 (0.999–1.003)
1.001 (0.999–1.003)
1.007 (1.005–1.010)
1.004 (1.001–1.007)
0.951 (0.937–0.965)
0.553 (0.355–0.863)
reference
0.993 (0.973–1.013)
OR (95% CI)
Univariate
(Logistic Regression)
1.000
0.067
0.784
0.229
0.261
0.814
0.003
0.744
0.507
<0.001
0.108
0.983
0.472
0.24
<0.001
0.006
<0.001
0.009
0.477
P valuea
0.552 (0.258–1.183)
reference
1.000 (1.000–1.000)
1.006 (1.003–1.009)
1.001 (0.997–1.006)
0.947 (0.927–0.967)
0.790 (0.393–1.585)
reference
OR (95% CI)
Multivariate
(Logistic Regression)
Table 2 A univariate Cox regression and a variable selection logistic regression for confounding factors based on Transfusion and No-transfusion
0.126
0.903
<0.001
0.537
<0.001
0.506
P valuea
Zhou et al. BMC Cancer (2017) 17:762
Page 5 of 11
1.733 (1.184–2.535)
reference
0.841 (0.585–1.209)
no
yes
0.349
0.005
P valuea
1.300 (0.914–1.848)
reference
1.816 (1.243–2.652)
reference
HR (95% CI)
Univariate
(DFS, COX Regression)
OS: overall survival; DFS: disease-free survival; OR: odd ratio; HR: hazard ratio; “.”: indicate the exceeded value
a
likelihood ratio test
Preventive TACE
reference
<1000 mL
≥1000 mL
IBL
HR (95% CI)
Univariate
(OS, COX Regression)
Before PSM
Variables
Characteristic
0.144
0.002
P valuea
1.015 (0.439–2.348)
reference
65.443 (22.383–191.341)
reference
OR (95% CI)
Univariate
(Logistic Regression)
0.972
<0.001
P valuea
168.205 (43.249–654.184)
reference
OR (95% CI)
Multivariate
(Logistic Regression)
Table 2 A univariate Cox regression and a variable selection logistic regression for confounding factors based on Transfusion and No-transfusion (Continued)
<0.001
P valuea
Zhou et al. BMC Cancer (2017) 17:762
Page 6 of 11
Zhou et al. BMC Cancer (2017) 17:762
Page 7 of 11
Demographics and clinical characteristics of 215 matched
patients after PSM
Perioperative blood transfusion has no effect on OS and
DFS after PSM
Before performing propensity score matching analysis,
we used a calculation called “PS Power and Sample Size
Calculations(Version 3.0, January 2009)” [21, 22] to estimate the ideal sample size. We are planning a study with
1 PBT subject matched to 4 no-PBT subjects, an accrual
interval of 1 month, and additional follow-up after the
accrual interval of 133 months. Prior data indicate that
the median survival time on the no-PBT is 26 months.
If the true median survival times on the PBT and noPBT are 26 and 12 months, respectively, we will need
to study 31 PBT subjects and 124 no-PBT subjects to
be able to reject the null hypothesis that the experimental and control survival curves are equal with
probability (power) 0.9(β = 0.1). The Type I error
probability associated with this test of this null
hypothesis is 0.01(α).
The propensity score matching procedure was performed to reduce confounding variables based on the
three identified factors. The caliper was set at 0.05,
and we used an optimal match ratio of 1:4. We found
52 of the 93 transfused patients were matched with
163 of the 512 no-transfused patients, which is more
than the ideal sample size we calculated previously to
obtain the significant conclusion. The propensity
score suggests there were no biases in the matched
groups (0.136 ± 0.117 vs. 0.193 ± 0.167, P = 0.785).
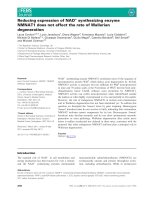
Figure 2 shows the matched data absolute standardized mean difference (SMD), and the SMD of all
three confounders and PS decreased to less than 0.2.
In Table 3, the matched patient characteristics were
compared, and no significant differences were shown
between the groups, considering all 21 variables.
The univariate Cox proportional hazards regression analysis
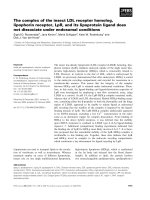
indicated PBT has a poor effect on OS and DFS before propensity score matching, which forebodes an 88.9% risk of
overall mortality (HR: 1.889, 95% CI: 1.446–2.468,
p < 0.001) and 58.9% risk of DFS (HR: 1.589, 95% CI:
1.221–2.067, p < 0.001). Additionally, the Kaplan-Meier
curve of OS showed the no-transfused group has a significant benefit compared with transfused group (p < 0.0001)
(Fig. 3), the median survival months(MSMs) of PBT
(12 months) is obviously less than non-PBT (26 months),
Of note, no difference was found in DFS (p = 0.3807), same
as the MSMs (PBT = 15 months, non-PBT = 16 months).
However, after performing a multivariate risk dependent
Cox regression we found that neither OS (HR: 1.172, 95%
CI: 0.756–1.816, p = 0.479) nor DFS (HR: 0.944, 95% CI:
0.608–1.466, p = 0.799) was significantly different due to
blood transfusion. Our findings suggest it was not a statistically independent prognostic risk. After propensity score
matching, PBT had no significant effect on the risk of OS
(HR: 1.429, 95% CI: 0.972–2.103, p = 0.070) and DFS (HR:
1.262, 95% CI: 0.858–1.856, p = 0.238) (Table 4). Furthermore, the Kaplan-Meier plot showed similar trends for OS
(P < 1.000) and DFS (P < 0.230). Both PBT and non-PBT
MSMs to OS is 21 months and no significant difference
(PBT = 12 months, non-PBT = 15 months) to DFS.
Fig. 2 The model values of absolute standard mean difference(SMD)
before and after PSM. The SMD of propensity score and three
confounders (Preoperative Hb, Total bilirubin, intraoperative blood
loss) was depicted in all data round dot. The SMD of matched data
was depicted in squared dot
Discussion
Several studies have focused on how PBT affects gastrointestinal carcinomas and other tumors [6–8, 10, 11, 14, 23,
24], and some concluded that PBT led to a poor outcome
and increased the probability of recurrence [6–8, 25, 26]].
However, others reported that PBT was not an independent
prognostic factor for tumor recurrence and OS [24]. Müller
et al. reached the same conclusion in a study of 128
advanced cholangiocarcinoma patients [9]: the small
number of sources and heterogeneity from a mixture of
intrahepatic, hilar, and distal cholangiocarcinoma may
result an unconvincing selection bias. In our consecutive
retrospective cohort study with 758 patients, we only
recruited those who had intrahepatic cholangiocarcinoma
without metastasis, and we found that PBT had no
prognosis-related effect on OS and DFS.
We first explored the variables in 605 patients and found
a significant bias between the two groups, which is consistent with previous reports. The survival analysis showed
transfusion was an independent prognostic cause of OS
and DFS. Moreover, we tried to determine which variables
interacted with the outcome and treatment, using a combination of logistic and Cox regressions, and we found
three interference factors: preoperative Hb, total bilirubin,
and intraoperative blood loss. The propensity score matching was performed to reduce the confounding influence
Zhou et al. BMC Cancer (2017) 17:762
Page 8 of 11
Table 3 Demographics and clinical characteristics of 215 patients after PSM
Characteristic
Variable
After PSM
No-PBT
PBT
(n = 163)
(n = 52)
P value
Age
Y ± SD
57.67 ± 10.77
56.90 ± 12.34
0.114a
Gender
female/male
72/91
27/25
0.330c
Preoperative Hb
g/L ± SD
125.38 ± 15.90
120.25 ± 18.72
0.232a
Platelet
1 × 10 /L ± SD
180.29 ± 65.50
193.38 ± 93.35
0.350a
Total bilirubin
umol/L ± SD
31.34 ± 62.77
60.36 ± 115.37
0.070b
AST
available data
161 (98.77%)
50 (96.15%)
U/L ± SD
46.25 ± 81.74
47.92 ± 62.24
0.763b
ALT
U/L ± SD
51.14 ± 80.64
53.35 ± 77.74
0.374b
AFP
available data
158 (96.93%)
52 (100.00%)
ng/mL ± SD
196.77 ± 1590.50
123.49 ± 741.51
available data
157 (96.32%)
49 (94.23%)
ng/mL ± SD
22.66 ± 149.81
95.03 ± 437.78
available data
156 (95.71%)
48 (92.31%)
U/mL ± SD
1170.62 ± 3041.71
1491.47 ± 3691.9
available data
161 (98.77%)
51 (98.08%)
s ± SD
10.76 ± 4.65
11.96 ± 3.59
available data
158 (96.93%)
50 (96.15%)
Value ±SD
0.98 ± 0.13
0.98 ± 0.15
available data
160 (98.16%)
52 (100.00%)
(−)/(+)
100/60
39/13
available data
159 (97.55%)
52 (100.00%)
(−)/(+)
157/2
51/1
0.726c
Tumor number
1/>1
140/23
43/9
0.574c
TMD
cm
6.84 ± 3.39
6.83 ± 3.38
0.967c
TNM stage
available data
155(95.09%)
44 (84.62%)
I/II/III/IVa
92/24/5/34
25/11/0/8
available data
163 (100%)
50 (96.2%)
no/yes
112/51
40/10
available data
126 (77.30%)
43 (82.70%)
I/ II-III
2/124 (1.59%)
0/43 (0.00%)
0.407c
IBL
<1 L/≥1 L
161/2 (98.77%)
52/0 (100.00%)
0.423c
Preventive TACE
no/yes
153/10 (93.87%)
47/5 (90.38%)
0.392c
0.136 ± 0.117
0.193 ± 0.167
0.785d
CEA
CA19–9
PT
INR
HBsAg
Anti-HCV
Cirrhotic nodule
DD
9
Propensity Score
0.994b
0.375b
0.439b
0.075b
0.997b
0.100c
0.968c
0.123c
a
t test
K-Independent-Samples Test (Kruskal Wallis H(K) test)
Two-Independent-Samples Test (Mann-Whitney U test)
d
Two-Related-Samples Test (Wilcoxon Signed Ranks Test)
Values are presented as n (%) or mean ± standard deviation
b
c
based on the three factors. To obtain the optimal matching
data, the match ratio of 1:4 and a general caliper value of
0.05 were applied based on Abadie’s research [17]. We
matched 52 transfused patients to 163 no-transfused
patients, and all SMD values were less than 0.2, which
suggests that the matching model was well adjusted [27]. A
further exploration of all variables was performed using the
same statistical method, and no significant bias persisted
between the groups in terms of the P value and PS. The
survival analysis of OS and DFS also revealed that PBT had
no effect on OS or DFS. Admittedly, we could not deny its
effect on delaying the duration of the hospital stay, a higher
Zhou et al. BMC Cancer (2017) 17:762
Page 9 of 11
Fig. 3 Kaplan-Meier survival plot of OS and DFS before and after PSM. The survival curve of overall survival and disease-free survival in unadjusted
model (a, b). The survival curve of overall survival and disease-free survival after matched (c, d). Median survival months were showed in
each figure
probability of complication such as febrile reaction, allergic
reaction, graft-vs. -host disease (GVHD), hemolytic reaction, and other long-term results like virus infection and
immunosuppression.
Fundamental confounding factors and inappropriate statistical methods may result in the illusion that PBT may lead
to poor survival. Lian X et al. demonstrated the positive
viewpoint by using a large gastric adenocarcinoma data set
[6]. They revealed that PBT resulted in poor prognosis but
not an independent prognostic factor based on a univariate
and multivariate Cox analysis. The explanation might be
different distribution of clinicopathological features between two groups and some confounder existed, such as
TNM stage and intraoperative blood loss. Our ICC data set
indeed found that intraoperative blood loss is an important
confounder, in fact, it is more likely to transfuse blood for
those massively bleeding patients. Norihisa Kimura et al.
concluded that PBT was a strong risk factor for both recurrence and poor survival based on 66 HCCA after aggressive
surgical resection [8], they also kindly pointed out their
limit of the small sample size may have resulted in a loss of
statistical power. Finding that such confounders could adversely cover up the truth. Therefore, an appropriate technique such as PSM must be performed to avoid the bias
before the final analysis, and ideal sample size of matched
pairs may be necessary to strength the conclusion.
There are several limitations in this study. First, although
the propensity score matching analysis is an acceptable
method of simulating a random controlled trial, but it is
still not sufficient to make up for the value of RCTs in
circumstances with ethical challenges. Second, our study
only recruited patients within China, and the results may
Table 4 Univariate and multivariate Cox analysis predicting OS and DFS based on Transfusion and No-transfusion
Characteristic
Variable
Before PSM
After PSM
univariate
PBT(OS)
PBT(DFS)
a
likelihood ratio test
multivariate
HR (95% CI)
P valuea
no
reference
<0.001
yes
1.889 (1.446–2.468)
no
reference
yes
1.589 (1.221–2.067)
univariate
HR (95% CI)
P valuea
reference
0.479
1.172 (0.756–1.816)
0.001
reference
0.944 (0.608–1.466)
HR (95% CI)
P valuea
reference
0.070
1.429 (0.972–2.103)
0.799
reference
1.262 (0.858–1.856)
0.238
Zhou et al. BMC Cancer (2017) 17:762
not be applicable to other countries especially western
states. Third, the exclusion of patients in the propensity
score matching analysis reduced the statistical power.
Finally, unknown or unobserved confounding factors may
contribute to potential bias because the missing source
collection and available data may result in information bias.
Conclusions
In conclusion, our data suggest that PBT was not associated with the long-term outcome of ICC. Inappropriate
statistical analyses may lead to variable results, and risk
adjustments can eliminate the detrimental effect.
Abbreviations
AFP: alpha fetoprotein; ALT: alanine transaminase; Anti-HCV: anti-hepatitis C virus;
AST: aspartate aminotransferase; CA19–9: carbohydrate antigen 19–9;
CEA: carcinoembryonic antigen; DD: The degree of differentiation; DFS: disease-free
survival; Hb: hemoglobin; HBsAg: hepatitis B surface antigen; HR: hazard ratio;
IBL: intraoperative blood loss; ICC: intrahepatic cholangiocarcinoma; INR: international
normalized ratio; MSMs: median survival months; No-PBT: no-perioperative
transfusion; OR: odd ratio; OS: overall survival; PBT: perioperative blood transfusion;
PBT: perioperative transfusion; PS: propensity score; PSM: propensity score matching;
PT: prothrombin time; RCT: random controlled trials; SMD: absolute standardized
mean difference; TACE: transcatheter arterial chemoembolization; TMD: tumor
maximum dimension; TNM: tumor node metastasis
Acknowledgements
Not applicable.
Funding
Not applicable.
Availability of data and materials
The datasets used and analyzed during the current study are available from
the corresponding author on reasonable request.
Authors’ contributions
PYZ, ZT, WRL conceived of the project and designed the research and
drafted the manuscript. WRL, MXT, XFJ, LJ, PYZ, HW, CYT collected and
organized the data, PYZ, ZT carried out the research, ZBD, YFP, SJQ, ZD, JZ,
JF supervised the research, discussed its integrity and revised each parts
critically for publication, YHS were responsible for quality control and
managed the experimental design, reviewed the manuscript and provided
funding support. All authors read and approved the final manuscript.
Ethics approval and consent to participate
The study with clinical data was approved by the Ethics Committee of the
Zhongshan Hospital, Fudan University (Y2017–279). We clarify that all clinical data
in this study was collected in patients who had given written informed consent.
Consent for publication
Not applicable.
Competing interests
The authors declare that they have no competing interests.
Publisher’s Note
Springer Nature remains neutral with regard to jurisdictional claims in
published maps and institutional affiliations.
Author details
1
Department of Liver Surgery, Liver Cancer Institute, Zhongshan Hospital,
Fudan University, 180 FengLin Road, Shanghai 200032, China. 2Key
Laboratory of Carcinogenesis and Cancer Invasion of Ministry of Education,
Shanghai, China. 3Institutes of Biomedical Sciences, Fudan University,
Shanghai, People’s Republic of China.
Page 10 of 11
Received: 7 May 2017 Accepted: 31 October 2017
References
1. Torre LA, Sauer AMG, Chen MS, Kagawa-Singer M, Jemal A, Siegel RL.
Cancer statistics for Asian Americans, native Hawaiians, and Pacific
islanders, 2016: converging incidence in males and females. CA Cancer
J Clin. 2016;66(3):182–202.
2. Dodson RM, Weiss MJ, Cosgrove D, Herman JM, Kamel I, Anders R, et al.
Intrahepatic cholangiocarcinoma: management options and emerging
therapies. J Am Coll Surgeons. 2013;217(4):736–50.
3. Chen W, Zheng R, Baade PD, Zhang S, Zeng H, Bray F, et al. Cancer statistics
in China, 2015. CA Cancer J Clin. 2016;66(2):115–32.
4. Siegel RL, Miller KD, Jemal A. Cancer statistics, 2016. CA Cancer J Clin. 2016;
66(1):7–30.
5. Chen W, Zheng R, Zhang S. Liver cancer incidence and mortality in China,
2009. Chinese J Cancer. 2013;32(4):162–9.
6. Xue L, Chen X, Wei-Han Z, Yang K, Chen X, Zhang B, et al. Impact of
perioperative blood transfusion on postoperative complications and
prognosis of gastric adenocarcinoma patients with different preoperative
hemoglobin value. Gastroent Res Pract. 2016;(1):1–10.
7. Mavros MN, Xu L, Maqsood H, Gani F, Ejaz A, Spolverato G, et al. Perioperative
blood transfusion and the prognosis of pancreatic cancer surgery: systematic
review and meta-analysis. Ann Surg Oncol. 2015;22(13):4382–91.
8. Kimura N, Toyoki Y, Ishido K, Kudo D, Yakoshi Y, Tsutsumi S, et al. Perioperative
blood transfusion as a poor prognostic factor after aggressive surgical
resection for hilar cholangiocarcinoma. J Gastrointest Surg. 2015;19(5):866–79.
9. Müller SA, Mehrabi A, Rahbari NN, Warschkow R, Elbers H, Leowardi C, et al.
Allogeneic blood transfusion does not affect outcome after curative resection
for advanced cholangiocarcinoma. Ann Surg Oncol. 2014;21(1):155–64.
10. De Boer MT, Molenaar IQ, Porte RJ: Impact of blood loss on outcome after
liver resection. Digest Surg 2007, 24(4):259–264.
11. Warschkow R, Güller U, Köberle D, Müller SA, Steffen T, Thurnheer M, et al.
Perioperative blood transfusions do not impact overall and disease-free
survival after curative rectal cancer resection. Ann Surg. 2014;259(1):131–8.
12. Yang T, Lu J, Lau WY, Zhang T, Zhang H, Shen Y, et al. Perioperative blood
transfusion does not influence recurrence-free and overall survivals after
curative resection for hepatocellular carcinoma a propensity score matching
analysis. J Hepatol. 2016;64:583–93.
13. Rizvi S, Gores GJ. Pathogenesis, Diagnosis, and Management of
Cholangiocarcinoma 2013 Gastroenterology. Gastroenterol. 2013(145):
1215–29.
14. Salpeter SR, Buckley JS, Chatterjee S. Impact of more restrictive blood
transfusion strategies on clinical outcomes: a meta-analysis and systematic
review. Am J Med. 2014;127(2):124–31.
15. Abadie A, Angrist J, Guido I. Instrumental variable estimates of the effect of
subsidized training on the quantile of trainee earnings. Econometrica. 2002;
70(1):91–117.
16. Mirici-Cappa F, Gramenzi A, Santi V, Zambruni A, Di Micoli A, Frigerio
M, et al. Treatments for hepatocellular carcinoma in elderly patients are
as effective as in younger patients: a 20-year multicentre experience.
Gut. 2010;59(3):387–96.
17. Abadie A, Imbens GW. Bias-corrected matching estimators for average
treatment effects. J Bus Econ Stat. 2011;29(1):1–11.
18. Williamson EJ, Forbes A. Introduction to propensity scores. Respirology.
2014;19(5):625–35.
19. Kim DH, Pieper CF, Ahmed A, Colón-Emeric CS. Use and interpretation of
propensity scores in aging research: a guide for clinical researchers. J Am
Geriatr Soc. 2016;64(10):2065–73.
20. The R Project for Statistical Computing. Accessed
1 May 2016.
21. Dupont WD, Plummer WD. Power and sample size calculations. Control Clin
Trials. 1990;11(2):116–28.
22. Dupont WD, Plummer WD. Power and sample size calculations for studies
involving linear regression. Control Clin Trials. 1998;19(6):589–601.
23. Jarnagin WR. Improvement in perioperative outcome after hepatic
resection. Ann Surg. 2002;236(4):397–407.
24. Han S, Kim G, Ko JS, Sinn DH, Yang JD, Joh J, et al. Safety of the use of
blood salvage and autotransfusion during liver transplantation for
hepatocellular carcinoma. Ann Surg. 2016;264(2):339–43.
Zhou et al. BMC Cancer (2017) 17:762
Page 11 of 11
25. Acheson AG, Brookes MJ, Spahn DR. Effects of allogeneic red blood cell
transfusions on clinical outcomes in patients undergoing colorectal cancer
surgery: a systematic review and meta-analysis. Ann Surg. 2012;256(2):235–44.
26. Wada H, Eguchi H, Nagano H, Kubo S, Nakai T, Kaibori M, et al. Perioperative
allogenic blood transfusion is a poor prognostic factor after hepatocellular
surgery: a multi-center analysis. Surg Today. 2017;
27. Baek S. Propensity score matching: a conceptual review for radiology
researchers. Korean Soc Radiol. 2015;16(2):286–96.
Submit your next manuscript to BioMed Central
and we will help you at every step:
• We accept pre-submission inquiries
• Our selector tool helps you to find the most relevant journal
• We provide round the clock customer support
• Convenient online submission
• Thorough peer review
• Inclusion in PubMed and all major indexing services
• Maximum visibility for your research
Submit your manuscript at
www.biomedcentral.com/submit