Texture analysis of MR images to identify the differentiated degree in hepatocellular carcinoma: A retrospective study
Bạn đang xem bản rút gọn của tài liệu. Xem và tải ngay bản đầy đủ của tài liệu tại đây (3.07 MB, 10 trang )
Feng et al. BMC Cancer
(2020) 20:611
/>
RESEARCH ARTICLE
Open Access
Texture analysis of MR images to identify
the differentiated degree in hepatocellular
carcinoma: a retrospective study
Mengmeng Feng1†, Mengchao Zhang2†, Yuanqing Liu1, Nan Jiang1, Qian Meng1, Jia Wang3, Ziyun Yao4,
Wenjuan Gan4 and Hui Dai1,5*
Abstract
Background: To explore the clinical value of texture analysis of MR images (multiphase Gd-EOB-DTPA-enhanced
MRI and T2 weighted imaging (T2WI) to identify the differentiated degree of hepatocellular carcinoma (HCC).
Method: One hundred four participants were enrolled in this retrospective study. Each participant performed
preoperative Gd-EOB-DTPA-enhanced MR scanning. Texture features were analyzed by MaZda, and B11 program
was used for data analysis and classification. The diagnosis efficiencies of texture features and conventional imaging
features in identifying the differentiated degree of HCC were assessed by receiver operating characteristic analysis.
The relationship between texture features and differentiated degree of HCC was evaluated by Spearman’s
correlation coefficient.
Results: The grey-level co-occurrence matrix -based texture features were most frequently extracted and the
nonlinear discriminant analysis was excellent with the misclassification rate ranging from 3.33 to 14.93%. The area
under the curve (AUC) of the combined texture features between poorly- and well-differentiated HCC, poorly- and
moderately-differentiated HCC, moderately- and well-differentiated HCC was 0.812, 0.879 and 0.808 respectively,
while the AUC of tumor size was 0.649, 0.660 and 0.517 respectively. The tumor size was significantly different
between poorly- and moderately-HCC (p = 0.014). The COMBINE AUC values were not increased with tumor size
combined.
Conclusions: Texture analysis of Gd-EOB-DTPA-enhanced MRI and T2WI was valuable and might be a promising
method in identifying the differentiated degree of HCC. The poorly-differentiated HCC was more heterogeneous
than well- and moderately-differentiated HCC.
Keywords: Hepatocellular carcinoma, Differentiated degree, Texture feature
* Correspondence:
†
Mengmeng Feng and Mengchao Zhang contributed equally to this work.
1
Department of Radiology, the First Affiliated Hospital of Soochow University,
Suzhou city, Jiangsu province 215000, P.R. China
5
Institute of Medical Imaging, Soochow University, Suzhou city, Jiangsu
province 215000, P.R. China
Full list of author information is available at the end of the article
© The Author(s). 2020 Open Access This article is licensed under a Creative Commons Attribution 4.0 International License,
which permits use, sharing, adaptation, distribution and reproduction in any medium or format, as long as you give
appropriate credit to the original author(s) and the source, provide a link to the Creative Commons licence, and indicate if
changes were made. The images or other third party material in this article are included in the article's Creative Commons
licence, unless indicated otherwise in a credit line to the material. If material is not included in the article's Creative Commons
licence and your intended use is not permitted by statutory regulation or exceeds the permitted use, you will need to obtain
permission directly from the copyright holder. To view a copy of this licence, visit />The Creative Commons Public Domain Dedication waiver ( applies to the
data made available in this article, unless otherwise stated in a credit line to the data.
Feng et al. BMC Cancer
(2020) 20:611
Background
Hepatocellular carcinoma (HCC) is a malignant tumor
evolved from the hepatocyte and is the second most
common cause of cancer death worldwide. HCC account
for a larger proportion of tumor particularly in developing countries [1]. The high prevalence of hepatitis virus
B is the most common reason leading to HCC in the developing countries, while the alcohol and hepatitis C
virus is more frequent in developed countries. Although
there are many treatments of HCC including surgery, radiofrequency ablation and transcatheter arterial chemoembolization, the mortality of HCC is still high due
to the recurrence [2].
There were many reports suggested that the size of
tumor, number of lesion, vascular invasion, status of
tumor capsule and liver function status can affect the
prognosis and the choices of therapy of HCC [3–6].
Nevertheless, the most important factor was the differentiated grade, which was supposed to an independent factor
affecting recurrence of HCC [7]. According to the differentiated degree of tumor cells, HCC were grouped into
poorly-differentiated HCC, moderately-differentiated
HCC and well-differentiated HCC. According to the reports, the overall survival rate of the patients with
moderately-differentiated and well-differentiated HCC
was higher than that of the patients with poorlydifferentiated HCC, while the recurrence rate was lower
[8, 9].
As we known, a precise pre-surgical evaluation of differentiated degree of HCC might affect the individual
treatment schedule [10]. Currently, aspiration biopsy
was the most common method to get the information of
histopathology before surgery. However, it was criticized
by many researchers due to its invasiveness and the
probability of seeding metastasis [11, 12]. Recently, many
studies suggested the image characteristics of tumor
might predict the differential degree of the HCC. For example, there were some reports found that the low density/intensity of HCC on the portal phase of CT and
hepatobiliary phase of Gd-EOB-DTPA-enhanced MRI
might help to identify the differentiated degree of HCC
[13, 14].
Texture analysis was an established technique, which
was beneficial to diagnoses, by extracting a large amount
of texture information from medical images [15]. It was
used in identifying the differentiated degree and characteristics of tumor, and evaluating the therapeutic effect,
etc. [16–18]. However, the texture analysis has not been
used in identifying the differentiated degree of HCC yet.
Thus, our aim of the present study is to evaluate the accuracy of the texture analysis of MR images in discriminating the differentiated degree of HCC, and to
compare the diagnostic efficiencies of conventional imaging features and texture features.
Page 2 of 10
Methods
Patients
The present study received ethical approval from the
Medical Ethics Review Committee of our institution and
the relevant informed consent form was obtained in accordance with the Declaration of Helsinki. One hundred
four participants were enrolled from 2015 to 2019, according to the following criteria:1) pathologically proved
as HCC after hepatectomy; 2) inpatients who have comprehensive clinic materials; 3) performed preoperative
Gd-EOB-DTPA-enhanced MRI. The clinic data of the
104 participants were recorded in the Table 1, containing age, gender, alpha fetoprotein (AFP), alamine aminotransferase (ALT), aspartate transaminase (AST),
ALT\AST, total bilirubin (TBIL), direct bilirubin and indirect bilirubin.
Exclusion criteria included:1) participants have been
treated (transplantation, resection, ablation or embolization)
before MR examination; 2) clinical data (AFP, ALT, AST,
TBIL, direct bilirubin and indirect bilirubin) or pathological
results were incomplete; 3) the lesions were not clearly displayed on the images due to the artifact.
MRI examination
All MRI examinations were performed using 3.0 T MRI
machine (Siemens Magnetom Verio 3.0 T; Siemens Magnetom Skyra 3.0 T; GE Signa HDxt 3.0 T) with a dedicated phased-array body coil. A standard abdominal
MRI protocol containing following sequences were acquired: 1) Axial T2-weighted: TR = 3260 ms, TE = 105
ms, slice thickness 7 mm, intersection gap 1.4 mm, field
of view (FOV) 210 mm × 380 mm; 2) In-phase and outof-phase axial T1-weighted imaging: TR = 4.16 ms, TE =
2.58 ms (in-phase), TE = 1.35 ms (out-phase), slice thickness 5 mm, intersection gap 1 mm, FOV 210 mm × 380
mm; 3) Diffusion-weighted imaging (DWI, b = 50, 800 s/
mm2) performed with a free-breathing single-shot echoplanar technique, TR 5300 ms, TE 57 ms, slice thickness
7 mm, intersection gap 1.4 mm, FOV 210 mm × 380 mm;
corresponding ADC maps were calculated automatically
by a built-in software; and 4) Contrast enhanced MRI, a
three-dimensional (3D) gradient echo sequence with
volumetric interpolated breath-hold examination (VIBE):
TR 4.18 ms, TE 1.93 ms, slice thickness 3 mm without
intersection gap, FOV 210 mm × 380 mm. Gd-EOBDTPA (Primovist, Bayer Healthcare, Berlin, Germany)
was used by 0.2 ml/kg with an injection rate of 2 ml/sec.
Hepatic arterial phase (AP), portal venous phase (PVP),
equilibrium phase (EP) and hepatobiliary phase (HBP)
images were obtained.
Image analysis
The MRI images were reviewed in the picture archiving
and communication system (PACS). Experienced
Feng et al. BMC Cancer
(2020) 20:611
Page 3 of 10
Table 1 The clinical data of each subtype group and inter-group differences
Parameter
C
A
B
P value (A verse C)
P value (B verse C)
P value (A verse B)
Age
56.647 ± 9.652
59.875 ± 12.522
58.232 ± 10.831
0.356
0.304
0.937
Gender (female\male)
6\31
4\20
7\36
0.963
0.994
0.967
AFP (positive\negative)
32\5
11\13
30\13
0.001
0.074
0.054
ALT
64.705 ± 65.452
116.47 ± 105.389
68.047 ± 77.362
0.006
0.893
0.008
AST
46.430 ± 55.668
72.988 ± 109.165
60.842 ± 123.950
0.063
0.919
0.082
ALT\AST
1.55 ± 0.79
2.070 ± 10.96
1.504 ± 0.752
0.092
0.728
0.044
TBIL
25.695 ± 21.309
25.054 ± 14.022
53.532 ± 95.849
0.488
0.271
0.744
Direct bilirubin
13.483 ± 12.930
12.595 ± 9.154
28.574 ± 50.347
0.626
0.369
0.759
Indirect bilirubin
12.208 ± 9.239
12.463 ± 6.494
27.284 ± 53.889
0.425
0.191
0.724
GPC-3(positive\negative)
17\3
6\5
17\3
0.095
1
0.095
Note: A: well-differentiated HCC, B: moderately-differentiated HCC, C: poorly-differentiated HCC, AFP alpha fetoprotein, ALT alamine aminotransferase, AST
aspartate transaminase, TBIL total bilirubin, GPC-3: glypican-3
radiologists, who were blinded to the pathological results, evaluated the MRI imaging features of the HCC.
The imaging features of MRI (arterial enhancement, capsule appearance, the intensity of HBP, the margin and
diameter of the tumor, intralesional fat, intratumoral
vessel and etc.) were selected referring to the Liver
Imaging-Reporting and Data System (LI-RADS 2017)
( [19].
Texture analyses and features selection
MaZda software (version 4.6, quantitative texture analysis software, available from />mazda/) was used for texture analysis. All images were
transformed into Bitmap (BMP) format considering for
the application compatibility of MaZda. An experienced
radiologist manually portrayed the region of interest
(ROI) of the lesion on the slice which contained the
maximum proportion of tumor. One hundred four ROIs
(one ROI for each patient) on HBP images were analyzed firstly. Subsequently, the ROIs were copied onto
T2, AP and EP images. Then, texture features were extracted and analyzed. The texture features could be
grouped into grey-level histogram, the grey-level cooccurrence matrix (GLCOM), the grey-level run-length
matrix (GLRLM) and wavelet transform. A grey-level
histogram indicated how many pixels of an image shared
the same grey level. GLCOM was a statistical method of
examining image texture, considering the spatial relationship, by calculating how often pairs of pixel with
specific values, which could not provide information
about shape. The GLRLM gave the size of homogeneous
runs for each grey level. Wavelet transforms were a
mathematical means for performing signal analysis when
signal frequency varied over time. Wavelet transform coefficients could be computed. More detailed texture features were listed in Table 2. Feature selection algorithms
included Fisher coefficient, mutual information [MI],
and classification error probability combined with average correlation coefficients [POE + ACC]. Ten texture
features were extracted by each of these algorithms. In
order to enhance the discriminability, these three
methods were combined, called “FPM”, by which 30 texture features were extracted in total.
Histopathological analysis
Histopathological evaluation was available after hepatectomy for the lesions. The specimens were routinely prepared with 4% formaldehyde. The specimens were
evaluated by two experienced pathologists who were
blind to MRI information. The eight slices of each lesion
were analyzed and evaluated with slices ranging from
0.3 cm to 2.0 cm depending on the size of the lesion.
The Edmondson-Steiner grade was used to categorize all
Table 2 List of texture features extracted by MaZda software
Main features
More detailed features
Grey-level histogram
Mean, variance, skewness, kurtosis, percentiles (1, 10, 50, 90, 99%)
Grey-level co-occurrence matrix (GLCOM)
Angular second moment, contrast, correlation, entropy, sum entropy, sum of squares,
sum average, sum variance, inverse difference moment, difference entropy, difference
variance (for four directions and five interpixel distances (offsets; n = 1–5))
Grey-level run-length matrix (GLRLM)
Run-length non-uniformity, grey-level non-uniformity, long run emphasis, short run
emphasis, fraction of image in runs (for four angles)
Wavelet transform
Energies of wavelet transform coefficients in sub-bands LL, LH, HL, HH
Feng et al. BMC Cancer
(2020) 20:611
the specimens. According to the differentiation degree
of tumor cells, HCC were categorized into grades I to
IV. Edmonson grade I and part of grade II was corresponding with well-differentiated HCC, Edmonson grade
II and part of grade III was corresponding with
moderately-differentiated HCC, grade III and part of
grade IV was poorly-differentiated HCC, and grade IV
was undifferentiated HCC. The specimens were stained
with Glypican-3 (GPC-3) antibodies. The results of immunohistochemical staining were considered positive if
more than 10% of the tumor cells showed cytoplasmic
staining, otherwise the results were considered negative.
Statistical analysis and misclassification rate
The statistical analysis was performed using Statistical
Product and Service Software (SPSS ver. 20.0, Chicago,
IL). In present study, the group differences of continuous variables in abnormal distribution, such as age, ALT,
AST, ALT\AST and texture features, were analyzed by
Mann-Whitney U test. The difference of texture features
between poorly-, moderately- and well-differentiated
HCC were analyzed by Kruskal-Wallis H test. The group
differences of categorical variables were analyzed by
Pearson Test when the sample size was over 40 and the
minimal expected frequency was over 5. Otherwise, the
correction formula of chi-squared test would be chosen.
And the R × C table was used when the dependent variable was over 2. In order to evaluate the diagnostic accuracy of texture features derived from T2, HBP, AP,
and EP, the receiver operating characteristic (ROC) analysis was performed and the area under the curve (AUC)
was calculated by MedCalc (MedCalc statistical software,
ver.15.8). The correlation between texture features and
differentiated degree of HCC was analyzed by Spearman’s correlation coefficient. A p value less than 0.05
was considered statistically significant. And Bonferroni
correction was used to adjust p values in multiple
comparisons.
The B11, a module of MaZda (version 4.6), provided
four analyzing ways - principal component analysis (PCA),
linear discriminant analysis (LDA), nonlinear discriminant
analysis (NDA) and raw data analysis (RDA), to classify
and analyze the texture features. The B11 implemented 1NN classifier for non-linear supervised classification [20].
The misclassification rate was defined as total false samples divided by the total samples and the ratio indicated
that the estimated group was different from the observed
group. According to the misclassification rate, the classification results were separate into four levels: excellent
(misclassification rates ≤10%), good (10% < misclassification rates ≤20%), moderate (20% < misclassification rates
≤30%), fair (30% < misclassification rates ≤40%), and poor
(misclassification rates > 40%) [21].
Page 4 of 10
Results
Clinical data
There were 37 patients with poorly-differentiated HCC,
43 with moderately-differentiated HCC, and 24 with
well-differentiated HCC in present study. As showed in
Table 1, there were no significant differences for age and
gender among the groups (p > 0.05). There were significant differences for AFP and ALT value between the
poor- and well-differentiated HCC (p = 0.001, 0.006, respectively). The ALT was statistically different between
well- and moderately-differentiated HCC (p = 0.008).
Fifty-one participants were with GPC-3, among which,
20 were with poorly-differentiated HCC, 20 with moderately and 11 with well-differentiated HCC. There was no
significant difference of GPC-3 expression among
poorly-, well- and moderately-differentiated HCC, as
Table 1 showed (p > 0.05).
MRI feature evaluation
The MRI imaging features of l04 patients were demonstrated in Table 3. As the table showed, the tumor size
was statistically different between poorly- and
moderately-HCC (p = 0.014). However, no statistical differences were found in the margin and the capsule status
of the tumor, liver cirrhosis, the HBP hypointensity,
intratumoral vessel, intralesional fat, rim-enhancement
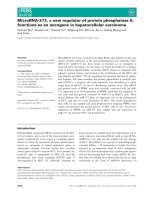
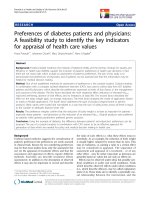
AP and lymphadenectasis, among poorly-, moderatelyand well-differentiated HCC. A typical case of poorlydifferentiated HCC was showed in Fig. 1.
Texture analysis and tissue classification
As showed in Tables 4, 262 texture features derived
from T2, HBP, AP and EP images were obtained and
categorized into histogram (n = 10), GLCOM (n =
220), GLRLM (n = 20) and wavelet transform (n =
12). The frequency of each feature category of T2weighted images and each phase of Gd-EOB-DTPA
enhanced images extracted by FPM was showed
among poorly-differentiated, well-differentiated and
moderately-differentiated HCC. The GLCOM-based
texture features were most frequently extracted with
three phases for poorly- verse well-differentiated
HCC, poorly- verse moderately-differentiated HCC
and well- verse moderately-differentiated HCC.
The tissue classification results were demonstrated
across the T2, AP, EP and HBP in Table 5. The misclassification rate of NDA was excellent for each phase
of the three groups, with the misclassification rate ranging from 3.33 to 14.93%. The misclassification rate of
LDA was rank secondly to NDA, with the classification
rate range from 4.92 to 33.75%. Both of the misclassification results of RDA and PCA were fair or poor.
Feng et al. BMC Cancer
(2020) 20:611
Page 5 of 10
Table 3 MRI features of each subtype group and inter-group differences
Variables
C
A
B
P value (A verse C)
P value (B verse C)
P value (A verse B)
Tumor size
7.16 ± 7.55
4.54 ± 3.29
4.35 ± 3.13
0.051
0.014
0.968
Signal (Homogeneous\Heterogeneous)
12\25
14\10
18\25
0.46
0.524
0.196
Margin (Smooth\Coarse)
17\20
18\6
26\17
0.25
0.19
0.23
Capsule (Complete\Incomplete\None)
17\5\15
12\1\11
22\3\18
0.449
0.615
0.871
Liver cirrhosis (Yes\No)
20\17
12\12
23\20
0.962
0.960
0.784
HBP hypointensity (Yes\No)
7\30
7\17
8\35
0.536
0.971
0.32
Intratumoral vessel (Yes\No)
15\22
7\17
18\25
0.366
0.905
0.303
Intralesional fat (Yes\No)
1\36
3\21
6\37
0.327
0.168
0.867
Rim-enhancement AP (Yes\No)
22\15
12\12
15\28
0.467
0.028
0.226
Lymphadenectasis (Yes\No)
5\32
1\23
1\42
0.449
0.142
1.0
Note: A: well-differentiated HCC, B: moderately-differentiated HCC, C: poorly-differentiated HCC, Rim-enhancement AP: rim-enhancement in arterial phase
ROC-analysis
The AUC of each texture feature was calculated. The
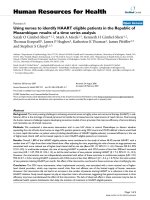
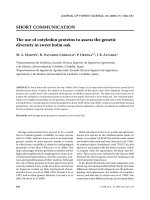
ROC curves of the best combined diagnoses were demonstrated in Figs. 2, 3 and 4. As showed in Fig. 2, the
combine AUC value (combining texture features from
T2, AP and EP) was 0.812, higher than that of any single
texture feature from each phase, to differentiate poorlyfrom well-differentiated HCC (accuracy = 0.77). As
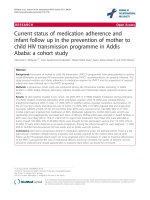
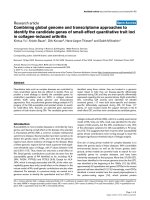
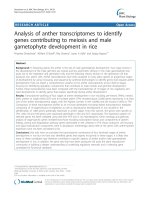
showed in Fig. 3, the combine AUC value was 0.879 (accuracy = 0.85), to differentiate poorly- from moderatelydifferentiated HCC, and as showed in Fig. 4, the combined AUC value was 0.808 (accuracy = 0.746) to differentiate moderately- from well-differentiated HCC.
The ROC analyses of combined tumor size and texture
features were demonstrated in Table 6. “COMBINE”
presented the combination of texture features derived
from different phases. As showed in the Table 6, the
AUC of tumor size was the lowest and the COMBINE
AUC value was the highest. With combining tumor size
and texture features, the COMBINE AUC values were
the same as those without combining tumor size, in
poorly- verse moderately-differentiated HCC and poorlyverse well-differentiated HCC, while the COMBINE
AUC value was increased from 0.808 to 0.833 in moderately- with well-differentiated HCC (p = 0.314).
Correlation between texture features and differentiated
degree of HCC
Perc.10% was positively correlated with the differentiated
degree of HCC in AP (r = 0.276, p = 0.005), while 135dr_
Fig. 1 A patient claimed epigastric discomfort and with a history of hepatitis B for several years. As showed in T2WI (a), the tumor located in
right lobe of liver. T2WI (a) showed heterogeneous signal of the tumor and the complete capsule of the tumor. AP (b) images showed the
enhancement in the margin of tumor. EP (c) images demonstrated the heterogeneous enhancement and non-enhancing center area of the
tumor. The tumor showed heterogeneous hypointensity with comparative lower intensity in the center of the tumor on HBP images (d). GPC-3
was positive on immunohistochemical examination (×200) (e). The pathological result of hematoxylin and eosin staining of tumor section was
poorly-differentiated HCC (× 200) (f)
Feng et al. BMC Cancer
(2020) 20:611
Page 6 of 10
Table 4 The frequency of each feature category extracted by FPM from AP, EP, HBP and T2 images among poorly-differentiated,
well-differentiated and moderately-differentiated HCC
Texture features
A verse C
B verse C
A verse B
AP
EP
HBP
T2
AP
EP
HBP
T2
AP
EP
HBP
T2
Histogram (n = 10)
4
5
2
5
4
2
1
5
3
1
1
0
GLCOM (n = 220)
15
10
17
142
14
18
19
45
16
16
19
40
GLRLM (n = 20)
5
9
6
13
5
4
3
4
6
6
5
7
Wavelet transform (n = 12)
6
6
5
9
7
6
7
3
5
7
5
8
Note: A: well-differentiated HCC, B: moderately-differentiated HCC, C: poorly-differentiated HCC;
AP arterial phase, EP: equilibrium phase images, and HBP hepatobiliary phase
histopathological outcomes, and whether the texture features could successfully differentiate the subtypes of
HCC were explored. Texture analysis was a method that
could quantize the information provided by the images.
Some studies verified that texture analysis had the potential to identify the histopathological type of neoplasm,
such as the breast cancer and renal tumor [21, 25].
However, there were no studies to explore the value of
texture features derived from multi-phase of Gd-EOBDTPA-enhanced MRI and T2WI in predicting the histopathological grades of HCC yet.
In recent years, researchers gradually realized that the
substantial quantitative features were increasingly important in the tumor diagnoses, not merely the application of qualitative features such as margin, signal
intensity, capsule of the tumor and so on [26]. Mazda
was a software package which provided a complete path
for quantitative analysis of image texture. It included
image analysis, texture features extraction, data classification, analysis automation and other functions [20].
Substantial information obtained by Mazda, might differentiate the pathological grade of tumor. Previous
study analyzed the texture features to predict the OS of
the patients with advanced HCC [27]. Our study
attempted to identify the histopathological grade by texture analysis.
B11 module provided four procedures, RDA, PCA,
LDA and NDA, to analyze the selected thirty features. In
present study, the classification rate of NDA was excellent. It suggested that texture analysis was a reliable
ShrtREmp was negatively correlated with the differentiated degree of HCC in EP phase (r = − 0.305, p = 0.002)
and S(3,0) SumEntrp was negatively correlated with the
differentiated degree of HCC in T2 phase (r = − 0.306,
p = 0.02).
Discussions
As previous studies showed, the diameter of HCC was
an important factor to predict the pathological grade of
HCC. Lee et al. [22] and Martins et al. [23] suggested
that the diameter of most moderately-differentiated
HCC was larger than well-differentiated HCC. Our
present study found that the diameter of poorlydifferentiated HCC was larger than that of moderatelydifferentiated and well-differentiated HCC. However,
there was no significant difference of diameter between
poorly and well-differentiated HCC in present study,
which was not in consistence with the Martins’. It may
be due to the heterogeneity of the tumor cells and the
individual differences of tumor growing patterns, as well
as the limited sample size. Additionally, it was found
that the diagnostic efficiency of tumor size was lower
than those of the texture features in present study,
which was consistent with previous study [24], suggesting the critical role of texture analysis in identifying the
differentiated degree of HCC.
The differential degree of HCC was the most important factor that affect the prognosis of the patients. In
this study, the patients were grouped into poorly, moderately and well-differentiated group based on the
Table 5 Misclassification rate of texture analyses from AP, EP, HBP and T2 images among poorly-differentiated, well-differentiated
and moderately-differentiated HCC
A verse C
B verse C
A verse B
AP
EP
HBP
T2
AP
EP
HBP
T2
AP
EP
HBP
T2
RDA (%)
44.26
34.43
50.82
48.33
55.00
50.50
47.50
46.25
34.33
46.27
44.78
47.76
PCA (%)
42.62
36.07
47.57
50.00
53.75
53.75
48.75
40.00
28.36
37.31
44.78
40.30
LDA (%)
14.75
4.92
9.84
10.00
17.50
33.75
33.75
20.00
26.87
23.88
11.94
26.87
NDA (%)
11.48
4.92
6.56
3.33
10.00
13.75
13.75
12.50
8.96
14.93
4.48
7.46
Note: RDA raw data analysis, PCA principal component analysis, LDA linear discriminant analysis, NDA nonlinear discriminant analysis
A: well-differentiated HCC, B: moderately-differentiated HCC, C: poorly-differentiated HCC; AP arterial phase, EP equilibrium phase images, and HBP
hepatobiliary phase
Feng et al. BMC Cancer
(2020) 20:611
Page 7 of 10
Fig. 2 ROC curves for differentiating the poorly- and well-differentiated HCC. The ROC curves were drawn according to the texture features with
the highest AUC derived from T2, EP and AP. And the ROC curve of the combined texture features was shown as COMBINE
method to identify the poorly-, moderately- and welldifferentiated HCC. Although LDA was recommended
as an optical method, NDA was more excellent than
LDA in present study, which was in consistent with Li
Y’s study [28]. This might be due to the non-linearity of
the clinical data which was obtained in a random way.
And the inconformity of the misclassification rate from
the texture analysis of different image sequences, might
result from the different histological components and
enhancement patterns among the subtypes of HCC [21].
The GLCOM-based features which described the
spatial dependence of gray value in image were most frequently extracted than other texture features of other
categories regardless of the phase of MRI and groups
[28, 29]. It was implied that the different pathological
grades might impact the gray value of the image. Additionally, the tremendous number of texture features included in the GLCOM (n = 220) might lead to the high
frequency of the extracted text features [21]. The
GLRLM was secondly selected by texture analysis, which
demonstrated the pixel runs with the same grey level
values in a given direction and depicted intensity homogeneity in a given direction [28]. The result might suggest that the intensity homogeneity between poorly-,
moderately- and well-differentiated HCC was different.
The GLCOM-based features generated from AP was noticeably different between groups.
In present study, it was found that histogram-derived
parameter —— Perc.10% of AP was positively correlated
with the differentiated degree of HCC. It was suggested
that the signal intensity in AP imaging was detectably
higher with a higher differentiated degree. However, as
previous study showed, HCC with a higher differentiated
degree was prone to have lower arterial supply. The individual differences of HCC arterial supply might lead to
this discrepancy [30]. 135dr_ShrtREmp was a GLRLMbased texture feature to measure the heterogeneity and
SumEntrp was a parameter to measure randomness and
Fig. 3 ROC curves for differentiating the poorly- and moderately-differentiated HCC. The ROC curves were drawn according to the texture
features with the highest AUC derived from T2, AP, EP and HBP. And the ROC curve of the combined texture features was shown as COMBINE
Feng et al. BMC Cancer
(2020) 20:611
Page 8 of 10
Fig. 4 ROC curves for differentiating the well- and moderately-differentiated HCC. The ROC curves were drawn according to the texture features
with the highest AUC derived from T2, AP and HBP. And the ROC curve of the combined texture features was shown as COMBINE
heterogeneity of the studied region. 135dr_ShrtREmp of
EP and SumEntrp of T2 were negatively correlated with
differentiated degree of HCC, suggesting that the poorlydifferentiated HCC was most heterogeneous among different differentiated grades of HCC both in EP and T2
phase [25, 31]. However, there was no statistical difference of signal (a routine MR feature) in different differentiated degrees of HCC as showed in Table 3.
Therefore, the texture analysis was supposed to be a preciser method to evaluate the differentiated degree of
HCC than traditional MRI imaging characteristics.
As showed in Table 6, the COMBINE (combined S(0,
2) SumAverg of AP, Perc.10% of T2, Perc.10%-EP and
S(0,5)SumEntrp-HBP) AUC value was the highest when
moderately- verse poorly-differentiated HCC. S(0,2)
SumAverg and Perc.10% reflected the signal intensity of
the lesion, and the S(0,5) SumEntrp reflected randomness and heterogeneity of the studied region. Therefore,
the signal intensity of T2, AP and EP and the
heterogeneity of HBP were supposed to be important to
predict the differentiated degree of HCC. The COMBINE (combined S(4,0)Correlat-AP, 135dr_ShrtREmpEP and WavEnLH_s-2-T2) AUC value was the highest
when well- verse poorly-differentiated HCC, while the
COMBINE (combined S(5,5)DifVarnc-AP, S(2,2)DifVarnc-HBP and WavEnLH_s-1-T2) AUC value was the
highest when well- verse moderately-differentiated HCC.
All the above features reflected the heterogeneity of lesion. Both the signal intensity and heterogeneity of HCC
valued in identifying the differentiated degree of HCC.
In addition, the AUC of tumor size was the lowest, suggesting that the texture features analysis was preciser
than tumor size in identifying the differentiated degree
of HCC. These results suggested that radiologists should
focus on the signal intensity and heterogeneity of lesion
in clinical diagnosis.
GPC-3 was a member of the glypican family, which influenced cell growth, differentiation, and migration [32].
Table 6 The AUC of the texture features and tumor size among poorly-differentiated, well-differentiated and moderatelydifferentiated HCC
A verse C
B verse C
A verse B
Texture features
AUC
accuracy
Texture features
AUC
S(4,0)Correlat-AP
0.711
0.656
S(0,2)SumAverg-AP
0.733
135dr_ShrtREmp-EP
0.739
0.721
Perc.10%-EP
0.704
WavEnLH_s-2-T2
0.765
0.705
Perc.10%-T2
0.734
COMBINE
0.812
0.770
S(0,5)SumEntrp-HBP
0.688
Tumor Size
0.649
0.639
COMBINE
COMBINE+Tumor Size
0.812
0.770
Tumor Size
COMBINE+Tumor Size
accuracy
Texture features
AUC
accuracy
0.700
S(5,5)DifVarnc-AP
0.690
0.642
0.688
S(2,2)DifVarnc-HBP
0.683
0.731
0.663
WavEnLH_s-1-T2
0.723
0.657
0.638
COMBINE
0.808
0.746
0.879
0.850
Tumor Size
0.517
0.642
0.660
0.600
COMBINE+Tumor Size
0.833
0.791
0.879
0.825
Note: A: well-differentiated HCC, B: moderately-differentiated HCC, C: poorly-differentiated HCC; AP arterial phase, EP equilibrium phase images, and HBP
hepatobiliary phase. COMBINE: demonstrates the AUC of the combination of statistically significant texture features derived from T2 weighted imaging and
different phases of Gd-EOB-DTPA-enhanced MRI
Feng et al. BMC Cancer
(2020) 20:611
Previous studies demonstrated that higher GPC-3 expression level in HCC was a risk factor for shorter overall survival and GPC-3 expression level in poorlydifferentiated tumor cells was higher than that in moderately- and well- differentiated HCC [32–34]. But there
was no significant difference of the expression of GPC-3
among poorly-, moderately- and well- differentiated
HCC in present study. The small sample size was supposed to be the reason of this discrepancy.
There were some limitations in our study. Although
we adopted strict inclusion and exclusion criteria in this
retrospective study, selection bias was still inevitably.
Second, the sample size was relatively small which need
to be enlarged in the future study. Third, the ROI
(tumor contour) was manually delineated on the slice
containing the maximum diameter, which led to the lack
of three-dimentional information of the tumor.
Page 9 of 10
Ethics approval and consent to participate
The present study received ethical approval from the Medical Ethics Review
Committee of The First Affiliated Hospital of Soochow University and the
written informed consent of each participant was obtained.
Consent for publication
Not applicable.
Competing interests
Authors declare no conflicts of interest.
Author details
1
Department of Radiology, the First Affiliated Hospital of Soochow University,
Suzhou city, Jiangsu province 215000, P.R. China. 2Department of Radiology,
the China-Japan Union Hospital of Jilin University, Changchun city, Jilin
province 130033, P.R. China. 3Department of Hepatobiliary Surgery
Department, the First Affiliated Hospital of Soochow University, Suzhou city,
Jiangsu province 215000, P.R. China. 4Department of Pathology Department,
the First Affiliated Hospital of Soochow University, Suzhou city, Jiangsu
province 215000, P.R. China. 5Institute of Medical Imaging, Soochow
University, Suzhou city, Jiangsu province 215000, P.R. China.
Received: 5 March 2020 Accepted: 19 June 2020
Conclusions
In conclusion, the texture analysis of multiphase GdEOB-DTPA-enhanced MRI and T2WI were noninvasive
and reliable quantitative technique to predict the differentiated grade of HCC. Texture analysis performed better than the tumor size in discriminating the
differentiated grade of HCC. The signal intensity and
heterogeneity of HCC were valued in identifying the differentiated degree of HCC.
Abbreviations
HCC: Hepatocellular carcinoma; GPC-3: Glypican-3; AFP: Alpha fetoprotein;
ALT: Alamine aminotransferase; AST: Aspartate transaminase; T2WI: T2
weighted imaging; ROC: Receiver operating characteristic; AUC: Area under
the curve; TBIL: Total bilirubin; AP: Hepatic arterial phase; PVP: Portal venous
phase; EP: Equilibrium phase; HBP: Hepatobiliary phase; ROI: Region of
interest; GLCOM: The grey-level co-occurrence matrix; GLRLM: The grey-level
run-length matrix; PCA: Principal component analysis; LDA: Linear
discriminant analysis; NDA: Nonlinear discriminant analysis; RDA: Raw data
analysis
Acknowledgements
None.
Authors’ contributions
HD designed this study. MMF, MCZ, YQL, NJ, QM, JW, ZYY and WJG collected
patients’ data. The analysis and interpretation of data were processed by
MMF and MCZ. Each author participated in writing of the manuscript. All
authors have read and approved the manuscript. Each author gave final
agreement to be accountable for all aspects of the work in ensuring that
questions related to the accuracy or integrity of any part of the work are
appropriately investigated and resolved.
Funding
This work was mainly supported by the National Natural Science Foundation
of China (grant number 81971573), and partially supported by the Project of
Invigorating Health Care through Science, Technology and Education,
Jiangsu Provincial Medical Youth Talent (grant number QNRC2016709). And
the funders had no role in study design, data collection and analysis,
decision to publish, or preparation of the manuscript.
Availability of data and materials
The datasets analyzed during the current study are available from the
corresponding author on reasonable request.
References
1. Bray F, Ferlay J, Soerjomataram I, Siegel RL, Torre LA, Jemal A. Global cancer
statistics 2018: GLOBOCAN estimates of incidence and mortality worldwide
for 36 cancers in 185 countries. CA-CANCER J CLIN. 2018;68(6):394–424.
2. EASL Clinical Practice Guidelines. Management of hepatocellular carcinoma.
J Hepatol. 2018;69(1):182–236.
3. Qiang L, Huikai L, Butt K, Wang PP, Hao X. Factors associated with disease
survival after surgical resection in Chinese patients with hepatocellular
carcinoma. World J Surg. 2006;30(3):439–45.
4. Shah SA, Greig PD, Gallinger S, Cattral MS, Dixon E, Kim RD, Taylor BR, Grant
DR, Vollmer CM. Factors associated with early recurrence after resection for
hepatocellular carcinoma and outcomes. J Am Coll Surg. 2006;202(2):275–83.
5. Nagasue N, Uchida M, Makino Y, Takemoto Y, Yamanoi A, Hayashi T, Chang
YC, Kohno H, Nakamura T, Yukaya H. Incidence and factors associated with
intrahepatic recurrence following resection of hepatocellular carcinoma.
Gastroenterology. 1993;105(2):488–94.
6. Martins A, Cortez-Pinto H, Marques-Vidal P, Mendes N, Silva S, Fatela N,
Gloria H, Marinho R, Tavora I, Ramalho F, et al. Treatment and prognostic
factors in patients with hepatocellular carcinoma. Liver Int. 2006;26(6):680–7.
7. Zhou L, Rui JA, Ye DX, Wang SB, Chen SG, Qu Q. Edmondson-Steiner
grading increases the predictive efficiency of TNM staging for long-term
survival of patients with hepatocellular carcinoma after curative resection.
World J Surg. 2008;32(8):1748–56.
8. Roayaie S, Schwartz JD, Sung MW, Emre SH, Miller CM, Gondolesi GE,
Krieger NR, Schwartz ME. Recurrence of hepatocellular carcinoma after liver
transplant: patterns and prognosis. Liver Transpl. 2004;10(4):534–40.
9. Tamura S, Kato T, Berho M, Misiakos EP, O'Brien C, Reddy KR, Nery JR, Burke
GW, Schiff ER, Miller J, et al. Impact of histological grade of hepatocellular
carcinoma on the outcome of liver transplantation. Arch Surg. 2001;136(1):
25–30 31.
10. Huang K, Dong Z, Cai H, Huang M, Peng Z, Xu L, Jia Y, Song C, Li ZP, Feng
ST. Imaging biomarkers for well and moderate hepatocellular carcinoma:
preoperative magnetic resonance image and histopathological correlation.
BMC Cancer. 2019;19(1):364.
11. Stigliano R, Burroughs AK. Should we biopsy each liver mass suspicious for
HCC before liver transplantation?--no, please don't. J Hepatol. 2005;43(4):
563–8.
12. Stigliano R, Marelli L, Yu D, Davies N, Patch D, Burroughs AK. Seeding
following percutaneous diagnostic and therapeutic approaches for
hepatocellular carcinoma. What is the risk and the outcome? Seeding risk
for percutaneous approach of HCC. Cancer Treat Rev. 2007;33(5):437–47.
13. Kogita S, Imai Y, Okada M, Kim T, Onishi H, Takamura M, Fukuda K, Igura T,
Sawai Y, Morimoto O, et al. Gd-EOB-DTPA-enhanced magnetic resonance
images of hepatocellular carcinoma: correlation with histological grading
and portal blood flow. Eur Radiol. 2010;20(10):2405–13.
Feng et al. BMC Cancer
(2020) 20:611
14. Nishie A, Yoshimitsu K, Okamoto D, Tajima T, Asayama Y, Ishigami K,
Kakihara D, Nakayama T, Takayama Y, Shirabe K, et al. CT prediction of
histological grade of hypervascular hepatocellular carcinoma: utility of the
portal phase. Jpn J Radiol. 2013;31(2):89–98.
15. Castellano G, Bonilha L, Li LM, Cendes F. Texture analysis of medical images.
Clin Radiol. 2004;59(12):1061–9.
16. Scalco E, Rizzo G. Texture analysis of medical images for radiotherapy
applications. Br J Radiol. 2017;90(1070):20160642.
17. Eun NL, Kang D, Son EJ, Park JS, Youk JH, Kim JA, Gweon HM. Texture
Analysis with 3.0-T MRI for Association of Response to Neoadjuvant
Chemotherapy in Breast Cancer. Radiology. 2019;294(1):182718.
18. Colakoglu B, Alis D, Yergin M. Diagnostic value of machine learning-based
quantitative texture analysis in differentiating benign and malignant thyroid
nodules. J Oncol. 2019;2019:6328329.
19. Kielar AZ, Chernyak V, Bashir MR, Do RK, Fowler KJ, Mitchell DG, Cerny M,
Elsayes KM, Santillan C, Kamaya A, et al. LI-RADS 2017: An update. J Magn
Reson Imaging. 2018;47(6):1459–74.
20. Szczypinski PM, Strzelecki M, Materka A, Klepaczko A. MaZda--a software
package for image texture analysis. Comput Methods Prog Biomed. 2009;
94(1):66–76.
21. Yan L, Liu Z, Wang G, Huang Y, Liu Y, Yu Y, Liang C. Angiomyolipoma with
minimal fat: differentiation from clear cell renal cell carcinoma and papillary
renal cell carcinoma by texture analysis on CT images. Acad Radiol. 2015;
22(9):1115–21.
22. Lee JH, Lee JM, Kim SJ, Baek JH, Yun SH, Kim KW, Han JK, Choi BI.
Enhancement patterns of hepatocellular carcinomas on multiphasic
multidetector row CT: comparison with pathological differentiation. Brit J
Radiol. 2012;85(1017):E573–83.
23. Chen WT, Chau GY, Lui WY, Tsay SH, King KL, Loong CC, Wu CW. Recurrent
hepatocellular carcinoma after hepatic resection: prognostic factors and
long-term outcome. EJSO-Eur J Surg Onc. 2004;30(4):414–20.
24. Zhou H, Vallieres M, Bai HX, Su C, Tang H, Oldridge D, Zhang Z, Xiao B, Liao
W, Tao Y, et al. MRI features predict survival and molecular markers in
diffuse lower-grade gliomas. Neuro-Oncol. 2017;19(6):862–70.
25. Holli-Helenius K, Salminen A, Rinta-Kiikka I, Koskivuo I, Bruck N, Bostrom P,
Parkkola R. MRI texture analysis in differentiating luminal a and luminal B
breast cancer molecular subtypes - a feasibility study. BMC Med Imaging.
2017;17(1):69.
26. Gillies RJ, Kinahan PE, Hricak H. Radiomics: images are more than pictures,
they are data. Radiology. 2016;278(2):563–77.
27. Mule S, Thiefin G, Costentin C, Durot C, Rahmouni A, Luciani A, Hoeffel C.
Advanced hepatocellular carcinoma: pretreatment contrast-enhanced CT
texture parameters as predictive biomarkers of survival in patients treated
with Sorafenib. Radiology. 2018;288(2):445–55.
28. Li Y, Yan C, Weng S, Shi Z, Sun H, Chen J, Xu X, Ye R, Hong J. Texture
analysis of multi-phase MRI images to detect expression of Ki67 in
hepatocellular carcinoma. Clin Radiol. 2019;74(10):813–9.
29. Lubner MG, Smith AD, Sandrasegaran K, Sahani DV, Pickhardt PJ. CT texture
analysis: definitions, applications, biologic correlates, and challenges.
Radiographics. 2017;37(5):1304–483.
30. Zhou W, Zhang L, Wang K, Chen S, Wang G, Liu Z, Liang C. Malignancy
characterization of hepatocellular carcinomas based on texture analysis of
contrast-enhanced MR images. J Magn Reson Imaging. 2017;45(5):1476–84.
31. Fang WH, Li XD, Zhu H, Miao F, Qian XH, Pan ZL, Lin XZ. Resectable
pancreatic ductal adenocarcinoma: association between preoperative CT
texture features and metastatic nodal involvement. Cancer Imaging. 2020;
20(171):17.
32. Kaseb AO, Hassan M, Lacin S, Abdel-Wahab R, Amin HM, Shalaby A, Wolff
RA, Yao J, Rashid A, Vennapusa B, et al. Evaluating clinical and prognostic
implications of Glypican-3 in hepatocellular carcinoma. Oncotarget. 2016;
7(43):69916–26.
33. Yamauchi N, Watanabe A, Hishinuma M, Ohashi K, Midorikawa Y, Morishita
Y, Niki T, Shibahara J, Mori M, Makuuchi M, et al. The glypican 3 oncofetal
protein is a promising diagnostic marker for hepatocellular carcinoma.
Modern Pathol. 2005;18(12):1591–8.
34. Guo M, Zhang H, Zheng J, Liu Y. Glypican-3: a new target for diagnosis and
treatment of hepatocellular carcinoma. J Cancer. 2020;11(8):2008–21.
Publisher’s Note
Springer Nature remains neutral with regard to jurisdictional claims in
published maps and institutional affiliations.
Page 10 of 10