The E2F4 prognostic signature predicts pathological response to neoadjuvant chemotherapy in breast cancer patients
Bạn đang xem bản rút gọn của tài liệu. Xem và tải ngay bản đầy đủ của tài liệu tại đây (1.96 MB, 11 trang )
Mark et al. BMC Cancer (2017) 17:306
DOI 10.1186/s12885-017-3297-2
RESEARCH ARTICLE
Open Access
The E2F4 prognostic signature predicts
pathological response to neoadjuvant
chemotherapy in breast cancer patients
Kenneth M. K. Mark1†, Frederick S. Varn1†, Matthew H. Ung1, Feng Qian2 and Chao Cheng1,3,4*
Abstract
Background: Neoadjuvant chemotherapy is a key component of breast cancer treatment regimens and pathologic
complete response to this therapy varies among patients. This is presumably due to differences in the molecular
mechanisms that underlie each tumor’s disease pathology. Developing genomic clinical assays that accurately categorize
responders from non-responders can provide patients with the most effective therapy for their individual disease.
Methods: We applied our previously developed E2F4 genomic signature to predict neoadjuvant chemotherapy response
in breast cancer. E2F4 individual regulatory activity scores were calculated for 1129 patient samples across 5 independent
breast cancer neoadjuvant chemotherapy datasets. Accuracy of the E2F4 signature in predicting neoadjuvant
chemotherapy response was compared to that of the Oncotype DX and MammaPrint predictive signatures.
Results: In all datasets, E2F4 activity level was an accurate predictor of neoadjuvant chemotherapy response, with
high E2F4 scores predictive of achieving pathologic complete response and low scores predictive of residual
disease. These results remained significant even after stratifying patients by estrogen receptor (ER) status, tumor
stage, and breast cancer molecular subtypes. Compared to the Oncotype DX and MammaPrint signatures, our
E2F4 signature achieved similar performance in predicting neoadjuvant chemotherapy response, though all
signatures performed better in ER+ tumors compared to ER- ones. The accuracy of our signature was reproducible
across datasets and was maintained when refined from a 199-gene signature down to a clinic-friendly 33-gene panel.
Conclusion: Overall, we show that our E2F4 signature is accurate in predicting patient response to neoadjuvant
chemotherapy. As this signature is more refined and comparable in performance to other clinically available gene
expression assays in the prediction of neoadjuvant chemotherapy response, it should be considered when
evaluating potential treatment options.
Keywords: Breast cancer, Neoadjuvant chemotherapy, ChIP-seq, Transcription factor, E2F4, Pathologic complete response
Background
Neoadjuvant chemotherapy is a well-established treatment regimen used in managing patients with earlystage breast cancer [1]. In large or inoperable tumors,
this therapy has been shown to substantially reduce
tumor size allowing for easier removal and potentially
breast conserving surgery [2, 3]. In some cases,
* Correspondence:
†
Equal contributors
1
Department of Molecular and Systems Biology, Geisel School of Medicine at
Dartmouth, Hanover, NH 03755, USA
3
Department of Biomedical Data Science, Geisel School of Medicine at
Dartmouth, Lebanon, NH 03766, USA
Full list of author information is available at the end of the article
administration of neoadjuvant chemotherapy may result
in a substantial remission of the disease known as
pathologic complete response (pCR), which is ascertained by pathological analysis of the resected tissue.
However, in many cases, the disease may still be pathologically evident in the tissue, indicating the presence
of residual disease (RD) [4]. Understanding the factors
behind patients’ response to neoadjuvant chemotherapy
may be beneficial in determining their personal treatment regimen and predicting their overall prognosis.
Though the benefits of neoadjuvant chemotherapy are
clear, only a minority of breast cancer patients achieve
pCR [5, 6]. The risk of RD means that neoadjuvant
© The Author(s). 2017 Open Access This article is distributed under the terms of the Creative Commons Attribution 4.0
International License ( which permits unrestricted use, distribution, and
reproduction in any medium, provided you give appropriate credit to the original author(s) and the source, provide a link to
the Creative Commons license, and indicate if changes were made. The Creative Commons Public Domain Dedication waiver
( applies to the data made available in this article, unless otherwise stated.
Mark et al. BMC Cancer (2017) 17:306
therapy may delay time to surgery without significant
benefit [7]. Thus, it is important to better identify the
patients most likely to achieve pCR. To date, prediction
methods using imaging modalities such as mammography, radiology, and MRI have had limited success [8].
However, with the recent advent of high-throughput
sequencing technology, several molecular assays have
been developed to predict response to neoadjuvant
chemotherapy [9–11]. One such assay, Oncotype DX [9]
generates a predicted recurrence score based on the expression profile of 21 genes, and has shown promise in
predicting neoadjuvant chemotherapy response in ERpositive patients. [12, 13] Another assay, Agendia’s
MammaPrint [10, 11, 14] utilizes a 70-gene expression
panel to determine a recurrence risk for early stage
breast cancer. However, this assay must be combined
with an additional 80-gene molecular subtyping assay,
BluePrint [15], to predict neoadjuvant response [16].
We have previously developed a gene signature using
chromatin immunoprecipitation sequencing (ChIP-seq)inferred target genes of the transcription factor E2F4.
E2F4 is a key regulator of the cell cycle, and patients
exhibiting high expression of E2F4 target genes exhibit
more severe cancer and shorter survival [17]. A followup study to our work revealed that the E2F4 signature is
also predictive of neoadjuvant anthracycline-based
chemotherapy response, even after adjusting for tumor
grade [18]. In this study, we extend this work to assess
the performance of our E2F4 signature in multiple independent datasets made up of diverse subtypes of breast
cancer that undergo various regimens of neoadjuvant
chemotherapy. We show that our signature performs
comparably to the leading signatures on the market and
demonstrate that a smaller gene signature composed of 28
E2F4 target genes and 5 control genes remains predictive
of neoadjuvant chemotherapy response. Our results suggest that the transcriptional activity of E2F4 is predictive
of chemotherapy response and demonstrates the potential
of our E2F4 signature to be used as a clinical genomic
assay to predict neoadjuvant chemotherapy.
Methods
Gene expression and clinical data
Breast cancer gene-expression datasets were downloaded
from the NCBI’s Gene Expression Omnibus (GEO) database (GSE25066, GSE25055, GSE25065, GSE41998,
GSE22093, GSE23988, GSE20271; Additional file 1), and
together contained gene expression profiles for a total of
1129 primary patient tumors. An additional two-channel
Agilent microarray breast cancer dataset was obtained
from the Cancer Genome Atlas (Level 3) [19]. Each
dataset chosen contained a minimum of 60 patients that
underwent neoadjuvant therapy after tumor biopsy and
included neoadjuvant therapy response information
Page 2 of 11
categorized as pCR or RD. For all datasets, processed
data was used as available from GEO. For one-channel
(Affymetrix) arrays, probesets were converted into gene
symbol. In cases where multiple probesets existed for
the same gene, the probeset with the highest average
intensity across all samples was used.
Calculation of the E2F4 signature
The 199-gene binary E2F4 target gene signature was
determined as described previously [17]. This signature,
along with a patient gene expression matrix were provided to the BASE (Binding Associated with Sorted
Expression) algorithm [20, 21] to generate individual
Regulatory Activity Scores (iRASs) representing E2F4
activity for each patient sample. For BASE to function,
gene expression profiles from the input patient dataset
must be quantile normalized and then, if the dataset is
from a one-channel array, median centered. BASE then
calculates the iRAS by ranking each patient’s normalized
gene expression profile from high to low based on
expression level and then determining the location of
each E2F4 target gene in the ranked profile. Based on
these ranked expression profiles, BASE then calculates
two cumulative distribution functions comparing the relative expression of the E2F4 target genes (foreground function) to that of all other genes within the expression
profile (background function). BASE calculates a preliminary E2F4 activity score by taking the maximal deviation between the two functions. Thus, a higher score
indicates higher relative expression of the E2F4 target
genes in the patient’s profile, meaning higher E2F4
activity, and a lower score indicates the opposite. Because this score is calculated as a difference between a
foreground and background function, there will be no
hard maximum or minimum and the scores instead will
represent relative E2F4 activity level. BASE normalizes
this score against the absolute value of the mean of a
null distribution consisting of 1000 preliminary scores
calculated from randomly permuted gene sets of equal
size to the target gene set. The resulting final iRAS can
be used to compare E2F4 activity between samples,
with a higher iRAS indicating greater E2F4 activity
compared to a lower iRAS.
Survival analyses
A univariate Cox proportional hazards model was used
to measure the association between patient E2F4 activity
and survival outcome, while Kaplan-Meier curves were
generated to visualize the survival distributions for all
binary comparisons. P-values for the Cox models were
determined using the Wald test and p-values for the
Kaplan-Meier plots were calculated using the log-rank
test. All survival analyses were performed in R through
the survival package using the coxph, survfit, and
Mark et al. BMC Cancer (2017) 17:306
survdiff functions for Cox proportional hazards models,
Kaplan-Meier curves, and log-rank tests, respectively.
Neoadjuvant response prediction
Samples were predicted as pCR or RD based on scores
derived from the E2F4, Oncotype DX, or MammaPrint
gene signatures. Oncotype DX and MammaPrint signature scores were calculated using the “oncotypedx” and
“gene70” functions, respectively, from the genefu R package [22]. To predict neoadjuvant chemotherapy response
for each prognostic signature, samples were ranked from
low to high based on their signature-specific score. For
each patient, a threshold was set, beginning with the
lowest score, where all patients with a score less than or
equal to the threshold were predicted to be RD and all
samples above the threshold were predicted to be pCR.
The sensitivity and specificity was then calculated for
each threshold by comparing the predicted results to the
actual results. Accuracy of each test was determined by
calculating the area under the resulting receiver operating characteristics curve (AUC).
To test the performance of each prognostic signature
in conjunction with clinical data, a Random Forest classifier was trained to predict pCR and RD status using
the E2F4, Oncotype DX, and/or MammaPrint signatures
as features, along with clinical data including age, tumor
stage, tumor grade, estrogen receptor (ER) status, progesterone receptor (PR) status, HER2 status, and lymph
node metastasis status. Random forest classification was
performed in R through the randomForest package using
the randomForest function under default settings. The
performance of the model was evaluated by way of 10fold cross validation where samples were randomly
divided into 10 subsets, with 9 subsets used to train the
model and predict the likely neoadjuvant response of the
remaining validation subset. This process was repeated
10 times so that each sample was a part of the validation
set at least once. Model effectiveness was assessed by
calculating the AUC. This overall cross-validation
procedure was repeated a total of 100 times to obtain an
overall average AUC.
Construction of the 33-gene E2F4 signature
A reduced E2F4 target gene signature of 34 genes was
determined by identifying all E2F4 target genes whose
own expression correlated highly (R > 0.8) with E2F4
scores in the TCGA BRCA dataset. Since all breast
cancer datasets used in this study were obtained from
one-channel array platforms, we used the Wang data
(GSE2034) [23], which contains the expression profiles
for 286 lymph-node-negative primary breast cancer patients, to define the formula for calculating E2F4 scores.
First, we retrieved the log expression values of 28 genes
from the dataset (of the initial 34 genes; 6 were missing
Page 3 of 11
in the Wang data) and normalized them into relative expression values by subtracting the average expression
values (at log scale) of 5 control genes (ACTB, GAPDH,
RPLP0, GUSB, TFRC). Second, we performed principle
component analysis (PCA) on the normalized expression
data for these 28 genes to obtain the first principle component (PC1). Since these genes are all highly correlated
with E2F4 score across samples, PC1 explains a large
fraction of their variation and is highly correlated with
E2F4 score. Third, based on the PCA result, we calculated
E2F4 using the following equation:
E2F4 score ¼ β1 e1 þ β2 e2 þ … þ βn en
where βi is the loading of gene i for PC1, ei is the
expression level of gene i in the sample, and n is the
number of genes (n = 28). [24] Given this equation,
E2F4 can be calculated when the relative expression
levels (ei) of these 28 genes are quantified. The expression levels of these genes can be obtained by RT-PCR or
other techniques using the same set of 5 control genes
for normalization. In this analysis, we obtained their
expression values from microarray data.
Results
E2F4 regulatory activity level predicts neoadjuvant
response
To examine the differences in E2F4 activity between
pCR and RD patients, we calculated an E2F4 iRAS for
each tumor in the Hatzis et al. dataset, which contains
gene expression and clinical information for patients
who underwent neoadjuvant chemotherapy [25]. Examining the scores across samples revealed that they were
distributed in a bimodal fashion (Fig. 1a). Subsetting
these scores by ER status revealed that each group
roughly followed a bimodal distribution as well; though
ER-negative patients tended to be enriched for high
E2F4 iRASs, a likely reflection of their higher proliferation rates. To examine how E2F4 activity affected patient
survival in this dataset, we stratified the patients into
high (iRAS >0) and low (iRAS <0) E2F4 activity groups
and compared their two survival distributions using a
log-rank test (Fig. 1b). Patients with low E2F4 activity
had significantly longer survival times than patients with
high E2F4 activity (p = 7e-03; log-rank test), consistent
with our previous findings [17]. The E2F4 score
remained significant when used as a continuous variable
in a univariate Cox proportional hazards model (p = 8e3, HR = 1.09; Wald test).
We next examined the association between E2F4 score
and neoadjuvant chemotherapy response. Patients that
exhibited pCR had significantly higher E2F4 scores compared to RD patients (p = 5e-07, Wilcoxon rank-sum
test; Fig. 1c), suggesting a potential role of E2F4 in
Mark et al. BMC Cancer (2017) 17:306
Page 4 of 11
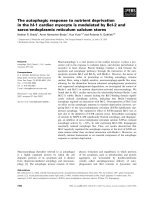
Fig. 1 E2F4 activity and response to neoadjuvant chemotherapy. a Distribution of E2F4 activity scores for all patients (grey), ER-positive patients
(magenta), and ER-negative patients (aqua). Black dotted lines indicate thresholds at which low, intermediate, and high E2F4 activity patient groups
were stratified on. Solid black line indicates the threshold to stratify patients into low and high E2F4 activity groups for subsequent survival analyses.
b Patients with high E2F4 activity (red) were associated with significantly shorter distant recurrence free survival time (DRFS) compared to patients with
low E2F4 scores (green). Vertical hash marks indicate censored patients. c Comparison of E2F4 activity scores between patients achieving pathological
complete response (pCR) and patients with residual disease (RD). d Comparison of E2F4 activity between patients with varying residual cancer burden:
RCB-0/1 (white), RCB-II (grey) and RCB-III (dark grey) e Percentages of pCR and RD patients in E2F4 activity groups. f Receiver Operating Characteristic
(ROC) curves for pCR prediction using E2F4 activity scores as features and 10-fold cross validation. ROC curves were generated for all (black),
ER-positive only (magenta), and ER-negative only (aqua) patients
response prediction. To further examine this relationship, we stratified patients by degree of residual cancer
burden (RCB) as defined in the Hatzis dataset, with categories consisting of RCB-0 (pCR) to RCB-III (extensive
RD). Patients with lower RCB tended to have higher
E2F4 iRASs compared to higher RCB patients (Fig. 1d).
Specifically, we found that patients with RCB-0 (pCR) or
RCB-I (minimal RD) had significantly higher E2F4 iRASs
than RCB-II (moderate RD) and RCB-III (extensive RD)
patients (p = 3e-07 and 8e-05, respectively; Wilcoxon
rank-sum test). Together, these results indicate that
patients exhibiting high E2F4 activity were more likely
to experience pCR.
To further validate the association we observed
between E2F4 iRAS and neoadjuvant therapy response,
we stratified patients into low, intermediate, and high
E2F4 activity groups based on the distribution of E2F4
iRASs (dotted lines, Fig. 1a). Thresholds for each group
were based off local maxima within the E2F4 score distribution, with the low class consisting of patients whose
scores were less than the negative local maxima, the
high class consisting of patients with scores greater than
the positive local maxima, and the intermediate class
consisting of the patients in between the high and low
thresholds. Interestingly, we found that the class-specific
pCR rates rose with each group from low to high, increasing from 6.8% to 17.4% to 38% (Fig. 1e). Furthermore, patients in the combined intermediate and high
groups exhibited significantly higher rates of pCR compared to the low group (p = 4e-09; Fisher’s exact test).
Mark et al. BMC Cancer (2017) 17:306
These results further suggested that E2F4 activity level
can serve as a good predictor of pCR in breast cancer.
To test this hypothesis, we used the E2F4 score of each
patient as a threshold to classify patients as pCR or RD.
This classification system achieved high accuracy, with
an AUC of 0.71 (Fig. 1f ). Stratifying samples into ER status and repeating this procedure resulted in AUCs of
0.75 and 0.62 for ER-positive and ER-negative, respectively. Together, these results indicate that the E2F4 iRAS
by itself is a good predictor of pCR achievement after
neoadjuvant chemotherapy.
While our E2F4-based classification achieved good
prediction accuracy across all samples, it may have been
confounded by subtype-specific composition of the pCR
and RD groups. To address this, we examined the association between E2F4 activity and neoadjuvant therapy
response across different subgroupings of breast cancer,
including ER status (Fig. 2a), tumor stage (Fig. 2b), and
molecular subtype (Fig. 2c). For each subcategory, the
rate of pCR was compared between the low, intermediate, and high E2F4 groups. In nearly all subcategories,
the E2F4-high group exhibited the highest rate of pCR
with chi-square tests indicating that there was a significant difference in pCR rate between the three groups.
An exception to this trend was observed in subcategories known for more severe, highly proliferative cancers,
such as the basal and ER negative subtypes and high
stage tumors, where the differences in E2F4 iRAS were
less pronounced. Based on these results, it is unlikely
that E2F4-based classification was confounded by the
composition of clinical features in the pCR and RD
groups.
Comparison of the E2F4 signature with other
clinically-available prognostic assays
By using the E2F4 signature, we achieved good accuracy
in classifying samples into pCR and RD. To benchmark
our performance, we compared our results with the
clinically-available prognostic assays Oncotype DX [9]
and the MammaPrint 70-gene breast cancer recurrence
assay [14]. To test the performance of each assay, we
calculated the E2F4 iRAS, Oncotype DX score and
MammaPrint 70-gene score on the Hatzis et al. discovery and validation cohorts individually and determined
their accuracy by calculating the AUC, as we did previously (Fig. 3). Overall, the accuracy of the E2F4 signature
was comparable to the other clinically-available assays in
both the discovery and validation cohorts and this
remained true when each assay was used to predict
response in ER-positive and ER-negative patients.
Generally, when determining a patient’s treatment
regimen, the results of these assays are combined with
additional clinical information. To address this, we used
a Random Forest classifier to determine how well our
Page 5 of 11
E2F4-based predictor performed in conjunction with
clinical information and then compared the results to
those using the MammaPrint and Oncotype DX signatures. Patients were first stratified into ER-positive and
ER-negative groups and then for each group a classifier
was trained using age, tumor stage, tumor grade, ER status, PR status, HER2 status, and lymph node metastasis
status as features, in addition to scores from the E2F4,
MammaPrint, or Oncotype DX signatures, depending on
the comparison being made.
In ER-positive patients, integrating individual scores
with clinical data improved the predictions from an
AUC of 0.64 in clinical data only to 0.70 and 0.71 for the
E2F4 and Oncotype DX scores, respectively (Fig. 4a).
Interestingly, including the MammaPrint 70-gene signature did not improve predictive accuracy compared to
clinical information alone. Using scores from all three
signatures as features to predict pCR did not dramatically improve the AUC compared to either the E2F4 or
Oncotype DX signatures alone, implying that combining
the signatures together does not increase predictive
value. In ER-negative patients, the average AUCs were
much lower than those of the ER-positive patients. For
this subtype, integrating the E2F4 and MammaPrint
scores with clinical information led to a substantial
boost in predictive accuracy, with AUCs rising from 0.50
to 0.56 and 0.55 in E2F4 and MammaPrint, respectively
(Fig. 4b). As with the ER-positive cohort, including all
three signatures as features along with clinical information did not result in a substantial improvement compared to the individual signatures, suggesting that
combining these signatures provided little additional information. Based on these results, combining each of the
gene signature scores with clinical information can
improve the predictive accuracy compared to clinical information alone. Interestingly, the E2F4 signature was
the only signature that added to predictive accuracy in
both the ER-positive and ER-negative patient cohorts,
suggesting that it may be a slightly more versatile test of
neoadjuvant therapy response.
Validation of the E2F4 signature in other datasets
To validate our results found from the Hatzis dataset,
we applied our E2F4 signature to predict neoadjuvant
response in four independent datasets by Iwamoto et
al. (2010), Iwamoto et al. (2011) [26], Tabchy et al. [27],
and Horak et al. [28]. For each dataset, we stratified patients into low, intermediate and high E2F4 groups and
calculated the pCR rate among each as well as the
AUCs to assess predictive accuracy for each of the 3
signatures: E2F4, OncotypeDX and MammaPrint.
Across all 4 datasets, the pCR rate was highest in
patients with high E2F4 activity (Fig. 5a). Patients with
high E2F4 activity also had pCR rates far above the
Mark et al. BMC Cancer (2017) 17:306
Page 6 of 11
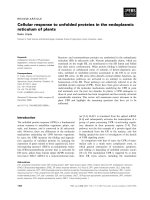
Fig. 2 Percentage of patients achieving pCR in E2F4 activity groups after stratification on clinicopathological characteristics in the Hatzis dataset.
a Percentage of patients achieving pCR with low (white), intermediate (grey), and high (dark grey) E2F4 activity groups for all, ER-positive, and
ER-negative patients, respectively. b Percentage of patients achieving pCR with low (white), intermediate (grey), and high (dark grey) E2F4 activity
groups in patients with different tumor stage. c Percentage of patients achieving pCR with low (white), intermediate (grey), and high (dark grey)
E2F4 activity groups in patients belonging to different molecular subtypes. In all panels, horizontal dotted line indicates the percentage of pCR
patients without stratifying based on E2F4 activity. P-values were calculated using the χ2 test
baseline pCR rate. These results were highly consistent
with the Hatzis results, indicating that the E2F4 iRAS
associations with pCR were not specific to a single
dataset. In addition to these trends, the predictive
accuracy of the E2F4 iRAS was consistent between
datasets and performed comparably to the MammaPrint and Oncotype DX signatures (Fig. 5b). This
reproducible performance further supports the E2F4
signature’s utility as a predictive test to determine the
administration of neoadjuvant chemotherapy.
A modified E2F4 signature composed of 33 genes is
highly predictive of chemotherapy response.
Calculation of E2F4 iRASs from the 199-gene signature
requires a full patient microarray for normalization.
While the iRASs from this signature proved to be predictive of neoadjuvant therapy response across datasets,
the large amount of data required for calculation may be
cost-prohibitive in a clinical setting. To address this, we
reduced this signature down to a core set of 28 E2F4 target genes that best captured the information conferred
Mark et al. BMC Cancer (2017) 17:306
Page 7 of 11
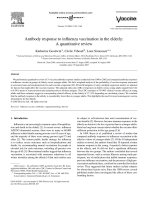
Fig. 3 Comparison of pCR classification performance between the E2F4, Oncotype DX, and MammaPrint signatures in the Hatzis discovery and
validation patient cohorts. pCR classification performance was evaluated using the E2F4, Oncotype DX, and Mammaprint signatures. ROC curves
were plotted for all (black), ER+ (magenta) and ER- (aqua) patients. Grey dotted line indicates random classification performance
Fig. 4 Classification performance after including clinicopathological features into pCR classification models. Comparison of AUCs between
combinations of the E2F4 signature, Oncotype DX, MammaPrint, and clinicopathological features in a ER-positive patients and b ER-negative
patients. Error bars indicate standard deviation calculated by performing 10-fold cross-validation 100 times
Mark et al. BMC Cancer (2017) 17:306
Page 8 of 11
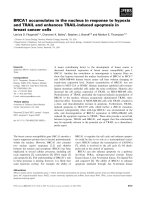
Fig. 5 Comparison of pCR classification performance between the E2F4 signature, Oncotype DX, and MammaPrint in 4 independent datasets.
a Percentage of pCR patients in low (white), intermediate (grey), and high (dark grey) E2F4 activity groups in the Iwamoto (2010), Iwamoto (2011),
Tabchy, and Horak datasets. P-values were calculated using the χ2 test. b pCR classification performance using features from the E2F4 signature
(black), Oncotype DX (red), and MammaPrint (green) in the Iwamoto (2010), Iwamoto (2011), Tabchy, and Horak datasets. Grey dotted line
corresponds to random classification and an AUC of 0.5
by the original signature as well as 5 control genes used
for normalization. Applying this signature to the Hatzis
combined dataset, revealed a unimodal distribution of
E2F4 iRASs as opposed to the bimodal distribution
observed with the full signature. Thus, we sorted and
equally divided patients into E2F4 low, intermediate, and
high activity groups, as we could not use the two local
maxima as cutoffs for class inclusion as we did with the full
signature (Fig. 6a). We then calculated the number of
patients in each category that achieved pCR and found, as
with the full signature, that the rate of pCR increased moving from the low to intermediate to high classes (Fig. 6b).
As a predictor of neoadjuvant chemotherapy response, the
reduced signature’s performance proved to be comparable
to that of the entire E2F4 signature (AUC = 0.710 versus
0.712 in the reduced and full signatures, respectively;
(Fig. 6c). This trend was further observed when predicting ER-positive (AUC = 0.746 versus 0.712) and ERnegative patients (AUC = 0.626 versus 0.621). Together,
these results suggest that the 33-gene E2F4 signature
serves as an acceptable, more cost-effective substitute for
the full signature in predicting neoadjuvant therapy response, making it a good candidate for clinical adaptation.
Discussion
E2F4 is an essential cell cycle regulator that has been
broadly implicated in tumorigenesis and cancer severity
[29–31]. We previously developed a gene signature composed of E2F4 target genes predicted from ChIP-seq
data and showed that this signature was a more effective
tool to infer regulatory activity than expression of the
transcription factor alone [17]. Patients with high E2F4
activity had significantly worse survival than patients
with low activity, a trend consistent with other markers
of tumor proliferation rate. In this study, we applied our
signature to predict neoadjuvant therapy response and
found that patients with high E2F4 iRASs were more
likely to experience pCR than those with low and intermediate scores even when stratifying by breast cancer
subtype. This result is unsurprising, as chemotherapeutic
approaches target rapidly proliferating cells and high
E2F4 regulatory activity is associated with high cellular
proliferation rate [26, 32]. When stratifying patients into
groups based on ER status, tumor stage, and molecular
subtype, a high E2F4 iRAS continued to be indicative of
improved pCR rate. The only time this trend did not
hold was for the severe classes of breast cancer, defined
Mark et al. BMC Cancer (2017) 17:306
Page 9 of 11
Fig. 6 Performance of the modified E2F4 score when predicting pCR status in the Hatzis dataset. a Distribution of E2F4 activity scores based on
the 33-gene signature. Vertical hashed lines indicate quantile divisions used to denote low (white), intermediate (grey), or high (dark grey) E2F4
activity. b Percentage of patients with pCR or RD that fall within the low (white), intermediate (grey) or high (dark grey) E2F4 score categories.
P-value was calculated using the χ2 test. c ROC curves showing pCR classification performance when using the E2F4 scores calculated from the
33-gene signature in all (black), ER-positive (magenta), and ER-negative (aqua) patients. Grey dotted line corresponds to random classification and
an AUC of 0.5
by ER-negative status, high tumor stage, or a basal-like
or HER2-enriched molecular subtype. We have shown
previously that these subtypes exhibit high baseline E2F4
iRASs [17]. Thus, the E2F4 iRAS may not provide
adequate resolution to identify the highly proliferative
patients most likely to respond to neoadjuvant chemotherapy. Going forward, it will be important to improve
our methods to better predict pCR rate for these severe
subtypes of breast cancer.
The success of our E2F4-based predictions led us to
assess the performance of our signature relative to the
clinically available tests, Oncotype DX and MammaPrint.
While these assays were originally intended to predict
adjuvant chemotherapy response, recent reports have
shown that they can also be applied to predict neoadjuvant chemotherapy. For example, the Oncotype DX
recurrence score has been shown to predict response to
neoadjuvant docetaxel, while the MammaPrint 70-gene
signature was recently involved in studies predicting
neoadjuvant chemotherapy response when combined
with the Blueprint 80-gene molecular subtyping predictor [12, 13, 16, 33, 34]. As a univariate predictor, our
E2F4 signature performed similarly to each clinical test,
validating its use as a predictor of neoadjuvant therapy
response. Additionally, when assessing the performance
of each predictor in conjunction with clinical information, the E2F4 signature again performed comparably,
and was the only signature to provide additional, albeit
minor, information in both ER-positive and ER-negative
sample cohorts. These findings indicate that the E2F4
signature may be able to provide predictive accuracy to
a wider range of patients, though the utility of this extra
information may be small.
The results from our E2F4 signature were promising,
however calculation of the E2F4 iRAS requires the use
of full patient microarrays, making it impractical for
clinical use. To address this, we identified the E2F4
target genes most correlated with E2F4 iRAS and then
combined these genes with a series of 5 control genes
that could be used to calculate relative gene expression.
The resulting 33-gene signature achieved similar predictive accuracy to the full signature, proving that this core
set was adequate to infer E2F4 activity and predict
neoadjuvant response. By distilling E2F4 activity into a
reduced signature, we removed the microarray requirement for E2F4 iRAS calculation, resulting in a 33-gene
panel that could instead be measured through more
common clinical practices, such as RT-PCR. Going forward, this signature reduction method could easily be
applied to additional microarray-dependent gene signatures, expediting their transition from the field of basic
science to clinical application.
Conclusion
In conclusion, we have demonstrated that a target genebased signature of the transcription factor E2F4 can be
used to predict response to neoadjuvant chemotherapy.
Patients exhibiting high E2F4 scores were more likely to
achieve pCR than patients with lower scores, further
validating that the cellular proliferation rate in a patient’s
tumor is a good biomarker for predicting neoadjuvant
response. Our E2F4 signature performed comparably to
signatures already available in the clinic, both as a univariate measurement and when integrated with clinical data.
This performance was maintained when the signature was
reduced from a microarray-dependent 199-gene signature
to an independent 33-gene signature, indicating its potential for clinical adaptation. This study, while providing the
basis for a potential clinical tool to predict neoadjuvant
chemotherapy response, additionally serves as a paradigm
Mark et al. BMC Cancer (2017) 17:306
for translating TF target gene-based signatures into predictive clinical tests, underscoring the importance of basic
research in the clinical realm.
Additional file
Additional file 1: Clinical characteristics by dataset of samples used in
analysis. Sample size and clinical characteristics, including age, estrogen
receptor status, neoadjuvant response status, and treatment protocol, for
the samples used in each dataset involved in the study. (PDF 246 kb)
Abbreviations
AUC: Area under the curve; BASE: Binding associated with sorted expression;
DRFS: Distant recurrence free survival; ER: Estrogen receptor; GEO: Gene
expression omnibus; iRAS: Individual regulatory activity score; pCR: Pathologic
complete response; RCB: Residual cancer burden; RD: Residual disease;
REACTIN: Regulatory activity inference; RT-PCR: Reverse-transcriptase polymerase
chain reaction
Acknowledgements
We thank E.H. Andrews for valuable discussions, technical assistance, and
helpful comments during manuscript preparation.
Funding
All phases of this work were supported by the American Cancer Society
(IRG-82-003-30), the National Center for Advancing Translational Sciences
of the National Institutes of Health (UL1TR001086), and the Dartmouth
SYNERGY Scholars Award. FSV was additionally supported by the National
Institute of General Medical Sciences of the National Institutes of Health
(T32GM008704).
Availability of data and materials
The datasets used in this analysis are available in the NCBI’s Gene Expression
Omnibus under the identifiers: GSE25055, GSE25065, GSE25066, GSE41998,
GSE22093, GSE23988, GSE20271. Furthermore, the BASE algorithm used to
calculate the E2F4 activity score is available at />~chaocheng/software/base/base.html.
Authors’ contributions
CC designed the methods and experiments. KMM, FSV, MHU, and CC carried
out the computation and analysis. FSV and KMM drafted the manuscript. FQ,
MHU, and CC provided advice, suggestions, and revised the manuscript. All
authors have read and approved the final version of the manuscript.
Competing interests
The authors declare that they have no competing interests.
Consent for publication
Not applicable.
Ethics approval and consent to participate
Not applicable.
Publisher’s Note
Springer Nature remains neutral with regard to jurisdictional claims in
published maps and institutional affiliations.
Author details
1
Department of Molecular and Systems Biology, Geisel School of Medicine at
Dartmouth, Hanover, NH 03755, USA. 2Ministry of Education Key Laboratory
of Contemporary Anthropology, School of Life Sciences, Fudan University,
Shanghai 200438, China. 3Department of Biomedical Data Science, Geisel
School of Medicine at Dartmouth, Lebanon, NH 03766, USA. 4Norris Cotton
Cancer Center, Lebanon, NH 03766, USA.
Page 10 of 11
Received: 15 March 2016 Accepted: 24 April 2017
References
1. Liu SV, Melstrom L, Yao K, Russell CA, Sener SF. Neoadjuvant therapy for
breast cancer. J Surg Oncol. 2010;101(4):283–91.
2. Hortobagyi GN, Ames FC, Buzdar AU, Kau SW, McNeese MD, Paulus D, Hug
V, Holmes FA, Romsdahl MM, Fraschini G, et al. Management of stage III
primary breast cancer with primary chemotherapy, surgery, and radiation
therapy. Cancer. 1988;62(12):2507–16.
3. Schwartz GF, Birchansky CA, Komarnicky LT, Mansfield CM, Cantor RI,
Biermann WA, Fellin FM, McFarlane J. Induction chemotherapy followed by
breast conservation for locally advanced carcinoma of the breast. Cancer.
1994;73(2):362–9.
4. Schott AF, Hayes DF. Defining the benefits of neoadjuvant chemotherapy
for breast cancer. J Clin Oncol. 2012;30(15):1747–9.
5. Kuerer HM, Newman LA, Smith TL, Ames FC, Hunt KK, Dhingra K, Theriault
RL, Singh G, Binkley SM, Sneige N, et al. Clinical course of breast cancer
patients with complete pathologic primary tumor and axillary lymph node
response to doxorubicin-based neoadjuvant chemotherapy. J Clin Oncol.
1999;17(2):460–9.
6. van der Hage JA, van de Velde CJ, Julien JP, Tubiana-Hulin M, Vandervelden
C, Duchateau L. Preoperative chemotherapy in primary operable breast
cancer: results from the European Organization for Research and Treatment
of cancer trial 10902. J Clin Oncol. 2001;19(22):4224–37.
7. Smith EC, Ziogas A, Anton-Culver H. Delay in surgical treatment and survival
after breast cancer diagnosis in young women by race/ethnicity. JAMA
Surg. 2013;148(6):516–23.
8. Schott AF, Roubidoux MA, Helvie MA, Hayes DF, Kleer CG, Newman LA,
Pierce LJ, Griffith KA, Murray S, Hunt KA, et al. Clinical and radiologic
assessments to predict breast cancer pathologic complete response to
neoadjuvant chemotherapy. Breast Cancer Res Treat. 2005;92(3):231–8.
9. Paik S, Shak S, Tang G, Kim C, Baker J, Cronin M, Baehner FL, Walker MG,
Watson D, Park T, et al. A multigene assay to predict recurrence of tamoxifentreated, node-negative breast cancer. N Engl J Med. 2004;351(27):2817–26.
10. van 't Veer LJ, Dai H, van de Vijver MJ, He YD, Hart AA, Mao M, Peterse HL,
van der Kooy K, Marton MJ, Witteveen AT, et al. Gene expression profiling
predicts clinical outcome of breast cancer. Nature. 2002;415(6871):530–6.
11. van de Vijver MJ, He YD, van't Veer LJ, Dai H, Hart AA, Voskuil DW, Schreiber
GJ, Peterse JL, Roberts C, Marton MJ, et al. A gene-expression signature as a
predictor of survival in breast cancer. N Engl J Med. 2002;347(25):1999–2009.
12. Ueno T, Masuda N, Yamanaka T, Saji S, Kuroi K, Sato N, Takei H, Yamamoto
Y, Ohno S, Yamashita H, et al. Evaluating the 21-gene assay recurrence
score(R) as a predictor of clinical response to 24 weeks of neoadjuvant
exemestane in estrogen receptor-positive breast cancer. Int J Clin Oncol.
2014;19(4):607–13.
13. Chang JC, Makris A, Gutierrez MC, Hilsenbeck SG, Hackett JR, Jeong J, Liu
ML, Baker J, Clark-Langone K, Baehner FL, et al. Gene expression patterns in
formalin-fixed, paraffin-embedded core biopsies predict docetaxel
chemosensitivity in breast cancer patients. Breast Cancer Res Treat. 2008;
108(2):233–40.
14. Knauer M, Mook S, Rutgers EJ, Bender RA, Hauptmann M, van de Vijver MJ,
Koornstra RH, Bueno-de-Mesquita JM, Linn SC, Van 't Veer LJ. The predictive
value of the 70-gene signature for adjuvant chemotherapy in early breast
cancer. Breast Cancer Res Treat. 2010;120(3):655–61.
15. Krijgsman O, Roepman P, Zwart W, Carroll JS, Tian S, de Snoo FA, Bender
RA, Bernards R, Glas AM. A diagnostic gene profile for molecular subtyping
of breast cancer associated with treatment response. Breast Cancer Res
Treat. 2012;133(1):37–47.
16. Whitworth P, Stork-Sloots L, de Snoo FA, Richards P, Rotkis M, Beatty J,
Mislowsky A, Pellicane JV, Nguyen B, Lee L, et al. Chemosensitivity predicted
by BluePrint 80-gene functional subtype and MammaPrint in the
prospective Neoadjuvant breast registry symphony trial (NBRST). Ann Surg
Oncol. 2014;21(10):3261–7.
17. Khaleel SS, Andrews EH, Ung M, DiRenzo J, Cheng C. E2F4 regulatory
program predicts patient survival prognosis in breast cancer. Breast Cancer
Res. 2014;16(6):486.
18. Bertucci F, Finetti P, Birnbaum D. The E2F4 prognostic signature is also
predictive of the pathological response of breast cancer to chemotherapy.
Breast Cancer Res. 2015;17:54.
Mark et al. BMC Cancer (2017) 17:306
Page 11 of 11
19. Cancer Genome Atlas N. Comprehensive molecular portraits of human
breast tumours. Nature. 2012;490(7418):61–70.
20. Cheng C, Yan X, Sun F, Li LM. Inferring activity changes of transcription
factors by binding association with sorted expression profiles. BMC
bioinformatics. 2007;8:452.
21. Zhu M, Liu CC, Cheng C. REACTIN: regulatory activity inference of
transcription factors underlying human diseases with application to breast
cancer. BMC Genomics. 2013;14:504.
22. Haibe-Kains B, Desmedt C, Loi S, Culhane AC, Bontempi G, Quackenbush J,
Sotiriou C. A three-gene model to robustly identify breast cancer molecular
subtypes. J Natl Cancer Inst. 2012;104(4):311–25.
23. Wang Y, Klijn JG, Zhang Y, Sieuwerts AM, Look MP, Yang F, Talantov D,
Timmermans M, Meijer-van Gelder ME, Yu J, et al. Gene-expression profiles
to predict distant metastasis of lymph-node-negative primary breast cancer.
Lancet. 2005;365(9460):671–9.
24. James G, Witten D, Hastie T, Tibshirani R. An introduction to statistical
learning: with applications in R. In: Springer texts in statistics. edition 1. New
York: Springer-Verlag; 2013. p. 373-85.
25. Hatzis C, Pusztai L, Valero V, Booser DJ, Esserman L, Lluch A, Vidaurre T,
Holmes F, Souchon E, Wang H, et al. A genomic predictor of response and
survival following taxane-anthracycline chemotherapy for invasive breast
cancer. JAMA. 2011;305(18):1873–81.
26. Iwamoto T, Bianchini G, Booser D, Qi Y, Coutant C, Shiang CY, Santarpia L,
Matsuoka J, Hortobagyi GN, Symmans WF, et al. Gene pathways associated
with prognosis and chemotherapy sensitivity in molecular subtypes of
breast cancer. J Natl Cancer Inst. 2011;103(3):264–72.
27. Tabchy A, Valero V, Vidaurre T, Lluch A, Gomez H, Martin M, Qi Y, BarajasFigueroa LJ, Souchon E, Coutant C, et al. Evaluation of a 30-gene paclitaxel,
fluorouracil, doxorubicin, and cyclophosphamide chemotherapy response
predictor in a multicenter randomized trial in breast cancer. Clin Cancer Res.
2010;16(21):5351–61.
28. Horak CE, Pusztai L, Xing G, Trifan OC, Saura C, Tseng LM, Chan S, Welcher
R, Liu D. Biomarker analysis of neoadjuvant doxorubicin/cyclophosphamide
followed by ixabepilone or Paclitaxel in early-stage breast cancer. Clin
Cancer Res. 2013;19(6):1587–95.
29. Souza RF, Yin J, Smolinski KN, Zou TT, Wang S, Shi YQ, Rhyu MG, Cottrell J,
Abraham JM, Biden K, et al. Frequent mutation of the E2F-4 cell cycle gene
in primary human gastrointestinal tumors. Cancer Res. 1997;57(12):2350–3.
30. Schwemmle S, Pfeifer GP. Genomic structure and mutation screening of the
E2F4 gene in human tumors. Int J Cancer. 2000;86(5):672–7.
31. Lee BK, Bhinge AA, Iyer VR. Wide-ranging functions of E2F4 in
transcriptional activation and repression revealed by genome-wide analysis.
Nucleic Acids Res. 2011;39(9):3558–73.
32. Chabner BA, Roberts TG Jr. Timeline: chemotherapy and the war on cancer.
Nat Rev Cancer. 2005;5(1):65–72.
33. Gluck S, de Snoo F, Peeters J, Stork-Sloots L, Somlo G. Molecular subtyping
of early-stage breast cancer identifies a group of patients who do not
benefit from neoadjuvant chemotherapy. Breast Cancer Res Treat. 2013;
139(3):759–67.
34. Straver ME, Glas AM, Hannemann J, Wesseling J, van de Vijver MJ, Rutgers
EJ, Vrancken Peeters MJ, van Tinteren H, Van't Veer LJ, Rodenhuis S. The 70gene signature as a response predictor for neoadjuvant chemotherapy in
breast cancer. Breast Cancer Res Treat. 2010;119(3):551–8.
Submit your next manuscript to BioMed Central
and we will help you at every step:
• We accept pre-submission inquiries
• Our selector tool helps you to find the most relevant journal
• We provide round the clock customer support
• Convenient online submission
• Thorough peer review
• Inclusion in PubMed and all major indexing services
• Maximum visibility for your research
Submit your manuscript at
www.biomedcentral.com/submit