BÁO CÁO TRIỂN VỌNG TIẾP THỊ Marketing COVID19 2020 chief marketer covid 19 marketing outlook report
Bạn đang xem bản rút gọn của tài liệu. Xem và tải ngay bản đầy đủ của tài liệu tại đây (283.9 KB, 27 trang )
COVID-19
MARKETING
OUTLOOK
TABLE OF CONTENTS
INTRODUCTION........................................................................ 3
EXECUTIVE SUMMARY...................................................... 4-5
BUDGETS.............................................................................. 6-10
CHANNELS...........................................................................11-12
METRICS....................................................................................13
CONTENT................................................................................. 14
SOCIAL MEDIA................................................................... 15-18
CUSTOMER EXPERIENCE.................................................... 19
TACTICS................................................................................... 20
ABOUT THE RESPONDENTS.............................................. 21
METHODOLOGY............................................................... 21-26
COVID-19 MARKETING OUTLOOK | 2
INTRODUCTION
The COVID-19 pandemic has upended the marketing industry as we know it. In the face
of what feels like crisis after crisis in recent months, marketing professionals have been
tasked with adjusting to a new normal characterized by all-virtual interaction, economic
uncertainty and the hyper scrutiny of brand values. Navigating a public health crisis of
this magnitude has left the industry searching for ways to remain relevant and continue
business as usual.
But, of course, it’s anything but that. To better quantify the impact of the pandemic on
the industry, Chief Marketer set out to answer some of the questions marketers have
been asking most during this time of upheaval. As live events eliminated the prospect of
interacting with consumers and cultivating business leads, where have marketers turned
to engage with customers and prospects? How have marketing budgets been affected
as a result of consumer purchasing power being driven exclusively online and reduced?
What types of content and messaging are marketers relying on during the pandemic?
We surveyed Fortune 1000 marketers from a wide range of companies and verticals at
the start of the pandemic and again in the midst of the fallout. The following research
attempts to answer some of those questions while uncovering some actionable insights
pertaining to social media marketing, funding allocations and more.
We hope that these insights provide some of the data, analysis and perspective needed to
craft your future marketing plans for the remainder of 2020 and beyond. Thank you to our
readers, and especially to the survey respondents who took the time out of their hectic
schedules to share their thoughts.
Kaylee Hultgren
Group Content Manager
COVID-19 MARKETING OUTLOOK | 3
EXECUTIVE SUMMARY
EXECUTIVE SUMMARY
The marketing industry has experienced
unprecedented disruption since the onset of
the COVID-19 global pandemic. Most marketers
have been forced to pivot, improvise and
innovate while the business world adapts to new
consumer purchasing behaviors, social distancing
mandates, fluctuating economic circumstances
and sobering public health scenarios. To
thrive—or simply survive—within these new
circumstances has required a radical rethinking
of marketing budgets, customer experiences,
content creation, virtual engagement and much
more—in a very short period of time.
To pinpoint what aspects of marketing have
shifted as a result of COVID-19, Chief Marketer
surveyed our readership in two waves: first,
in February and early March, as the potential
effects of COVID-19 were just beginning to
appear; and again in late April and early May,
when the pandemic’s effects were in full swing.
The data revealed some intuitive and surprising
insights, from the decline of marketing budgets
to the rise of virtual events to the increased
reliance on social media for both engagement
and conversions. Here’s a snapshot of some of
the key findings:
BUDGET DECLINES
Survey data revealed that budgets were
dramatically affected by COVID-19. In fact, the
number of marketers who said their budgets
were increasing in 2020 dropped by 30 percent,
from 37 percent in February to seven percent in
April and May. Moreover, compared to the first
wave, many more marketers surveyed in April
and May said their budgets were decreasing—
from 14 percent pre-COVID-19 to 55 percent
just two months later. “We have cut all nonessential spending to include our marketing
dollars,” according to one respondent. “We
haven’t bought any media or planned at all for
our upcoming season of events,” said another.
“It’s all email, social posts and web-based. We’re
not allowed to spend any money the rest of our
fiscal year, until June 30,” according to a third.
VIRTUAL EVENTS
Prior to COVID-19, the marketing categories
requiring the most spend were content
marketing, events and paid advertising,
according to the surveys. Post-COVID-19,
content marketing and paid advertising
continued to require the most spend, but
event spending dropped significantly among
marketers from 41 percent to 22 percent
of marketers ranking events in their top
three spending categories. However, when
respondents were asked where they were
reallocating live event spend, nearly half of B2C
marketers (44 percent) and more than half
of B2B marketers (64 percent) said they were
allocating live event spend to virtual events.
This points to a major trend within the postCOVID-19 era: virtual engagement. “We
have shifted from a heavy emphasis on live
experiential events (consumers, press, etc.)
to digital. Naturally, event budgets have also
slightly decreased due to the uncertainty
and the current shelter-in-place restrictions,”
said one respondent. “Dollars are shifting to
accommodate new initiatives brought on
by COVID-19. For instance, investing in more
platform tools to support virtual events,” said
another. For many, the absence of live events has
required a complete retooling and an adoption
of virtual engagement. “We had to completely
overhaul our business model from live shows
and in-person storytelling workshops to an allvirtual model,” according to one marketer.
FUNDING ALLOCATIONS AND
UNCERTAINTY
When examining which budget categories
would receive more funding in 2020 compared
to the year prior, there was consistency between
the two waves. Content marketing, paid
advertising and SEO were the top three choices
for both time periods. However, Martech
spending declined from 17 percent of marketers
COVID-19 MARKETING OUTLOOK | 4
EXECUTIVE SUMMARY
placing it in their top three to just eight
percent post-COVID-19. Moreover, 25 percent
of marketers surveyed in the second wave said
they were not certain which line items would
receive more spend in 2020.
It is significant that a quarter of marketers
surveyed post-COVID-19 were unsure of
where and how to spend their budgets. One
respondent described the challenging situation
as “paralysis,” adding that “decisions are on hold
and there’s an absence of top-down direction
given business uncertainty. Further, there’s a
reticence to invest in brand-building activities.
Finally, there’s a rush to figure out how best to
deploy digital solutions to engage customers,”
the person said. “Frozen, if I can use a movie
name to describe the current plan,” was
another’s cheeky response.
SOURCES OF ROI
Despite budget shifts, new strategies and
business models, when it came to return-oninvestment, content marketing remained one of
the most effective aspects of marketers’ budgets.
The ROI for events decreased from 33 percent
pre-COVID-19 to 21 percent post-COVID-19,
as one might expect. But one category’s ROI
increased significantly: Influencer marketing
jumped from nine percent of marketers placing
it in their top three during the first wave to 22
percent in the second.
Indeed, while content studios were closed and
production halted in the midst of the pandemic,
some brands have relied on influencers to
deliver content to consumers via digital
platforms. “Social media engagement has
spiked, influencer partnerships have developed
and our overall marketing plan has completely
shifted from in-person to digital opportunities,”
said one respondent.
METRICS THAT MATTER
When it comes to metrics that matter most
for marketers, survey data indicated that
the customer experience metric increased
considerably post-COVID-19, from 29 percent of
marketers in the first wave to 48 percent. Out
of necessity, online purchasing has dramatically
increased during the pandemic, a fact that
could point to the increased importance of
the customer experience. In the absence
of in-person interaction, brands’ marketing
abilities have been largely limited to onlineonly channels. Following that logic, the metrics
for time spent on brands’ websites, shares,
comments and content shared also increased
post-COVID-19.
SOCIAL MEDIA USE
Social media marketing has risen in importance
during the pandemic. LinkedIn, Facebook
and Instagram were the most effective social
media channels for marketers both before and
after COVID-19, with Twitter and Instagram
experiencing the largest increases. But while
both surveys indicated that marketing handles
the majority of social media management,
there was an uptick in the number of marketers
who are using a dedicated social media team in
the post-COVID-19 era. This points to a growing
need for more digital and social media skills in
marketing organizations moving forward.
For several respondents, social media
marketing initiatives and providing updates
to services were the primary means of
communication during the post-COVID-19
wave. And when looking at what marketing
tactics will be relied on more on in 2020 and
beyond, 65 percent of marketers placed social
media in their top three—the highest ranked
tactic in the post-COVID-19 wave. In terms of
challenges, creating content that resonates
during the pandemic was one of the greatest
obstacles, with 45 percent of marketers ranking
it in their top three, suggesting that pandemic
messaging and marketing remains a challenge
in our current environment.
COVID-19 MARKETING OUTLOOK | 5
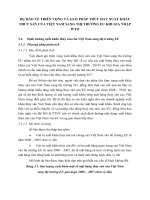
FOR 2020, YOUR MARKETING BUDGET IS:
PRE-COVID-19
POST-COVID-19
DON’T KNOW
INCREASING
DON’T KNOW
12%
INCREASING
12%
7%
37%
FLAT
38%
FLAT
23%
55%
14%
DECREASING
DECREASING
TAKEAWAYS:
*After COVID-19, there was a 30 percent drop in the number of marketers who said their budgets were
increasing in 2020, a decline from 37 percent to seven percent. The number of marketers decreasing
budgets spiked 41 percentage points in, from 14 percent pre-COVID-19 to 55 percent.
*For B2B marketers specifically, the decrease was even more pronounced, with 64 percent saying that
budgets were decreasing.
*For B2C marketers after COVID-19, 21 percent did not know whether their budgets were increasing or
decreasing, up from three percent prior to COVID-19.
COVID-19 MARKETING OUTLOOK | 6
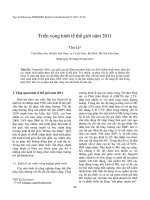
WHAT ASPECTS OF YOUR MARKETING BUDGET
REQUIRE THE MOST SPEND? (SELECT THE TOP 3)
PRE-COVID-19
POST-COVID-19
41%
EVENTS
22%
EVENTS
44%
PAID ADVERTISING
30%
PAID ADVERTISING
25%
SEO
15%
SEO
15%
INFLUENCER MARKETING
49%
CONTENT MARKETING
19%
MARTECH
16%
37%
10%
INFLUENCER MARKETING
CONTENT MARKETING
MARTECH
31%
CREATIVE
23%
CREATIVE
15%
R&D
19%
R&D
3%
DON’T KNOW
5%
OTHER
21%
4%
DON’T KNOW
OTHER
TAKEAWAYS:
*Before COVID-19, 37 percent of marketers said their marketing budgets were increasing for 2020 and
just 14 percent said they were decreasing. Post COVID-19, only seven percent said their budgets were
increasing and 55 percent said they were declining.
*For B2B marketers specifically, the decrease was even more pronounced, with 64 percent saying that
budgets were decreasing.
*The decline of event spend for B2C-only marketers was even more pronounced, with a 30 percent drop
in B2C spending on events post-COVID-19.
COVID-19 MARKETING OUTLOOK | 7
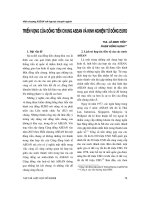
WHAT ASPECTS OF YOUR MARKETING BUDGET
WILL RECEIVE MORE FUNDING IN 2020 THAN IT
DID IN 2019? (SELECT THE TOP 3)
PRE-COVID-19
POST-COVID-19
26%
EVENTS
12%
31%
PAID ADVERTISING
25%
28%
SEO
21%
18%
48%
INFLUENCER MARKETING
CONTENT MARKETING
16%
17%
CREATIVE
19%
OTHER
INFLUENCER MARKETING
MARTECH
8%
6%
SEO
CONTENT MARKETING
MARTECH
DON’T KNOW
PAID ADVERTISING
39%
17%
13%
EVENTS
CREATIVE
25%
DON’T KNOW
13%
OTHER
TAKEAWAYS:
*Looking at what budget categories were going to increase in 2020 compared to 2019, content
marketing, paid advertising and SEO were marketers’ top three prior to COVID-19.
*The second wave also prioritized those line items, but martech declined from 17 percent to 8 percent
and 25 percent of marketers said they weren’t sure what line items would receive more spend in 2020.
The latter suggests that COVID-19 has left a quarter of marketers unsure of where and how to spend their
budgets.
*For B2C-only marketers, spend toward events in 2020 declined from 29 percent to just five percent,
influencer marketing declined f rom 32 percent to 16 percent and martech spend decreased from 22
percent to nine percent.
*Marketing spend put toward events in 2020 for B2B-only marketers declined more moderately, from 19
percent to 13 percent.
COVID-19 MARKETING OUTLOOK | 8
WHICH ASPECTS OF YOUR MARKETING BUDGET
DELIVER THE MOST ROI? (SELECT THE TOP 3)
PRE-COVID-19
POST-COVID-19
33%
EVENTS
21%
EVENTS
40%
PAID ADVERTISING
32%
PAID ADVERTISING
29%
SEO
23%
SEO
9%
INFLUENCER MARKETING
22%
41%
CONTENT MARKETING
47%
11%
MARTECH
16%
7%
14%
7%
CREATIVE
6%
DON’T KNOW
OTHER
CONTENT MARKETING
MARTECH
16%
12%
R&D
INFLUENCER MARKETING
CREATIVE
R&D
17%
8%
DON’T KNOW
OTHER
TAKEAWAYS:
*Content marketing remained one of the tactics of marketers’ budgets that deliver the most ROI both
pre- and post-COVID-19.
*The ROI for events decreased f rom 33 percent to 21 percent.
*Influencer marketing’s ROI increased after COVID-19, from 9 percent to 22 percent of marketers ranking
it in their top three.
COVID-19 MARKETING OUTLOOK | 9
TO WHICH ASPECTS OF YOUR MARKETING
BUDGET ARE YOU REALLOCATING FUNDS
PREVIOUSLY DIRECTED TOWARDS LIVE EVENTS?
(SELECT THE TOP 3)
POST-COVID-19
56%
VIRTUAL EVENTS
39%
DIGITAL ADVERTISING
3%
13%
TV ADVERTISING
SEO
16%
42%
4%
INFLUENCER MARKETING
CONTENT MARKETING
MARTECH
25%
CREATIVE
21%
R&D
13%
10%
DON’T KNOW
OTHER
TAKEAWAYS:
*Nearly half of B2C-only marketers (44 percent) and more than half of B2B-only marketers (64 percent)
are allocating live event spend to virtual events, pointing to a major trend for the post-COVID-19 era.
*Content marketing is receiving live event spend among 46 percent of B2B marketers but only 25 percent
of B2C marketers.
*For B2B marketers, creative, R&D and martech are receiving more of the money pie, while B2C
marketers are prioritizing influencer marketing more than B2B, with 19 percent compared to 8 percent.
COVID-19 MARKETING OUTLOOK | 10
WHICH CHANNELS DO YOU ANTICIPATE WILL
PRODUCE YOUR LARGEST SOURCES OF B2C
CONVERSIONS? (SELECT THE TOP 3)
PRE-COVID-19
POST-COVID-19
35%
SEARCH (OPTIMIZATION & MARKETING)
30%
23%
LIVE EVENTS
14%
23%
4%
28%
49%
MOBILE APP
13%
39%
27%
RETARGETING
37%
CONTENT MARKETING
RETARGETING
21%
11%
5%
CONTENT MARKETING
PAY PER CLICK/DISPLAY ADS
INFLUENCER MARKETING
TELEMARKETING
20%
33%
14%
SOCIAL
MOBILE APP
4%
14%
LIVE EVENTS
SOCIAL
15%
7%
SEARCH (OPTIMIZATION & MARKETING)
IN-PERSON SALES
REFERRALS/WORD OF MOUTH
OTHER
18%
PAY PER CLICK/DISPLAY ADS
20%
INFLUENCER MARKETING
6%
TELEMARKETING
10%
28%
7%
IN-PERSON SALES
REFERRALS/WORD OF MOUTH
OTHER
TAKEAWAYS:
*Post-COVID-19, B2C conversions are occurring most through social, email and content marketing
channels. Pre-COVID-19, conversions resulted most frequently from search, referrals/word of mouth and
email.
*Social, influencer marketing, mobile app and email channels were the sources that saw the greatest
increase in conversions after COVID-19 when compared to pre-COVID-19.
COVID-19 MARKETING OUTLOOK | 11
WHICH CHANNELS PRODUCE YOUR LARGEST
SOURCES OF B2C ENGAGEMENT? (SELECT THE TOP 3)
PRE-COVID-19
25%
SEARCH (OPTIMIZATION & MARKETING)
POST-COVID-19
24%
28%
LIVE EVENTS
13%
41%
SOCIAL
54%
7%
MOBILE APP
14%
29%
40%
11%
RETARGETING
17%
33%
CONTENT MARKETING
44%
5%
PAY PER CLICK/DISPLAY ADS
12%
14%
INFLUENCER MARKETING
21%
TELEMARKETING
IN-PERSON SALES
12%
22%
REFERRALS/WORD OF MOUTH
16%
OTHER
SOCIAL
MOBILE APP
RETARGETING
CONTENT MARKETING
PAY PER CLICK/DISPLAY ADS
INFLUENCER MARKETING
4%
29%
6%
LIVE EVENTS
3%
11%
5%
SEARCH (OPTIMIZATION & MARKETING)
7%
TELEMARKETING
IN-PERSON SALES
REFERRALS/WORD OF MOUTH
OTHER
TAKEAWAYS:
*As expected, live events decreased as a B2C engagement channel, from 28 percent to 13 percent.
Referrals also decreased considerably, f rom 29 percent to 12 percent, perhaps suggesting that the lack of
live events is deprioritizing referrals as an engagement tool.
*Social, content marketing and email were the top channels for conversions post COVID-19.
COVID-19 MARKETING OUTLOOK | 12
WHAT METRICS MATTER TO YOU MOST WHEN
TRACKING THE SUCCESS OF YOUR MARKETING
PROGRAMS? (SELECT THE TOP 3)
PRE-COVID-19
POST-COVID-19
41%
LEAD GEN
49%
LEAD GEN
62%
SALES
66%
SALES
29%
CUSTOMER EXPERIENCE
48%
CUSTOMER EXPERIENCE
45%
CONVERSION RATE
43%
CONVERSION RATE
13%
NET PROMOTER SCORE
11%
NET PROMOTER SCORE
TIME SPENT ON SITE
18%
TIME SPENT ON SITE
5%
8%
51%
5%
SHARES OR COMMENTS/CONTENT SHARED
ROI
OTHER
26%
42%
2%
SHARES OR COMMENTS/CONTENT SHARED
ROI
OTHER
TAKEAWAY:
*After COVID-19, the customer experience metric increased considerably, from 29 percent of marketers
pre-COVID-19 to 48 percent. Given that ecommerce has skyrocketed during the pandemic, it’s possible
that customer experience through digital platforms has increased in importance as in-person interaction
decreased. Metrics for time spent on site and shares or comments/content shared also increased in
importance.
COVID-19 MARKETING OUTLOOK | 13
WHAT TYPES OF CONTENT ARE MOST EFFECTIVE
FOR MOVING PROSPECTS THROUGH THE
CONVERSION FUNNEL? (SELECT THE TOP 3)
PRE-COVID-19
51%
34%
VIDEO
SOCIAL MEDIA POSTINGS
19%
16%
32%
29%
48%
9%
13%
3%
23%
9%
IMAGES
INFLUENCER MARKETING
ARTICLES/BLOG POSTS
CONTENT CREATED WITH PARTNERS
REVIEWS/CUSTOMER TESTIMONIALS
NEWSLETTERS
RESEARCH REPORTS
POST-COVID-19
49%
VIDEO
54%
SOCIAL MEDIA POSTINGS
17%
IMAGES
21%
INFLUENCER MARKETING
31%
ARTICLES/BLOG POSTS
30%
CONTENT CREATED WITH PARTNERS
33%
REVIEWS/CUSTOMER TESTIMONIALS
16%
NEWSLETTERS
14%
RESEARCH REPORTS
PODCASTS
11%
PODCASTS
EVENTS
34%
EVENTS
OTHER
4%
OTHER
TAKEAWAYS:
*The importance of social media postings to moving prospects through the conversion funnel increased
significantly during COVID-19, f rom 34 percent to 54 percent.
*Newsletters and podcasts also rose in importance.
*Before COVID-19, 23 percent of marketers said event content was an effective type of content, and
34 percent said live and virtual events were effective post-COVID-19. However, 21 percent of B2C-only
marketers ranked live and virtual events in their top three conversion funnel drivers, post-COVID-19. In
contrast, 40 percent of B2B-only marketers ranked it highly.
COVID-19 MARKETING OUTLOOK | 14
WHAT ARE THE MOST EFFECTIVE SOCIAL MEDIA
CHANNELS FOR YOUR BRAND? (SELECT THE TOP 3)
PRE-COVID-19
POST-COVID-19
50%
53%
62%
68%
29%
19%
41%
57%
30%
YOUTUBE
27%
10%
3%
2%
4%
SNAPCHAT
TIKTOK
OTHER
YOUTUBE
5%
2%
1%
3%
SNAPCHAT
TIKTOK
OTHER
TAKEAWAYS:
*LinkedIn, Facebook and Instagram were ranked the most effective social media channels for marketers
pre- and post-COVID-19, with Twitter and Instagram experiencing the largest increases in effectiveness.
*Almost all of the marketers surveyed ranked Snapchat and TikTok the least effective social media
channels, both pre- and post-COVID-19.
*For B2C-only marketers, Facebook and Instagram were overwhelmingly the top platforms for both
surveys.
For B2B-only marketers, LinkedIn was by far the top platform among 78 percent of those surveyed
pre-COVID-19 and 81 percent post-COVID-19. Moreover, Facebook’s importance increased among
B2B marketers from 26 percent to 37 percent; Twitter from 15 percent to 25 percent; and YouTube
from 15 percent to 31 percent. Marketers are clearly relying more heavily on social media platforms to
communicate to target audiences.
COVID-19 MARKETING OUTLOOK | 15
WHAT TYPE OF CONTENT RESONATES THE MOST
ON SOCIAL MEDIA FOR YOUR AUDIENCE?
(SELECT THE TOP 3)
PRE-COVID-19
67%
38%
68%
VIDEO
LINKS TO WEBSITE CONTENT
11%
LINKS TO THIRD PARTY CONTENT
22%
LINKS TO BLOG POSTS
10%
POST-COVID-19
SURVEYS
34%
LINKS TO WEBSITE CONTENT
8%
LINKS TO THIRD PARTY CONTENT
19%
LINKS TO BLOG POSTS
10%
SURVEYS
30%
SEASONAL/TOPICAL POSTS
37%
45%
IMAGES
50%
6%
OTHER
VIDEO
6%
SEASONAL/TOPICAL POSTS
IMAGES
OTHER
TAKEAWAY:
The social media content that marketers said resonate the most includes video, images, links to website
content and seasonal/topic posts. This data remained steady both pre- and post-COVID-19.
COVID-19 MARKETING OUTLOOK | 16
WHO MANAGES SOCIAL MEDIA FOR YOUR
BRAND? (SELECT THE TOP 3)
PRE-COVID-19
70%
MARKETING
10%
8%
SALES
PR
26%
18%
7%
DEDICATED SOCIAL TEAM
OUTSIDE AGENCY
FREELANCERS
6%
OTHER
POST-COVID-19
62%
MARKETING
10%
SALES
9%
PR
32%
DEDICATED SOCIAL TEAM
17%
7%
OUTSIDE AGENCY
FREELANCERS
7%
OTHER
TAKEAWAY:
*Both surveys showed that marketing handles the majority of social media management, with an uptick
in dedicated social media teams post-COVID-19. This points to a growing need for more digital and social
media skills in marketing organizations moving forward.
COVID-19 MARKETING OUTLOOK | 17
WHAT ARE YOUR BIGGEST CHALLENGES
WHEN IT COMES TO SOCIAL MEDIA MARKETING?
(SELECT THE TOP 3)
PRE-COVID-19
64%
52%
45%
33%
28%
MEASURING SOCIAL ROI
GETTING CUSTOMERS AND PROSPECTS TO ENGAGE
HAVING ENOUGH CONTENT
BANDWIDTH TO RESPOND TO SOCIAL AND POST FREQUENTLY
INADEQUATE SOCIAL BUDGET
POST-COVID-19
64%
52%
MEASURING SOCIAL ROI
GETTING CUSTOMERS AND PROSPECTS TO ENGAGE
35%
HAVING ENOUGH CONTENT
27%
BANDWIDTH TO RESPOND TO SOCIAL AND POST FREQUENTLY
45%
INADEQUATE SOCIAL BUDGET
TAKEAWAY:
*Post-COVID-19, creating content that resonates during the pandemic was one of the top challenges to
social media marketing, with 45 percent of marketers ranking it in their top three. This suggests that
pandemic messaging and marketing remains a challenge in our current environment.
COVID-19 MARKETING OUTLOOK | 18
WHAT ARE THE BIGGEST CHALLENGES TO
CREATING A POSITIVE CUSTOMER EXPERIENCE?
(SELECT THE TOP 3)
PRE-COVID-19
POST-COVID-19
41%
TECHNOLOGY
32%
TECHNOLOGY
45%
BUDGET
50%
BUDGET
30%
ORGANIZATIONAL SUPPORT/SILOS
31%
38%
BANDWIDTH/RESOURCES
39%
38%
PERSONALIZATION
37%
28%
CONSUMER ENGAGEMENT
42%
6%
NOT A PRIORITY
ORGANIZATIONAL SUPPORT/SILOS
BANDWIDTH/RESOURCES
PERSONALIZATION
CONSUMER ENGAGEMENT
6%
NOT A PRIORITY
TAKEAWAYS:
*Technology, budget and personalization were the top challenges to creating a positive customer
experience pre-COVID-19.
*Post-COVID-19, budget overtook technology to become the top challenge, with 50 percent of marketers
ranking it highly. Customer engagement also increased as a challenge post-COVID-19.
COVID-19 MARKETING OUTLOOK | 19
WHAT MARKETING TACTICS WILL MARKETERS
RELY MORE ON IN 2020 AND BEYOND?
(SELECT THE TOP 3)
PRE-COVID-19
POST-COVID-19
63%
VIDEO MARKETING
61%
VIDEO MARKETING
50%
SOCIAL MEDIA MARKETING
65%
SOCIAL MEDIA MARKETING
31%
INFLUENCER MARKETING
29%
34%
LOYALTY MARKETING
16%
24%
ARTICLES/BLOG POSTS
CONTENT CREATED WITH PARTNERS
26%
6%
12%
REVIEWS/CUSTOMER TESTIMONIALS
INFLUENCER MARKETING
28%
LOYALTY MARKETING
15%
ARTICLES/BLOG POSTS
32%
24%
NEWSLETTERS
12%
RESEARCH REPORTS
15%
CONTENT CREATED WITH PARTNERS
REVIEWS/CUSTOMER TESTIMONIALS
NEWSLETTERS
RESEARCH REPORTS
15%
PODCASTS
18%
PODCASTS
19%
EVENTS
18%
EVENTS
TAKEAWAYS:
*In terms of marketing tactics, video marketing remains one of the most important for 2020 and beyond.
*When comparing the two surveys, social media marketing’s importance has increased after COVID-19,
from 50 percent to 65 percent.
COVID-19 MARKETING OUTLOOK | 20
ABOUT
ABOUT THE RESPONDENTS
Chief Marketer’s COVID-19 Marketing Report surveyed readers in 2020 via email in two
waves: 147 respondents in February and early March, and 494 respondents in late April
and early May. Both surveys included respondents from B2C and B2B markets. Details
on the the first wave of respondents include the following: 23 percent were B2C-only, 26
percent were B2B-only and 51 percent were both B2C and B2B. Thirty-seven percent were
at the chairman/president/c-suite level, 15 percent were at the svp or vp level, 31 percent
were at the director level and 16 percent were managers. Seventy-five percent work for
companies that have under 500 employees, 7 percent have 501 to 1,000, 4 percent have
1,001 to 2,500, 2 percent have 2,501 to 5,000 and 12 percent have more than 5,001.
Details on the second wave of respondents include the following: 26 percent were B2Conly, 25 percent were B2B-only and 49 percent were B2C and B2B. Twenty-seven percent
were at the chairman/president/c-suite level, 13 percent were at the svp or vp level, and
52 percent were directors or managers. Seventy-two percent of respondents work at
companies with under 500 employees; 9 percent have 501 to 1000 employees, 5 percent
have 1,001 to 2,500, 4 percent have 2,501 to 5,000, and 13 percent have more than 5,001.
Respondents from both waves work in a variety of vertical markets, including professional
services, building/construction agencies, IT, manufacturing, media, financial services,
education, healthcare, hospitality, food services, transportation, aviation and automotive.
See the following pages for more detail about the respondents.
COVID-19 MARKETING OUTLOOK | 21
METHODOLOGY:
MARKETING
FOCUS
RESPONDENT DATA
PRE-COVID-19
POST-COVID-19
B2C
B2C
26%
23%
B2C
AND
B2B
B2C
AND
B2B
51%
26%
B2B
49%
25%
B2B
COVID-19 MARKETING OUTLOOK | 22
METHODOLOGY:
INDUSTRY
RESPONDENT DATA
PRE-COVID-19
POST-COVID-19
3% 3%
1%
13%
4% 2%
15%
9%
5%
3%
10%
3%
2%
9%
5%
6%
15%
5%
2%
3%
9%
4%
23%
5%
1%
6%
3% 3%
■ 3% AUTOMOTIVE AND TRUCKING
■ 3% BUILDING AND CONSTRUCTION
■ 1% CONSUMER ELECTRONICS AND MOBILE
TECHNOLOGY/TELECOMMUNICATIONS
■ 9% CONSUMER PRODUCTS
■ 3% EDUCATION
■ 3% ENTERTAINMENT AND MEDIA
■ 9% FINANCIAL SERVICES
■ 1% FOOD AND BEVERAGE
■ 6% INFORMATION TECHNOLOGY
■ 6% MANUFACTURING AND INDUSTRIAL
■ 5% MEDICAL, HEALTHCARE AND
PHARMACEUTICAL
■ 3% RESTAURANTS AND HOSPITALITY
■ 3% NATURAL RESOURCES/ENERGY
■ 15% PROFESSIONAL SERVICES
■ 5% RETAIL
■ 2% TRANSPORTATION
■ 10% AGENCY/VENDOR SERVICES
■ 13% OTHER
4%
2%
1%
2%
8%
4%
1%
3%
3%
■ 4% AUTOMOTIVE AND TRUCKING
■ 2% BUILDING AND CONSTRUCTION
■ 2% CONSUMER ELECTRONICS AND MOBILE
TECHNOLOGY/TELECOMMUNICATIONS
■ 3% CONSUMER PRODUCTS
■ 5% EDUCATION
■ 9% ENTERTAINMENT AND MEDIA
■ 4% FINANCIAL SERVICES
■ 5% FOOD AND BEVERAGE
■ 4% INFORMATION TECHNOLOGY
■ 3% MANUFACTURING AND INDUSTRIAL
■ 3% MEDICAL, HEALTHCARE AND
PHARMACEUTICAL
■ 4% RESTAURANTS AND HOSPITALITY
■ 1% NATURAL RESOURCES/ENERGY
■ 8% PROFESSIONAL SERVICES
■ 2% RETAIL
■ 1% SPORTS AND RECREATION
■ 2% TRANSPORTATION
■ 23% AGENCY/VENDOR SERVICES
■ 15% OTHER
COVID-19 MARKETING OUTLOOK | 23
METHODOLOGY:
NUMBER OF
EMPLOYEES
RESPONDENT DATA
PRE-COVID-19
2%
4%
POST-COVID-19
1%
5%
12%
7%
13%
9%
75%
■ 75%
■ 7%
■ 4%
■ 2%
■ 12%
UNDER 500
501 TO 1,000
1,001 TO 2,500
2,501 TO 5,000
MORE THAN 5,001
72%
■ 72%
■ 9%
■ 5%
■ 1%
■ 13%
UNDER 500
501 TO 1,000
1,001 TO 2,500
2,501 TO 5,000
MORE THAN 5,001
COVID-19 MARKETING OUTLOOK | 24
METHODOLOGY:
JOB LEVEL
RESPONDENT DATA
PRE-COVID-19
POST-COVID-19
1%
9%
16%
37%
27%
25%
31%
15%
■ 37% CHAIRMAN/CEO/
PRESIDENT/
C-LEVEL EXECUTIVE
■ 15% SVP OR VP
■ 31% DIRECTOR
■ 16% MANAGER
■ 1% OTHER
27%
13%
■ 27% CHAIRMAN/CEO/
PRESIDENT/
C-LEVEL EXECUTIVE
■ 13% SVP OR VP
■ 27% DIRECTOR
■ 25% MANAGER
■ 9% OTHER
COVID-19 MARKETING OUTLOOK | 25