Nâng cao chất lượng trang sức bề mặt sản phẩm gỗ bằng sơn polyurethane (PU) phân tán nano tio2 tt tieng anh
Bạn đang xem bản rút gọn của tài liệu. Xem và tải ngay bản đầy đủ của tài liệu tại đây (590.34 KB, 12 trang )
MINISTRY OF AGRICULTURE AND
MINISTRY OF EDUCATION AND
RURAL DEVELOPMENT
TRAINING
VIETNAM NATIONAL UNIVERSITY OF FORESTRY
PHAM THI ANH HONG
IMPROVING THE FINISHING QUALITY OF WOOD PRODUCTS
USING POLYURETHANE (PU) COATING DISPERSED BY TIO2 NANO
MAJORITY: FORESTRY PROCESSING TECHNOLOGY
CODE: 9549001
SUMMARY OF ENGINEERING DOCTORAL THESIS
HA NOI, 2020
Research work is completed at: Vietnam National University of Forestry
Scientific instructors:
Scientific instructor 1: Associate Professor, Dr. Cao Quoc An
Scientific instructor 2: Professor, Dr. Tran Van Chu
r
Reviewer 1:……………………………………………
Reviewer 2:……………………………………………
Reviewer 3:…………………………………………….
The defense will be taken in front of the Institutional Board of
Thesis Evaluation at: Vietnam National University of Forestry
At: … time, Date ….Month…..Year 2020
The thesis can be found in the libraries:
National Library; Vietnam National University of Forestry Library
2
ABSTRACT
Official thesis title: ”Improving the finishing quality of wood products using
Polyurethane (PU) coating dispersed by TiO2 nano”
I. INTRODUCTION
Wood is anisotropic material easy to change color, size under the influence of the
environment so the wood products in our country today are finished by some kind of coatings
to increase the aesthetics and protect the surface of the products against moisture, light, and
microorganisms that destroy wood, etc. The finishing stage can be done before or after
assembling the product. This is an important stage in the production of wood furniture.
Polyurethane (PU) coating is the most commonly used to finish wood products
because they have many advantages: coating film dries fast, smooth flat, adhesion is good,
hardness and gloss are high and the price is reasonable. However, this coating has big
disadvantages is that its resistance to natural light is poor, so the coating film will be
discolored. To overcone the above drawback, some scientists have studied to improve the
quality of PU coating film by nanomaterials such as SiO 2, ZnO, TiO2, etc. Most of the
results showed that PU coating after combining with nanomaterials are both antibacterial
and self-cleaning, resistant to ultraviolet (UV), scratch, abrasion, hardness is increased,
moisture resistance is also improved.
Titanium dioxide (TiO2) is a semiconductor material, wide prohibit region, wide
prohibit region, white. This is a non-toxic material, environmental friendliness, has high
chemical stability, antibacterial, kills mold and self-cleaning surface and resists to UV rays,
moisture resistant, improves adhesion strength, impact the durability, cleans the air, cleans the
water and low cost. Stemming from the above reasons, I conduct to study the thesis:
“Improving the finishing quality of wood products using Polyurethane (PU) coating
dispersed by TiO2 nano”.
II. OBJECTIVES, RESEARCH CONTENTS, AND METHODOLOGY
2.1. Research objectives
2.1.1. Overall objectives
Building a scientific basis and the practice of some technological factors to
improve the quality of wood products finishing by PU coating combined with TiO 2
nanomaterials, from there, contributing to improving the use-value and expanding the
consumption market for wood products.
2.1.2. Specific objectives
- Determining the effects of concentration and time disperses TiO 2 nanomaterials
to some quality targets of coating film;
- Determining the effects of pressure and speed moves of the spray gun to some
quality targets of coating film;
- Proposing reasonable technology parameters to improve the quality of wood
products surface finished by PU coating.
2.2. Research content
- Synthesize information about PU coating, TiO 2 nanomaterials, method disperses
nano into coating and wood products finishing technology
- Studying the effect of concentration and time disperse TiO 2 nanoparticles to some
quality targets of coating film;
- Studying the effect of pressure and speed moves of the spray gun to some quality
criteria of coating film;
- Analyzing, evaluating the results, and proposing suitable technology parameters to
improve the quality of wood products finishing by PU coating combined with TiO 2 nano.
3
2.3. Main research method
The multi-factor experimental method:
Number of experiments: N = 2n + 2n + 1 = 22 + 2 x 2 + 1 = 9
(1)
Table 1.1. Experimental domain affects the concentration and time
disperse TiO2 nanoparticles to some quality targets of the coating film
Variable level
Variable
Impact factor
-1
0
+1
+
range
Concentration of TiO2 nano (C, %)
0.05
0.1
0.15 0.2 0.25
0.05
Time disperse (τ, hours)
1
2
3
4
5
1
Table 1.2. Experimental matrix on the effect of concentration and time
disperse TiO2 nanoparticles to some quality targets of the coating film
Code form
Real form
Output parameters
No
X1
X2
C (%)
(hrs)
Y1
Y2
Y3
Y4
1
-1
-1
0.1
2
2
+1
-1
0.2
2
3
-1
+1
0.1
4
4
+1
+1
0.2
4
5
0
0.05
3
6
0
0.25
3
+
7
0
0.15
1
8
0
+
0.15
5
9
0
0
0.15
3
After finding the optimal parameters about concentration and dispersion time of
TiO2 nanoparticles in PU paint, the thesis conducted experiments with multi factors about
the influence of pressure and speed moves of the spray gun to some quality targets of the
coating film. The number of experiments is also calculated by the formula (1): N = 9.
Table 1.3. Modes spray PU paint after mixing with TiO 2 nano
Variable level
Variable
Impact factor
-1
0
+1
+
range
Spraying pressure (P, MPa)
0.1
0.14
0.18 0.22 0.26
0.04
Speed moves of spray gun (V,
60
65
70
75
80
5
m/min)
Table 1.4. Experimental matrix on the influence of the pressure and speed moves of
the spray gun to some quality targets of the coating film
Code form
Real form
Output parameters
No
X1
X2
P (MPa) V (m/min)
Y1
Y2
Y3
Y4
1
-1
-1
0.14
65
2
+1
-1
0.22
65
3
-1
+1
0.14
75
4
+1
+1
0.22
75
5
0
0.1
70
6
+
0
0.26
70
7
0
0.18
60
8
0
+
0.18
80
9
0
0
0.18
70
4
III. RESULTS AND DISCUSSION
3.1. Effect of concentration and time disperse TiO2 nanoparticles to the quality of
the coating film
3.1.1. Check the stability of nano TiO 2 in the solvents
. Check the stability of nano TiO 2 in the solvents
TiO2 nano is
dispersed in
the solvent
contain Las
TiO2 nano is
dispersed in
the solvent
without Las
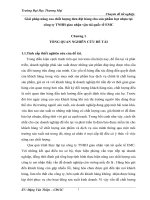
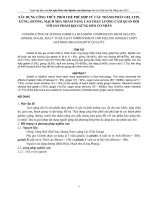
Figure 3.1. The turbidity of TiO2 nanomaterials with concentration
at 0.15% is dispersed in the Butyl acetate solvent
The turbidity of TiO 2 nanoparticles disperse in Butyl acetate solvent without
Las surfactants reduced quickly over time compared with TiO 2 nanoparticles disperse
in Butyl acetate solvent containing Las surfactants.
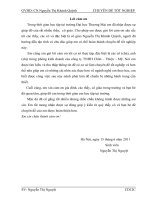
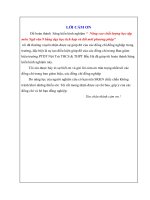
3.1.2. Determine the existence of TiO2 nanoparticles in PU coating film on wood surface
Na no
TiO2
Figure 3.2. SEM image of PU control
coating (x 4000)
Figure 3.3. SEM image of PU-TiO2 coating film with
concentration 1.05% disperse in 3 hours (x 500)
The SEM images showed that the surface status of the PU control film and the
PU-TiO2 film on the wood surface did not show cracking or flaking.
3.1.3. Effect to the hardness of the coating film
The correlation equation between the concentration and time disperse TiO 2
nanoparticles with the hardness of the coating film:
Equation in code form: Y = 2.575 + 5.011X1 – 0.083X12 + 0.075X2 –
0.250X2X1+ 0.003X22 (3.1a)
Equations in real form: Y = -23.417 + 167.899C – 33.320C2 + 0.733 - 1.000C +
0.0001 2 (3.1b)
Results analyze the variance (Anova) of hardness of coating films at the
concentration and time disperse TiO 2 nanoparticles:
Error sources
Factor
Error
Total
Squared Sum
(SS)
260.851
292.593
553. 445
Degree of
Square
freedom
(df)
medium
(MS)
value
(F)
Fk-1; n-k;1-α
(Fcrit)
9
140
149
28.983
2.089
13.868
1.947
5
Statistical
The results showed that F> Fcrit, this proves that the hardness of the coating film
between the concentration and time disperse TiO 2 nanoparticles was different.
Through the research results, the hardness of PU-TiO2 coating film is higher than
that of the control PU coating.
3.1.4. Affects the abrasion resistance of the coating film
The correlation equation between the concentration and time disperse TiO2
nanoparticles with the ratio of loss due to abrasion:
Equation in code form: Y = 0.217 – 1.003X1 + 1.972X12 – 0.012X2 + 0.117X2X1 –
2
0.001X2 (3.2a).
2
Equations in real form: Y = 26.196 - 288.915C +788.879C - 0.391 + 2.334C 2
0.001 (3.2b).
Results analyze the variance (Anova) the ratio of loss due to abrasion of coating
films at the concentration and time disperse TiO2 nanoparticles:
Error sources
Squared Sum
(SS)
Degree of
freedom
(df)
Square
medium
(MS)
Statistical
value
(F)
Fk-1; n-k;1-α
(Fcrit)
Factor
838.802
9
93.200
46.599
1.947
Error
280.002
140
2.000
Total
1118.804
149
The results showed that F> Fcrit, this proves that the ratio of loss due to abrasion
of the coating film between the concentration and time disperse TiO2 nanoparticles
was different.
The ratio of loss of mass due to the abrasion of PU-TiO2 film is lower than that
of the control PU coating. When the concentration and dispersion time of TiO 2
nanoparticle changed, the ratio of abrasion loss of PU-TiO2 coating film also
decreases from 0.1305% to 0.157%.
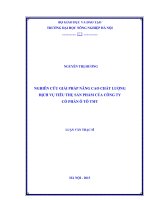
3.1.5. Affect the resistance of chemical and water of the coating film
The relationship between the concentration and dispersion time of TiO 2 nanoparticles
with the resistance of chemical and water of the coating film is shown in figure 3.4.
Acid
acetic
Alcohol etylic
cafe
Tea
Water
Figure 3.4. Relationship between concentration and dispersion time of TiO 2
nanoparticles with the resistance of chemical and water of the coating film
PU-TiO2 coating film has better resistance of chemical and water than the control
PU coating. When the concentration and dispersion time of TiO 2 nanoparticles change, the
durability of water and chemical of the PU-TiO2 coating was also changed significantly.
3.1.6. Affects the UV resistance of the coating film
a) Results of measuring the discoloration of the coating film
6
The correlation equation between the concentration and time disperse TiO 2
nanoparticles with the resistance to discoloration of the coating:
Equation in code form: Y = 17.161 – 44.428X1 + 65.833X12- 0.226X2 + 0.100X2X1
+ 0.017X22 (3.3a)
Equations in real form: Y = 34.342 – 184.288C + 263.332C2 - 0.186 + 0.400C 0.00072
(3.3b)
Results analyze the variance (Anova) the color deviation ∆E of coating films at the
concentration and time disperse TiO 2 nanoparticles:
Degree of
Square
Statistical
Squared Sum
F k-1; n-k;1-α
Error sources
freedom
medium
value
(SS)
(Fcrit)
(df)
(MS)
(F)
Factor
472.853
9
52.539
21.488
1.947
Error
342.306
140
2.445
Total
815.159
149
The results showed that F> Fcrit, this proves that the color difference of the coating film
between between the concentration and time disperse TiO 2 nanoparticles was different.
PU-TiO2 coating film has lower color deviation compared with the control PU
coating. When the concentration and dispersion time of TiO 2 nanoparticles change, the
color deviation of the PU-TiO2 coating also decreases from 14.85 to 9.62.
b) The result of measuring the gloss of the coating film
The correlation equation between the concentration and time disperse TiO 2
nanoparticles with the gloss of the coating film after illuminating UV ray:
Equation in code form: Y = 45,750 + 151,439X1 - 25,694X12- 1,326X2 +
2
0.022X2 13,283X2X1 - 0,022X22 (3.4a)
Equations in real form: Y = 20,486 + 272,108C - 102,776C2 - 40,743 + 263,660C
- 0,0222
(3.4b)
The gloss of PU-TiO2 film after illuminating UV ray is higher than that of
control coating film. When changing the concentration and dispersion time of TiO2
nano, the gloss of PU-TiO2 film oscillates from 50.34 GU to 72.81 GU.
3.1.7. Determine the suitable value of the concentration and time disperse TiO 2 nano
We have the optimal problem model as following:
We have the optimal problem model as following:
Y1 = -23,417 + 161,899C – 33,320C2 + 0,733 - 1,000C + 0,00012 Max
Y2 = 26,196 - 288,915C +788,879C2 - 0,391 + 2,334C - 0,0012 Min
Y3 = 34,342 – 184,288C +263,332C2 - 0,186 + 0,400C - 0,00072 Min
Y4 = 20,486 + 272,108C - 102,776C2 - 40,743 + 263,660C - 0,0222 Max
0,05 C 0,25; 1 5
After solving the system of equations, we obtained the results: C = 0.159; = 3,682
3.1.8. Testing with the optimum values of concentration and time disperse TiO 2 nano
The thesis will proceed to disperse TiO2 nano into PU warnish and paint on the
wood surface according to the parameters as following: concentration of TiO 2 nano: C
= 0.16%; Time disperses: = 3.68 hours; Pressure spray: P = 0.18 Mpa; Speed spray: T
= 70 m/min.
7
Table 3.1. The results of testing some quality targets of coating film on the wood
surface with appropriate parameters C and
The ratio of
The color
The gloss after
Quality
Hardness mass loss due deviation after illuminating
targets
(H)
to abrasion,
illuminating
UV ray
Sample
(%)
UV ray
(GU)
Control PU coating
2.80
0.1401
19.27
43.14
PU coating film combined 3.59
0.1152
11.24
65.19
with TiO2 nano
Level of improvement
22.01%
17.77%
41.67%
33.82%
Table 3.2. Comparing between calculated values and experimental values of some
quality targets of the coating film
The ratio of
The color
The gloss after
Quality Hardness
(H)
mass loss due deviation after illuminating
targets
to abrasion
illuminating
UV ray
(%)
UV ray
(GU)
Value
Theory
3.59
0.1152
11.24
65.19
Experiment
3.53
0.1158
11.54
64.66
Through the results in table 3.2, it shows that when experimenting with the
appropriate parameters has been found, the quality targets of PU coating combined
with TiO2 have changed significantly compared with the control PU coating. When
comparing the calculated value and the experimental value of the quality targets:
hardness, the ratio of mass loss due to abrasion, color deviation, and gloss after
illuminating UV rays, there is no significant deviation (table 3.2). Thus, the computed
optimal value can be accepted.
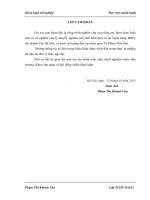
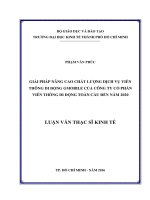
3.1.10. The chemical structure analysis of the coating film based on infrared spectrum
Table 3.3. FTIR spectral properties of PU coating film and PU coating film combined
with TiO2 nano
Number of waves (cm -1)
Functional groups
Control coating
3342.52
2926.60
1735.81
1537.64
1120.75
741.13
The coating has nano
3325.61
2926.51
1733.22
1537.61
1121.08
741.22
8
corresponding
OH
CH2
C=O
C=NH
C-OC6 H5
Figure 3.5. Infrared spectra of
control PU coating
Figure 3.6. Infrared spectra of PUTiO2 coating (C = 0.16%; τ = 3.68 hrs)
Through analysis results of infrared spectrum in table 3.3 and figure 3.5, 3.6
shows, intensity absorb infrared rays characteristic for functional groups chemical
structure in PU coating combined with TiO 2 nano has not changed significantly compared
with the control PU coating. Thus, when adding TiO 2 nanomaterials to PU coating at the
research concentration, it did not affect the components of the PU coating.
3.2. The effect of pressure and speed move of the spray gun to the quality of
coating film
3.2.1. Affect to the thickness of coating film
The correlation equation between the pressure and speed move of spray gun with
the thickness of coating film in formulas 3.5a and 3.5b.
Equation in code form: Y= 45,539+121,756X –211,444X12+0,721X2 0,680X2X1–
0,010X22 (3.5a)
Equations in real form: Y=12,642+68,143P+22,153P2-0,815V+2,720PV- 0,0004V2
(3.5b)
Results analyze the variance (Anova) the thickness of coating film at the pressure
and speed move of spray gun:
Degree of
Square
Statistical
Squared Sum
Fk-1; n-k;1-α
Error sources
freedom
medium
value
(SS)
(df)
(MS)
(F)
(Fcrit)
Factor
38577.416
9
4286.380 1504.081
1.947
Error
398.977
140
2.850
Total
38976.393
149
The results showed that F> Fcrit proves that the thickness of the coating film
between the pressure and speed move of spray gun was different.
When the pressure and speed move of spray gun changes, the thickness of the
coating film was significantly affected, changing from 46.52 m to 70.11 m.
3.2.2. Effect to the time dries completely of coating film
The correlation equation between the pressure and speed move of spray gun with
the time dries completely of coating film:
Equation in code form: Y = 27,223 – 4,439 X1+ 6,556 X12 + 0,666 X2 + 0,343 X2X1 0,004 X22 (3.6a)
Equations in real form: Y = 107,082 – 48,242P + 26,223 P2 – 1,276V + 1,373PV 0,0001V2 (3.6b)
Results analyze the variance (Anova) the time dries completely of coating film at the
pressure and speed move of spray gun:
9
Error sources
Squared Sum
(SS)
Degree of
Square
freedom
(df)
medium
(MS)
Statistical
value
(F)
Fk-1; n-k;1-α
(Fcrit)
1.947
Factor
4930.574
9
547.842
265.176
Error
289.234
140
2.066
Total
5219.808
149
The results showed that F> Fcrit, this proves that the time dries completely of
coating film between the pressure and speed move of spray gun was different.
The time dries completely of coating film at the spray levels are significantly
different, changing from 24.04 hours to 29.01 hours.
3.2.3. Affect to the gloss of coating film
The correlation equation between the pressure and speed move of spray gun with
the gloss of coating film:
Equation in code form:Y = 35.064 + 399.600X1 – 661.111X12 + 10.730X2
– 1.207X2X1 – 0.078X22 (3.7a)
Equations in real form: Y = -122.507 + 83.134P + 281.944P2 + 3.727V - 4.827PV 0.003V2 (3.7b)
Results analyze the variance (Anova) the gloss of coating film at the pressure and
speed move of spray gun:
Error sources
Squared Sum
(SS)
Degree of
freedom
(df)
Square
medium
(MS)
Statistical
value
(F)
Fk-1; n-k;1-α
(Fcrit)
1.947
Factor
77775.488
9
8641.721 3653.021
Error
331.189
140
2.366
Total
78106.677
149
The results showed that F> Fcrit, this proves that the gloss of coating film between
the pressure and speed move of spray gun was different.
The pressure and speed movement of the spray gun affect the gloss of coating film
at different levels, changing from 65.5 GU to 92.1 GU.
3.2.4. Affect to the UV resistance of coating film
The correlation equation between the pressure and speed move of spray gun with the
UV resistance of coating film:
Equation in code form: Y = 2.809 + 31.242X1 + 71.417X12 – 0.646X2 – 1.120X2X1 +
0.007X22 (3.8a)
Equations in real form: Y = -14.912 – 228.928P + 285.667 P2 + 1.698V - 4.480PV 0.0003V2 (3.8b)
Results analyze the variance (Anova) the UV resistance of coating film at the pressure
and speed move of spray gun:
Degree of
Square
Statistical
Squared Sum
Fk-1; n-k;1-α
Error sources
freedom
medium
value
(SS)
(df)
(MS)
(F)
(Fcrit)
Factor
552.506
9
61.390
28.932
1.947
Error
297.058
140
2.122
Total
849.564
149
The results showed that F> Fcrit, this proves that the UV resistance of coating film
between the pressure and speed move of spray gun was different.
Color deviation ΔE of coating film at the spray levels is different, changing from
8.57 to 14.25.
10
3.2.5. Determine the pressure and speed moves of the spray gun accordingly to finish
wood surfaces by PU-TiO2 coating
We have optimal problem model as following:
Y4 = 12,642 + 68,143P + 22,153P 2 - 0,815V + 2,720PV - 0,0004V2
Max
Y5 = 107,082 – 48,242P + 26,223 P2 – 1,276V + 1,373PV - 0,0001V2 Min
Y6 = -121,507 + 83,134P + 281,944P2 + 3,727V - 4,827PV - 0,003V2 Max
Y7 = -14,912 – 228,928P + 285,667 P 2 + 1,698V - 4,480PV - 0,0003V2 Min
0,1 P 0,26; 60 V 80
After solving the above system of equations, we obtained the results: P=0.188; V=70.75.
3.2.6. Testing with optimum value of pressure and speed moves of spray gun
The thesis will proceed to disperse TiO 2 nano into PU warnish and paint on the wood
surface according to the parameters as following: concentration of TiO2 nano: C=0.16%;
Time disperse: =3.68 hours; Pressure spray: P=0.19 MPa; Speed spray: T=71 m/min.
Table 3.4. The results of testing some quality targets of coating film on the wood
surface with parameters P and V are appropriate
Quality Thickness, The time dries
The color deviation
targets
completely, Gloss, GU after illuminating
m
Sample
hours
UV ray
Control PU coating
58.94
26.08
86.84
19.14
PU- TiO2 coating
60.29
26.41
87.39
11.32
Level of improvement
2.24%
1.25%
0.63%
40.85%
Table 3.5. Comparing between calculated values and experimental values of some
quality targets of the coating film
Quality Thickness, The time dries
The color deviation
Gloss, GU after illuminating
targets
completely,
m
Sample
hours
UV ray
Theory
60.71
26.43
88.06
11.19
Experiment
60.29
26.41
87.39
11.32
Through the results in Table 3.4 show that when experimenting with the
appropriate parameters has been found, the quality targets of PU coating combined with
TiO2 nano have changed significantly compared with the control PU coating. On the other
hand, when comparing the calculated value and the experimental value of the quality
targets: Thickness, time dries completely, gloss, and color deviation of the coating film
after illuminating UV rays, there is no significant deviation (table 3.5). Therefore, the
computed optimal value can be acceptable.
General remark: The thesis has proposed appropriate technological parameters to
improve the quality of wood surface finishing by PU coating combined with TiO2 nano:
Dispersing TiO2 nano into PU coating at concentration 0.16% through Butyl acetate
solvent containing Las surfactant in 3.68 hours and spraying PU-TiO2 coating at pressure
0.19 MPa with the speed moves of the spray gun 71 m/min is suitable.
LIST OF ARTICLES, SCIENCE WORKS PUBLISHED
1. Pham Thi Anh Hong, Cao Quoc An, Nguyen Thi Vinh Khanh, Effects of Page
concentration nano titandioxid (TiO2) to quality of polyurethane (PU) paint film 117-125
on surface wood products. Journal of Agriculture and Rural Development,
Number 2-2018;
2. Pham Thi Anh Hong, Cao Quoc An, Effect of some technological factors
dispersion titandioxid (TiO2) nano to the quality of the coating film on wood 102-112
products. Journal of Science and Forestry Technology, Number 1-2019;
3. Pham Thi Anh Hong, Tran Van Chu, Cao Quoc An, Phan Duy Hung, effects
of air pressure and spraying speed to quality of the coating film on wood
surface. Journal of Agriculture and Rural Development, Number 5-2018.
111-118