Topoisomerase I copy number alterations as biomarker for irinotecan efficacy in metastatic colorectal cancer
Bạn đang xem bản rút gọn của tài liệu. Xem và tải ngay bản đầy đủ của tài liệu tại đây (963.58 KB, 10 trang )
Palshof et al. BMC Cancer (2017) 17:48
DOI 10.1186/s12885-016-3001-y
RESEARCH ARTICLE
Open Access
Topoisomerase I copy number alterations
as biomarker for irinotecan efficacy in
metastatic colorectal cancer
Jesper Andreas Palshof1*, Estrid Vilma Solyom Høgdall2, Tim Svenstrup Poulsen2, Dorte Linnemann2,
Benny Vittrup Jensen1, Per Pfeiffer3, Line Schmidt Tarpgaard3, Nils Brünner4, Jan Stenvang4, Mette Yilmaz5
and Dorte Lisbet Nielsen1
Abstract
Background: No biomarker exists to guide the optimal choice of chemotherapy for patients with metastatic
colorectal cancer. We examined the copy numbers (CN) of topoisomerase I (TOP1) as well as the ratios of TOP1/
CEN-20 and TOP1/CEN-2 as biomarkers for irinotecan efficacy in patients with metastatic colorectal cancer.
Methods: From a national cohort, we identified 163 patients treated every third week with irinotecan 350 mg/m2
as second-line therapy. Among these 108 were eligible for analyses and thus entered the study. Primary tumors
samples were collected and tissue microarray (TMA) blocks were produced. FISH analysis was performed using two
probe-mixes: TOP1/CEN-20 and TOP1/CEN-2. Only samples harboring all three signals (TOP1, CEN-20 and CEN-2)
using FISH were included in the analyses.
Results: In the TOP1/CEN-20 probe-mix the median TOP1- and CEN-20 CN were 4.46 (range: 1.5–9.5) and 2.00
(range: 0.55–4.55), respectively. The median TOP1- and CEN-2 CN in the TOP1/CEN-2 probe-mix, were 4.57 (range: 1.
82–10.43) and 1.98 (range: 1.22–6.14), respectively. The median TOP1/CEN-20 ratio and TOP1/CEN-2 ratio were 1.25
(range: 0.92–2.90) and 2.05 (range: 1.00–6.00), respectively. None of the markers TOP1 CN, TOP1/CEN-20-ratio or
TOP1/CEN-2-ratio were associated with progression free survival, overall survival or baseline characteristics. Yet, we
observed a borderline association for a stepwise increase of the TOP1 CN in relation to objective response as hazard
ratio were 1.35 (95% CI 0.96–1.90; p = 0.081).
Conclusions: We verified a borderline significant association between increasing TOP1 CN and objective response
as previously reported. Applying the probes representing CEN-20 and CEN-2, in order to investigate the ratios of
TOP1/CEN-20 and TOP1/CEN-2 provided no further information in search of a biomarker driven patient stratification.
Other biomarkers to be paired with TOP1 CN are therefore highly warranted.
Keywords: Biomarker, Colorectal cancer, FISH, Gene copy number, Irinotecan, Topoisomerase I
Background
Colorectal cancer (CRC) is the third most common cancer
and the fourth most common cause of cancer death worldwide [1]. Almost 50% of patients diagnosed with CRC will
develop metastatic disease [2]. Standard of care for patients
with non-resectable metastatic colorectal cancer (mCRC) is
combination chemotherapy with 5-fluorouracil (5-FU)/
* Correspondence:
1
Department of Oncology, Herlev Hospital, University of Copenhagen, Herlev
Ringvej 75, DK-2730 Herlev, Denmark
Full list of author information is available at the end of the article
leucovorin (LV)/oxaliplatin (FOLFOX) or 5-FU/LV/irinotecan (FOLFIRI) with or without a targeted agent [3]. In firstline therapy, FOLFIRI and FOLFOX are considered equally
effective [4].
Predictive biomarkers for the efficacy of 5-FU, irinotecan and oxaliplatin have been suggested but none, so far,
have been implemented in the clinical setting [5]. However, a significant fraction of the patients does not benefit from the treatment but may experience serious side
effects only. The topoisomerase 1 (Top1) protein is an
essential nuclear enzyme for vital cellular processes such
© The Author(s). 2017 Open Access This article is distributed under the terms of the Creative Commons Attribution 4.0
International License ( which permits unrestricted use, distribution, and
reproduction in any medium, provided you give appropriate credit to the original author(s) and the source, provide a link to
the Creative Commons license, and indicate if changes were made. The Creative Commons Public Domain Dedication waiver
( applies to the data made available in this article, unless otherwise stated.
Palshof et al. BMC Cancer (2017) 17:48
as DNA replication, transcription, translation, recombination and repair. The primary function of Top1 is to unwind and uncoil the supercoiled DNA double helix by
transiently cleaving one of the two strands and thereby
allowing its rotation over the other strand [6]. This
intermediate cleavage state is termed the Top1 cleavage
complex (Top1cc). Top1 is the target of irinotecan
(CPT-11), a camptothecin derivative, which is metabolized to the active metabolite SN-38 which binds to and
stabilizes the Top1cc, whereby the rapidly moving DNA
replication and transcription complexes collide with this
trapped Top1ccs. The main cytotoxicity induced by irinotecan is caused by DNA double-strand breaks during
DNA replication and the presence of Top1 is thus a prerequisite for this cytotoxic effect [7, 8].
The plausible link between tumor tissue levels of Top1
and effect of Top1 inhibitors in cancer treatment [9] has
been investigated by different methods. In vitro studies
with colon cancer cell lines have demonstrated a significant correlation between the topoisomerase I gene
(TOP1) copy numbers (CN) or Top1 protein expression
and the sensitivity to SN-38 [9, 10]. A prospective clinical trial (FOCUS) investigated the association between
Top1 protein expression and benefit from FOLFOX and
FOLFIRI in patients with mCRC [11]. A significant association between Top1 protein immunoreactivity and
clinical benefit from FOLFIRI or FOLFOX was found.
However, conflicting results have been reported since
the findings could not be validated in a subsequent study
from the same group (FOCUS3) [12]. Furthermore, the
results from another large prospective trial (CAIRO)
showed no correlation of Top1 immunoreactivity and
response to irinotecan in patients with mCRC [13]. An
explanation to these diverse results was recently provided by (Maughan et al.) who showed that the antibody
used for IHC in the above mentioned studies did not
result in reproducible staining patterns [12]. We have
recently introduced another approach for Top1 quantitation in cancer cells. Instead of immunohistochemistry
IHC to quantitate protein expression we used fluorescence in situ hybridization (FISH) to assess TOP1 gene
copy number (CN) status as a proxy for the overall
Top1 protein levels. We have previously identified a significant correlation between the TOP1 gene CN, TOP1
mRNA expression and Top1 protein levels using data
generated from in vitro studies on CRC cell lines [14].
The (TOP1) gene is located on chromosome 20 at
20q12 and this region frequently undergoes CN alterations in various cancers [14–17]. In CRC, the TOP1
aberration has been reported by applying a TOP1/CEN20 fluorescence in situ hybridization (FISH) probe-mix.
The TOP1 CN gain in CRC has been reported to be in
the range of 53–84%, whereas TOP1/CEN-20 ratios ≥ 1.5
or ≥2.0 were in the range of 30–40% and 10–20%,
Page 2 of 10
respectively [14, 18, 19]. Current data suggests that
TOP1 CN increases occur predominately in conjunction
with the rest of 20q [14, 16, 17, 20] and the CEN-20 region [14, 18]. Therefore the usage of the TOP1/CEN-20
ratio may underestimate the genuine TOP1 amplifications.
Chromosome 2 (CEN-2) has been found to be the least affected by independent numeric aberrations in the genome,
and has therefore been combined with TOP1 in a TOP1/
CEN-2 probe-mix to distinguish between TOP1 gene gain
and genuine TOP1 amplifications [21]. These two different
types of CN alterations have been demonstrated to have
differential prognostic effects in stage III CRC patients
[21]. In a metastatic setting a borderline significant association (p = 0.07) between an increase in TOP1 CN and objective response to second-line treatment with irinotecan
monotherapy has been reported [19].
Therefore, we applied both a TOP1/CEN-20 and a
TOP1/CEN-2 FISH probe-mix to 108 tumors from
mCRC with the aim to investigate TOP1 CN and the ratios of both TOP1/CEN-20 and TOP1/CEN-2 as biomarkers for irinotecan efficacy.
Methods
The patients included in this explorative study were extracted from a national cohort of 498 patients with mCRC
who all received irinotecan in combination with the epidermal growth factor receptor inhibitor, cetuximab as
third-line treatment from 1st of January 2005 to 1st of
August 2008 at the Departments of Oncology at Herlev,
Odense, and Aalborg Hospitals in Denmark. The inclusion
period for the national cohort was specifically selected because it preceded the introduction of KRAS testing.
Therefore, mutational status for KRAS, NRAS and BRAF
is unknown in this cohort. From this cohort we identified
163 consecutive patients who were treated every third
week with irinotecan 350 mg/m2 as second-line therapy.
Disease evaluation was performed during treatment using
computed tomography (CT) scans of the thorax and abdomen every 9–12 weeks to evaluate response according
to the RECIST 1.0 criteria [22]. Data for objective response, progression-free survival (PFS) and overall survival (OS) were extracted from the database. PFS was
defined as time from start of treatment to progression or
death from any cause. OS was defined as time from start
of treatment to death from any cause. Last follow-up on
survival was done in October 2014. The study was approved by the Research Ethics Committee of Copenhagen
(H-KA-20060094). Reporting of the results was prepared
according to the REMARK criteria [23].
Tumor material
Only primary tumor samples were used. Formalin-fixed
paraffin-embedded samples from either resections or
core needle biopsies were collected. The presence of
Palshof et al. BMC Cancer (2017) 17:48
tumor cells in the samples was confirmed by a pathologic review performed by JP and an experienced gastrointestinal pathologist (DL). Tissue microarray (TMA)
blocks were produced; each containing tumor material
from 18 patients with two 1 mm tissue cores per patient
sample. Standard procedures were used for preparation
of the TMA blocks. The TMA blocks were cut in 2-μm
sections and stored at 5 °C until hybridization.
Fluorescence in situ hybridization (FISH)
The probes for TOP1, CEN-20 and CEN-2 were developed
and produced by the Department of Pathology, Herlev
University Hospital. All probes were sequenced to confirm
that all base pairs exactly matched the TOP1 gene and the
centromeres CEN-20 and CEN-2. Two probe-mixes:
TOP1/CEN-20 and TOP1/CEN-2 were produced. The
probes were labelled with Texas red (TOP1) and fluorescein
isothiocyanate (FITC), green for CEN-20 and CEN-2. Only
samples harboring all three signals (TOP1, CEN-20 and
CEN-2) using FISH were included in the analyses. Since
the TOP1 probe was present in both probe-mixes, it was
counted twice - independently.
Two slides from each TMA block were deparaffinized,
rehydrated, boiled in pre-treatment buffer for 10 min
and cooled in the buffer for 15 min at room temperature
followed by 2 × 3 min in wash buffer (1:20) (K5799 Dako). RTU-pepsin was added for 2 min at 37 °C and removed in wash buffer for 2 × 3 min. Following ethanol
(70% → 96% → 99%) dehydration and 15 min. air-dry,
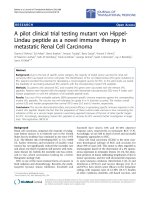
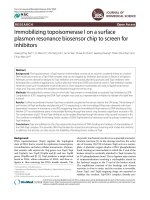
Fig. 1 CONSORT diagram showing the flow of patients and samples
Page 3 of 10
10 μL of TOP1/CEN-20 probe was applied to the center
of one of the two slides and 10 μL of TOP1/CEN-2
probe-mix was applied to the other slide. Non-specific
binding of probe was removed by stringency wash (1:20)
at 65 °C for 10 min (K5731 - Dako). A fluorescence
microscope (Olympus BX61) with DAPI, FITC, Texas
Red and dual FITC/Texas Red filter was used for
visualization of the signals. Signal counting was performed by JP, blinded to all patient data. In case of ambiguity, a senior pathologist (DL) was consulted. A
minimum of sixty TOP1 signals in total, 30 from each of
the two cores, were counted in non-overlapping cancer
nuclei with well-defined morphology and distinct fluorescent signals. If the fluorescent intensity was weak or
insufficient tumor tissue was present, a new section was
cut. If signals continued to be too weak for clear interpretation, the sample was excluded from the analyses.
Cutoffs and Definitions
A cutoff of 2 for the ratios of TOP1/CEN-20 and TOP1/
CEN-2 were used in this study.
Tumors were classified as “amplified” when (TOP1/
CEN-20 ratio ≥2 and TOP1/CEN-2 ratio ≥2) and as
“polysomies” when (TOP1/CEN-20 ratio ≤2 and TOP1/
CEN-2 ratio ≥2).
Statistics
To examine the association between TOP1 CN from the
two probe-mixes, a Reliability Analysis with an Intraclass
Palshof et al. BMC Cancer (2017) 17:48
Page 4 of 10
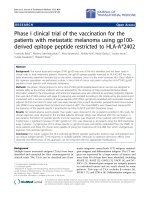
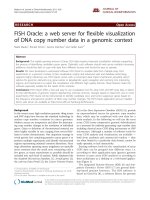
Fig. 2 Distribution of TOP1, CEN-20 and CEN-2 copy numbers and of TOP1/CEN-20 and TOP1/CEN-2 ratios. Distribution in colorectal cancer samples determined
by FISH. a Showing the distribution of the copy numbers for probe-mix TOP1/CEN-20. b Showing the distribution of the copy numbers for probe-mix TOP1/CEN-2
correlation was performed. Pearson’s chi-squared test was
used to test for associations between baseline characteristics and TOP1 CN and TOP1-/CEN-20- and CEN-2 ratios. The baseline characteristics were: gender, age, WHO
performance status (PS), location of primary tumor, resection of primary tumor, number of metastatic sites, prior
chemo- and radiotherapy, and presence of lung or liver
metastases. The TOP1 CN per cell was divided by the median value into two groups. TOP1/CEN-20- and CEN-2
ratios were divided into ≥2 and <2. p-values and 95% confidence intervals (CI) are reported.
The final analyses of survival data were performed in
October 2014. Cox proportional hazards (CPH) regression
models were used to test for association between time-toevent endpoints and both a dichotomized value and a continuous value of TOP1 signal count, TOP1/CEN-20 ratio,
and TOP1/CEN-2 ratio, with adjustment for baseline
characteristics. We also used CPH models to test “amplified” (TOP1/CEN-20 ratio ≥2 and TOP1/CEN-2 ratio ≥2)
vs “non- amplified” tumors and “polysomies” (TOP1/
CEN-20 ratio ≤2 and TOP1/CEN-2 ratio ≥2) vs “non-polysomies”. Wald chi-squared p-values hazard ratio (HR) estimates with estimated 95% CI interval were reported.
The association between TOP1 CN, TOP1/CEN-20
ratio, and TOP1/CEN-2 ratio and objective response rate
was tested using logistic regression. Responders were defined as patients with complete (CR) or partial response
(PR) according to RECIST 1.0 criteria. We also performed
the same analysis using clinical benefit rate (CBR). Clinical
benefit was defined as CR, PR or stable disease (SD)
≥6 months. For these tests, Wald chi-squared p-values
and odds ratio (OR) estimates with 95% CI were reported.
Results
In the database of our national cohort, we searched for patients having received irinotecan monotherapy as secondline therapy. We identified 163 patients. Of the 163, 26
(16%) patients were excluded as they did not have enough
tissue available for analyses, in 22 (13%) we failed to produce countable FISH signals from both probe-mix (TOP1/
CEN-20 and TOP1/CEN-2) after two attempts and 7
patients were not assessable for response due to either
concurrent surgery or radiotherapy. Thus, 108 patients
were eligible for analyses in the study (Fig. 1).
Table 1 Distribution of TOP1 CN and ratios for the 108 patients
TOP1 CN
No (%)
TOP1/CEN-2
ratio No (%)
TOP1/CEN-20
ratio No (%)
<2
7 (6)
50 (46)
98 (91)
2.0 – 2.99
23 (21)
36 (33)
10 (9)
3.0 – 3.99
14 (13)
18 (17)
-
4.0 – 4.99
25 (23)
3 (3)
-
5.0 – 5.99
15 (14)
-
-
6.0 – 6.99
13 (12)
1 (1)
-
>7
11 (10)
-
-
46 (43)
62 (57)
Yes
28 (26)
No
No
80 (74)
Yes
5 (5)
103 (95)
3 (3)
F + Oxa + Bev
Yes
95 (88)
F + Oxa
No
10 (9)
36 (33)
>2
F
37 (34)
35 (33)
1
2
98 (91)
10 (9)
41 (38)
Rectum
Yes
43 (40)
Left
No
24 (22)
4 (4)
unknowna
Right
51 (47)
53 (49)
0
<65
1–2
52
56
≥65
35 (54)
29 (47)
25 (54)
11 (39)
43 (54)
52 (50)
2 (40)
0 (0)
47 (49)
7 (70)
18 (50)
19 (54)
17 (46)
6 (60)
48 (49)
19 (46)
22 (51)
13 (54)
26 (49)
25 (49)
31 (55)
23 (44)
19 (44)
33 (53)
21 (46)
17 (61)
37 (46)
51 (50)
3 (60)
3 (100)
48 (51)
3 (30)
18 (50)
16 (46)
20 (54)
4 (40)
50 (51)
22 (54)
21 (49)
11 (46)
27 (51)
26 (51)
25 (45)
29 (56)
24 (56)
30 (46)
54 (50)
≤ median 4.46
No (%)
>median 4.46 No (%)
54 (50)
TOP1 CN per cell
TOP1 CN per cell
0.44
0.19
0.65
0.10
0.78
0.51
0.82
0.99
0.25
0.33
Pearson
Chi-Square
test p
7 (11)
3 (7)
2 (7)
8 (10)
10 (10)
0 (0)
0 (0)
7 (7)
3 (30)
3 (8)
4 (11)
3 (8)
3 (30)
7 (7)
3 (7)
6 (14)
1 (4)
5 (9)
5 (10)
6 (11)
4 (8)
4 (9)
6 (9)
10 (9)
TOP1/CEN-20
ratio ≥ 2 N
(%)
Abbreviations: CN Copy number, F Fluorouracil (5-FU), Oxa Oxaliplatin, Bev Bevacizumab, HR Hazard ratio, CI Confidence interval
Lung metastases
Liver metastases
Prior radiotherapy
Prior chemotherapy
Number of metastatic sites
Primary tumor resected
Location primary tumor
WHO PS
Age
65 (60)
43 (40)
Males
Gender
Females
108 (100)
Patients included
Total N
(%)
Table 2 Baseline Characteristics and TOP1 copy number
55 (89)
43 (93)
26 (93)
72 (90)
93 (90)
5 (100)
3 (100)
88 (93)
7 (70)
33 (92)
31 (89)
34 (92)
7 (70)
91 (93)
38 (93)
37 (86)
23 (96)
48 (91)
46 (90)
50 (89)
48 (92)
39 (91)
59 (91)
98 (91)
TOP1/CEN-20
ratio < 2 N
(%)
0.40
0.65
0.47
0.054
0.87
0.02
0.36
0.95
0.59
0.99
Pearson
Chi-Square
test p
34 (55)
24 (52)
15 (54)
43 (54)
54 (52)
4 (80)
0 (0)
49 (52)
9 (90)
22 (61)
14 (40)
22 (59)
7 (70)
51 (52)
25 (61)
23 (53)
10 (42)
31
25
32 (57)
26 (50)
21 (49)
37 (57)
58 (54)
TOP1/CEN-2
ratio ≥ 2 N
(%)
28 (45)
22 (48)
13 (46)
37 (46)
49 (48)
1 (20)
3 (100)
46 (48)
1 (10)
14 (39)
21 (60)
15 (41)
3 (30)
47 (48)
16 (39)
20 (47)
14 (58)
22
26
24 (43)
26 (50)
22 (51)
28 (43)
50 (46)
TOP1/CEN-2
ratio < 2 N
(%)
0.78
0.99
0.23
0.01
0.14
0.28
0.32
0.33
0.46
0.41
Pearson
Chi-Square
test p
Palshof et al. BMC Cancer (2017) 17:48
Page 5 of 10
Palshof et al. BMC Cancer (2017) 17:48
TOP1 CN was counted twice due to the use of two
probe-mixes. When comparing the results of TOP1 CN
from the two probe-mixes, the Single Measures Intraclass correlation was r = 0.74 (CI 0.64–0.82; p <0.001).
The Spearman correlation between TOP1 and CEN-2
was: r = 0.44 (p <0.001), between TOP1 and CEN-20:
r = 0.82 (p <0.001) and between CEN-2 and CEN-20:
r = 0.41 (p <0.001).
For the TOP1/CEN-20 probe-mix, the median
TOP1- and CEN-20 CN were 4.46 (range: 1.5–9.5)
and 2.00 (range: 0.55–4.55), respectively. The median
TOP1- and CEN-2 CN in the TOP1/CEN-2 probemix, were 4.57 (range: 1.82–10.43) and 1.98 (range:
1.22–6.14), respectively. The median TOP1/CEN-20
ratio and TOP1/CEN-2 ratio were 1.25 (range: 0.92–
2.90) and 2.05 (range: 1.00–6.00), respectively (Fig. 2).
The distribution of TOP1 CN and ratios for the 108
patients are shown in Table 1. We used the median
TOP1 CN (probe-mix TOP1/CEN-20) to test the association with baseline characteristics (Table 2). Significant associations between prior chemotherapy and
TOP1/CEN-2 ratio and between liver metastases and
TOP1/CEN-20 ratio were found. However, these results were not significant after correction for multiple
testing (data not shown).
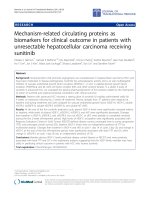
Ten patients (9%) had PR, 46 (43%) had SD, and 51
(47%) had PD as best response. The distribution of
TOP1 CN for patients having PR, SD and PD is illustrated in Fig. 3. The OR estimates for a stepwise increase
of the TOP1 CN and TOP1/CEN-20 and TOP1/CEN-2
ratios in relation to objective response were 1.35 (CI
0.96–1.90; p = 0.081), 1.99 (CI 0.51–7.75; p = 0.32), and
1.34 (CI 0.69–2.64; p = 0.40), respectively. No significant
association was found between CBR and a stepwise
increase of the TOP1 CN, TOP1/CEN-20- or TOP1/
CEN-2-ratio as the OR estimates were 1.01 (CI 0.81–
1.25; p = 0.94), 0.72 (CI 0.24–2.14; p = 0.56), and 0.88 (CI
0.54–1.42; p = 0.60), respectively.
The median PFS and OS were 3.8 months (range: 1.3–
13.1) and 16.4 months (range: 4.6–91.6), respectively. None
of the biomarkers TOP1 CN, TOP1/CEN-20-ratio or
TOP1/CEN-2-ratio when tested as continuous variables,
were associated with PFS as HRs were 0.99 (CI 0.90–1.10;
p = 0.88), 0.99 (CI 0.56–1.74; p = 0.97), and 1.10 (CI 0.85–
1.35; p = 0.58), respectively. For OS, HRs were 0.98 (CI
0.89–1.08; p = 0.72), 1.02 (CI 0.61–1.70; p = 0.95), and 1.00
(CI 0.79–1.27; p = 0.98) for TOP1 CN, TOP1/CEN-20-ratio
and TOP1/CEN-2-ratio, respectively (Table 3).
We did not find any associations between the dichotomized version of TOP1 CN and PFS and OS as HRs
were 0.95 (CI 0.65–1.40; p = 0.79) and 0.92 (CI 0.62–
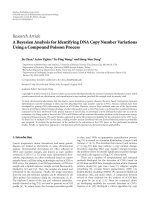
1.35; p = 0.66), respectively. We also tested PFS as a
function of TOP1 CN divided into tertiles and found no
significant association, log-rank p = 0.66 (Fig. 4).
Page 6 of 10
Fig. 3 Boxplot. Distribution of TOP1 copy number as a function of
best response to chemotherapy. The top and bottom of the box
represents the upper and lower quartiles and the black line in the
box the median. The whiskers represent the maximum and
minimum values, excluding outliers
According to the definitions used, 9% had an amplified tumor (TOP1/CEN-20 ratio ≥ 2 and TOP1/CEN-2
ratio ≥ 2), 44% had a tumor harboring a q-20 polysomy
(TOP1/CEN-20 ratio ≤ 2 and TOP1/CEN-2 ratio ≥ 2),
and 46% had a tumor that was neither amplified nor a
polysomy. Patients with tumors classified as harboring
a TOP1 amplification did not have improved PFS: HR
1.71 (CI 0.88–3.32; p = 0.12) or OS: HR 1.32 (CI 0.69–
2.54; p = 0.41). Neither did patients with tumors classified as harboring q-20 TOP1 polysomy: PFS HR 0.94
(CI 0.64–1.38; p = 0.75) and OS HR 0.71 (CI 0.48–1.05;
p = 0.08). There were no significant associations between TOP1 amplification or q-20 TOP1 polysomy and
objective response.
No multivariate analysis was performed since the variables tested were not significant in the univariate
analyses.
Discussion
This study is the first to report the CN of TOP1 and the
ratios of TOP1/CEN-20 and TOP1/CEN-2 in CRC patients and their relation to objective response to irinotecan in a metastatic setting. We added a probe for CEN-2
to discriminate between an increase in TOP1 CN due to
mechanisms localized to chromosome 20 and an increase caused by increased ploidy level. We chose
chromosome 2 because this chromosome has been reported to undergo fewer alterations when compared to
other chromosomes in cancer specimens [24]. In accordance with this, a recent study investigating TOP1 CN aberrations, considered CEN-20 CN as an inappropriate
Palshof et al. BMC Cancer (2017) 17:48
Page 7 of 10
Table 3 Univariate survival analyses
Progression-free survival
HR
95% CI
Overall survival
p
95% CI
(ref)
p
Gender
Females
Males
0.65
0.43–0.96
0.03
0.64
0.43–0.94
Age
Per 1 year increase
0.99
0.97–1.02
0.63
0.98
0.96–1.01
0.16
0
0.84
0.57–1.24
0.38
0.59
0.39–0.88
0.009
1–2
(ref)
1.21
0.72–2.02
0.48
1.14
0.74–1.76
0.55
0.40–1.50
0.49
1.31
0.82–2.10
0.27
1.51
0.95–2.40
0.09
WHO PS
(ref)
HR
0.03
(ref)
unknowna
Location primary tumor
Primary tumor resected
Number of metastatic sites
Prior chemotherapy
Prior radiotherapy
Liver metastases
Lung metastases
Right
0.74
0.45–1.23
0.25
Left
0.87
0.57–1.35
0.54
Rectum
(ref)
(ref)
Yes
0.78
No
(ref)
0.41–1.51
0.46
1
(ref)
2
1.05
0.66–1.67
0.84
>2
1.23
0.77–1.96
0.40
F
(ref)
0.78
(ref)
(ref)
(ref)
F + Oxa
0.99
0.52–1.92
0.99
2.50
1.25–5.00
0.009
F + Oxa + Bev
1.91
0.52–6.96
0.33
3.53
0.94–13.2
0.06
Yes
0.71
0.29–1.75
0.46
0.85
0.35–2.10
0.73
No
(ref)
0.76–1.82
0.64
1.01–2.21
0.044
Yes
0.88
No
(ref)
Yes
1.09
No
(ref)
(ref)
0.57–1.37
0.58
1.18
(ref)
0.73–1.61
0.67
1.50
(ref)
TOP1 CN (CEN-20)
Per 1 unit increase
0.99
0.90–1.10
0.88
0.98
0.89–1.08
0.72
TOP1 CN (CEN-20)
>median (4.46)
0.95
0.65–1.40
0.79
0.92
0.62–1.35
0.66
≤ median (4,46)
(ref)
Per 1 unit increase
0.99
0.56–1.74
0.97
1.02
0.61–1.70
0.95
TOP1/CEN-2 ratio
Per 1 unit increase
1.10
0.85–1.35
0.58
1.00
0.79–1.27
0.98
TOP1/CEN-20 ratio
<1.5 (ref)
0.73
0.47–1.13
0.16
0.75
0.48–1.17
0.21
TOP1/CEN-20 ratio
≥1.5
(ref)
Abbreviations: F Fluorouracil (5-FU), Oxa Oxaliplatin, Bev Bevacizumab, HR Hazard ratio, CI Confidence interval
a
Unknowns were not included in the shown proportions or test for distribution differences
marker for cellular ploidy based on the frequent gain of
chromosome 20 or 20q [21].
TOP1 cut-off values were chosen based on the median
value. This decision was partly based on the results from
a similar study [25] and partly to obtain two equally
sized groups. In our study, we found a higher median
gene CN for TOP1 (4.46) than reported in the study by
Nygaard et al. (3.6) [25]. A plausible explanation for this
discrepancy could be the difference in number of cells
counted. In our study we counted a minimum of 60 signals of TOP1 CN for each patient giving a median of
14.5 and a range of 8–40 counted nuclei. This is less
than the 60 nuclei counted by Nygaard et al. One could
argue that since we selected the nuclei with the best
quality signals for counting we also tended to select the
nuclei with the highest CNs. Despite the difference in
methods, our study showed the same results as Nygaard
et al. concerning the association with objective response,
PFS, and OS.
Previously, a positive correlation between the TOP1
CN and in vitro sensitivity to SN-38 was reported in
CRC cell lines and this was also demonstrated for the
TOP1/CEN-20 ratio. Notably, the correlation for the
TOP1 CN was superior to the TOP1/CEN-20 ratio,
which is consistent with the data in our study [18]. Our
results demonstrated a borderline significant association
Palshof et al. BMC Cancer (2017) 17:48
Fig. 4 Kaplan-Meier plot for progression-free survival as a function
of TOP1 gene copy number. Patients were divided into tertiles by
TOP1 copy number
between TOP1 CN and objective response (p = 0.08),
which is in accordance with the results by Nygaard et al.
(p = 0.07) [19]. However, this result was not further supported as there were no association between TOP1 CN
and PFS. Regarding the ratios of TOP1/CEN-20 or
TOP1/CEN-2 and response to irinotecan we found no
associations to irinotecan response. However, the TOP1
CNs was significantly correlated to the CEN-20 CNs
which may mask TOP1 amplification. Collectively, these
findings could support the use of gene CN only instead
of a gene/CEN ratio, which is further supported from
the clinically implemented human epidermal receptor-2
(HER2) FISH analysis where only HER-2 CN can be reported without the ratio in cases with coamplification of
HER-2 and CEN-17 [26].
The patients in this study constituted a selected group
with a good prognosis as they were identified from a national cohort characterized by all patients having received third line treatment (irinotecan + cetuximab).
Besides a long median OS (16.4 months) as could be expected in this selected group, the clinical data in this
study corresponded to what have previously been reported from studies including irinotecan second-line
monotherapy with RR of 10% [27]. With 108 patients
and RR of only 9% we have limited power to detect a
predictive value of TOP1 as a biomarker for response.
For that reason, we also investigated clinical benefit rate.
A major obstacle for obtaining a high level of evidence
for predictive biomarkers is the lack of well-defined cutoff values for overexpression and gene amplification.
Even for a well-established biomarker such as HER-2 in
breast cancer, cut-off values are still discussed and have
changed over time.
The level of Top1 protein expression could be useful as a predictive biomarker for the response to
Top1 targeting chemotherapy. A number of studies
Page 8 of 10
have investigated this possibility in patients having
CRC, but with conflicting results [10–14]. These inconsistent results may partly be explained by the fact
that immunohistochemistry (IHC) requires validated
antibodies as well as standardized protocols, both of
which have been difficult to obtain for Top1. Accordingly, Top1 IHC has not yet reached the required
level for clinical implementation.
Another aspect is the different DNA repair mechanisms activated upon DNA damage which may in part
explain why TOP1 CN alone could not predict response.
A study reported that the expression of aprataxin, a histidine triad domain superfamily protein involved in
DNA repair, in 30 CRC cell lines was correlated with
sensitivity to irinotecan [28]. Another repair pathway,
the tyrosyl-DNA-phosphodiesterase I (TDP1) was investigated in clinical CRC samples and cell lines. The authors reported that TDP1 is involved in the resolution of
DNA damage associated with Top1 poisons and that the
protein expression levels of TDP1 or Top 1 alone were
not associated with sensitivity to irinotecan [29].
A robust correlation between TOP1 CN status, gene
expression level, protein expression level and -activity in
cancer cell lines [9, 30] and cancer tissues [31, 32] has
been reported. Accordingly, the TOP1 CN may be a useful “proxy” predictive biomarker for Top1 targeting
drugs. One concern in this study is whether the TOP1
CN determined in primary tumors correspond to the
CN in the treated metastases. In our study primary tumors were analyzed in order to test our hypothesis.
However, the majority of the treated tumor volumes in
these patients consisted of metastases. Conflicting results have been reported regarding the concordance between primary tumor and metastases. Two studies
reported a significantly higher Top1 expression in the
metastases than in the corresponding primary tumor
[33] [34]. Yet, other studies investigating TOP1 mRNA
[35] and Top1 protein levels [36] have reported concordance between primary tumors and metastases. Another concern is the impact of prior treatments as it
may change the biologic profile between the primary
and recurrent tumors. An ideal design to overcome the
difficulties mentioned above would be to assess TOP1
CN in the metastasis from mCRC prior to first-line
irinotecan-containing therapy.
Conclusions
We verified a borderline significant association between
increasing TOP1 CN and objective response to irinotecan monotherapy in mCRC patients as previously
reported. Applying CEN-20 and CEN-2, to TOP1, did
not provide further information to assist a biomarker
driven patient stratification, suggesting that other biomarkers should be paired with TOP1 CN.
Palshof et al. BMC Cancer (2017) 17:48
Acknowledgements
The authors wish to thank Birgitte Christiansen and Hanne Michelsen for
excellent assistance in data collecting. The bioanalysts at the Molecular Unit,
Department of Pathology, Herlev Hospital for assistance in TMA production
and FISH analyzes. Statistician Tobias Wirenfeldt Klausen, Department of
Hematology, Herlev Hospital for assistance with statistical analysis. Sofie Seit
Jespersen, Jakob Johansen and Frederik Schaltz-Buchholzer for assistance
with the database. This work was supported by The Danish Cancer Research
Foundation and the I.M. Daehnfeldt Foundation.
Funding
The Danish Cancer Research Foundation and I.M Daehnfeldt Foundation.
Availability of data and materials
The materials described in this article including raw data are deposited at
the department of Oncology, Herlev University Hospital, Denmark and will
be available to any scientist on request.
Authors’ contributions
Conception and design: JAP, EH, DLN, BVJ, NB, TSP, DL, JS. Provision of study
materials or patients: JAP, DL, EH, DLN, BVJ, TSP, MY, PP, LST. Collection and
assembly of data: JAP, DL, DLN, EH, PP, LST, MY. Data analysis and
interpretation: JAP, JS, NB, TSP, EH, DL, DLN. Manuscript writing and critical
revision: JAP wrote first draft. DLN, JS, NB, EH and LST revised it critically.
Final approval of manuscript: All authors.
Page 9 of 10
6.
7.
8.
9.
10.
11.
12.
13.
Competing interests
The authors declare that they have no competing interests.
Consent to publication
All data reported in this article are entirely unidentifiable and thus no
consent for publication has been obtained.
Ethics approval and consent to participate
The study was approved by the Research Ethics Committee of Copenhagen
(H-KA-20060094).” In Denmark approval for retrospective studies can be
obtained without having signed informed consent if 1) the data generated
do not influence future treatments of the patients 2) if the study does not
represent any harm to the patients. All the patients in this study are
deceased.
Author details
1
Department of Oncology, Herlev Hospital, University of Copenhagen, Herlev
Ringvej 75, DK-2730 Herlev, Denmark. 2Department of Pathology, Herlev
Hospital, University of Copenhagen, Herlev Ringvej 75, DK-2730 Herlev,
Denmark. 3Department of Oncology, Odense University Hospital, Sdr.
Boulevard 29, 5000 Odense C, Denmark. 4Faculty of Health and Medical
Sciences, Department of Veterinary Disease Biology, Section for Molecular
Disease Biology and Sino-Danish Breast Cancer Research Centre, University of
Copenhagen, Copenhagen, Denmark. 5Department of Oncology, Aalborg
University Hospital, Hobrovej 18-22, 9100 Aalborg, Denmark.
14.
15.
16.
17.
18.
19.
Received: 27 January 2016 Accepted: 14 December 2016
References
1. Haggar FA, Boushey RP. Colorectal cancer epidemiology: incidence,
mortality, survival, and risk factors. Clin Colon Rectal Surg. 2009;22(4):191–7.
2. Siegel R, Desantis C, Jemal A. Colorectal cancer statistics, 2014. CA Cancer J
Clin. 2014;64(2):104–17.
3. Schmoll HJ, Van Cutsem E, Stein A, Valentini V, Glimelius B, Haustermans K,
Nordlinger B, van de Velde CJ, Balmana J, Regula J, et al. ESMO Consensus
Guidelines for management of patients with colon and rectal cancer. a
personalized approach to clinical decision making. Ann Oncol. 2012;23(10):
2479–516.
4. Tournigand C, Andre T, Achille E, Lledo G, Flesh M, Mery-Mignard D,
Quinaux E, Couteau C, Buyse M, Ganem G, et al. FOLFIRI followed by
FOLFOX6 or the reverse sequence in advanced colorectal cancer:
a randomized GERCOR study. J Clin Oncol. 2004;22(2):229–37.
5. Burstein HJ, Mangu PB, Somerfield MR, Schrag D, Samson D, Holt L, Zelman
D, Ajani JA, American Society of Clinical O. American Society of Clinical
20.
21.
22.
23.
Oncology clinical practice guideline update on the use of chemotherapy
sensitivity and resistance assays. J Clin Oncol. 2011;29(24):3328–30.
Pommier Y, Leo E, Zhang H, Marchand C. DNA topoisomerases and
their poisoning by anticancer and antibacterial drugs. Chem Biol. 2010;
17(5):421–33.
Gilbert DC, Chalmers AJ, El-Khamisy SF. Topoisomerase I inhibition in
colorectal cancer: biomarkers and therapeutic targets. Br J Cancer.
2012;106(1):18–24.
Ashour ME, Atteya R, El-Khamisy SF. Topoisomerase-mediated chromosomal
break repair: an emerging player in many games. Nat Rev Cancer. 2015;
15(3):137–51.
McLeod HL, Keith WN. Variation in topoisomerase I gene copy number as a
mechanism for intrinsic drug sensitivity. Br J Cancer. 1996;74(4):508–12.
Jansen WJ, Zwart B, Hulscher ST, Giaccone G, Pinedo HM, Boven E. CPT-11
in human colon-cancer cell lines and xenografts: characterization of cellular
sensitivity determinants. Int J Psychol. 1997;70(3):335–40.
Braun MS, Richman SD, Quirke P, Daly C, Adlard JW, Elliott F, Barrett JH,
Selby P, Meade AM, Stephens RJ, et al. Predictive biomarkers of
chemotherapy efficacy in colorectal cancer: results from the UK MRC FOCUS
trial. J Clin Oncol. 2008;26(16):2690–8.
Maughan TS, Meade AM, Adams RA, Richman SD, Butler R, Fisher D, Wilson
RH, Jasani B, Taylor GR, Williams GT, et al. A feasibility study testing
four hypotheses with phase II outcomes in advanced colorectal cancer
(MRC FOCUS3): a model for randomised controlled trials in the era of
personalised medicine? Br J Cancer. 2014;110(9):2178–86.
Koopman M, Knijn N, Richman S, Seymour M, Quirke P, van Tinteren H, van
Krieken JHJM, Punt CJA, Nagtegaal ID. 6003 The correlation between
Topoisomerase-I (Topo1) expression and outcome of treatment with
capecitabine and irinotecan in advanced colorectal cancer (ACC) patients
(pts) treated in the CAIRO study of the Dutch Colorectal Cancer Group
(DCCG). Eur J Cancer Suppl. 2009;7(2):321–2.
Romer MU, Jensen NF, Nielsen SL, Muller S, Nielsen KV, Nielsen HJ, Brunner
N. TOP1 gene copy numbers in colorectal cancer samples and cell lines
and their association to in vitro drug sensitivity. Scand J Gastroenterol.
2012;47(1):68–79.
Fan B, Dachrut S, Coral H, Yuen ST, Chu KM, Law S, Zhang L, Ji J,
Leung SY, Chen X. Integration of DNA copy number alterations and
transcriptional expression analysis in human gastric cancer. PLoS One.
2012;7(4):e29824.
Ryan D, Rafferty M, Hegarty S, O’Leary P, Faller W, Gremel G, Bergqvist M,
Agnarsdottir M, Stromberg S, Kampf C, et al. Topoisomerase I amplification
in melanoma is associated with more advanced tumours and poor
prognosis. Pigment Cell Melanoma Res. 2010;23(4):542–53.
Tanner MM, Tirkkonen M, Kallioniemi A, Collins C, Stokke T, Karhu R, Kowbel
D, Shadravan F, Hintz M, Kuo WL, et al. Increased copy number at 20q13 in
breast cancer: defining the critical region and exclusion of candidate genes.
Cancer Res. 1994;54(16):4257–60.
Romer MU, Nygard SB, Christensen IJ, Nielsen SL, Nielsen KV, Muller S, Smith
DH, Vainer B, Nielsen HJ, Brunner N. Topoisomerase 1(TOP1) gene copy
number in stage III colorectal cancer patients and its relation to prognosis.
Mol Oncol. 2013;7(1):101–11.
Nygard SB, Christensen IJ, Nielsen SL, Nielsen HJ, Brunner N, Spindler KL.
Assessment of the topoisomerase I gene copy number as a predictive
biomarker of objective response to irinotecan in metastatic colorectal
cancer. Scand J Gastroenterol. 2013;49(1):84–91.
Tanner MM, Grenman S, Koul A, Johannsson O, Meltzer P, Pejovic T, Borg A,
Isola JJ. Frequent amplification of chromosomal region 20q12-q13 in
ovarian cancer. Clin Cancer Res. 2000;6(5):1833–9.
Smith DH, Christensen IJ, Jensen NF, Markussen B, Romer MU, Nygard SB,
Muller S, Nielsen HJ, Brunner N, Nielsen KV. Mechanisms of topoisomerase I
(TOP1) gene copy number increase in a stage III colorectal cancer patient
cohort. PLoS One. 2013;8(4):e60613.
Therasse P, Arbuck SG, Eisenhauer EA, Wanders J, Kaplan RS, Rubinstein L,
Verweij J, Van Glabbeke M, van Oosterom AT, Christian MC, et al. New
guidelines to evaluate the response to treatment in solid tumors. European
Organization for Research and Treatment of Cancer, National Cancer
Institute of the United States, National Cancer Institute of Canada.
J Natl Cancer Inst. 2000;92(3):205–16.
Altman DG, McShane LM, Sauerbrei W, Taube SE. Reporting
recommendations for tumor marker prognostic studies (REMARK):
explanation and elaboration. BMC Med. 2012;10:51.
Palshof et al. BMC Cancer (2017) 17:48
Page 10 of 10
24. Beroukhim R, Mermel CH, Porter D, Wei G, Raychaudhuri S, Donovan J,
Barretina J, Boehm JS, Dobson J, Urashima M, et al. The landscape of
somatic copy-number alteration across human cancers. Nature. 2010;
463(7283):899–905.
25. Nygard SB, Christensen IJ, Nielsen SL, Nielsen HJ, Brunner N, Spindler KL.
Assessment of the topoisomerase I gene copy number as a predictive
biomarker of objective response to irinotecan in metastatic colorectal
cancer. Scand J Gastroenterol. 2014;49(1):84–91.
26. Hanna WM, Ruschoff J, Bilous M, Coudry RA, Dowsett M, Osamura RY,
Penault-Llorca F, van de Vijver M, Viale G. HER2 in situ hybridization in
breast cancer: clinical implications of polysomy 17 and genetic
heterogeneity. Mod Pathol. 2014;27(1):4–18.
27. Oostendorp LJ, Stalmeier PF, Pasker-de Jong PC, Van der Graaf WT,
Ottevanger PB. Systematic review of benefits and risks of second-line
irinotecan monotherapy for advanced colorectal cancer. Anteicancer Drugs.
2010;21(8):749–58.
28. Dopeso H, Mateo-Lozano S, Elez E, Landolfi S, Ramos Pascual FJ, HernandezLosa J, Mazzolini R, Rodrigues P, Bazzocco S, Carreras MJ, et al. Aprataxin
tumor levels predict response of colorectal cancer patients to irinotecanbased treatment. Clin Cancer Res. 2010;16(8):2375–82.
29. Meisenberg C, Gilbert DC, Chalmers A, Haley V, Gollins S, Ward SE, El-Khamisy
SF. Clinical and cellular roles for TDP1 and TOP1 in modulating colorectal
cancer response to irinotecan. Mol Cancer Ther. 2015;14(2):575–85.
30. Reinhold WC, Mergny JL, Liu H, Ryan M, Pfister TD, Kinders R, Parchment R,
Doroshow J, Weinstein JN, Pommier Y. Exon array analyses across the
NCI-60 reveal potential regulation of TOP1 by transcription pausing at
guanosine quartets in the first intron. Cancer Res. 2010;70(6):2191–203.
31. Yu J, Miller R, Zhang W, Sharma M, Holtschlag V, Watson MA, McLeod HL.
Copy-number analysis of topoisomerase and thymidylate synthase genes in
frozen and FFPE DNAs of colorectal cancers. Pharmacogenomics. 2008;9(10):
1459–66.
32. Husain I, Mohler JL, Seigler HF, Besterman JM. Elevation of topoisomerase I
messenger RNA, protein, and catalytic activity in human tumors:
demonstration of tumor-type specificity and implications for cancer
chemotherapy. Cancer Res. 1994;54(2):539–46.
33. Silvestris N, Simone G, Partipilo G, Scarpi E, Lorusso V, Brunetti AE, Maiello E,
Paradiso A, Mangia A. CES2, ABCG2, TS and Topo-I primary and
synchronous metastasis expression and clinical outcome in metastatic
colorectal cancer patients treated with first-line FOLFIRI regimen. Int J Mol
Sci. 2014;15(9):15767–77.
34. Tsavaris N, Lazaris A, Kosmas C, Gouveris P, Kavantzas N, Kopterides P,
Papathomas T, Agrogiannis G, Zorzos H, Kyriakou V, et al. Topoisomerase I
and IIalpha protein expression in primary colorectal cancer and recurrences
following 5-fluorouracil-based adjuvant chemotherapy. Cancer Chemother
Pharmacol. 2009;64(2):391–8.
35. Vallbohmer D, Iqbal S, Yang DY, Rhodes KE, Zhang W, Gordon M, Fazzone
W, Schultheis AM, Sherrod AE, Danenberg KD, et al. Molecular determinants
of irinotecan efficacy. Int J Cancer. 2006;119(10):2435–42.
36. Boonsong A, Curran S, McKay JA, Cassidy J, Murray GI, McLeod HL.
Topoisomerase I protein expression in primary colorectal cancer and lymph
node metastases. Hum Pathol. 2002;33(11):1114–9.
Submit your next manuscript to BioMed Central
and we will help you at every step:
• We accept pre-submission inquiries
• Our selector tool helps you to find the most relevant journal
• We provide round the clock customer support
• Convenient online submission
• Thorough peer review
• Inclusion in PubMed and all major indexing services
• Maximum visibility for your research
Submit your manuscript at
www.biomedcentral.com/submit