Prognostic and predictive significance of tumor length in patients with esophageal squamous cell carcinoma undergoing radical resection
Bạn đang xem bản rút gọn của tài liệu. Xem và tải ngay bản đầy đủ của tài liệu tại đây (1.58 MB, 11 trang )
Wu and Chen BMC Cancer (2016) 16:394
DOI 10.1186/s12885-016-2417-8
RESEARCH ARTICLE
Open Access
Prognostic and predictive significance of
tumor length in patients with esophageal
squamous cell carcinoma undergoing
radical resection
Jie Wu* and Qi-Xun Chen
Abstract
Background: The objective of this study was to investigate the prognostic and predictive significance of tumor
length in patients with esophageal squamous cell carcinoma undergoing radical resection.
Methods: Tumor length and other clinicopathological variables were retrospectively evaluated in 1435 patients
with squamous cell carcinoma treated with radical resection between 2003 and 2010. Tumor length was analyzed
as categorical and continuous variable. Associations with overall survival were assessed with Cox proportional
hazards models. Model-based nomograms were constructed. Predictive accuracy was measured with C-index.
Decision curve analysis was used to evaluate clinical usefulness of prediction models.
Results: Both categorically and continuously coded tumor length were independent prognostic factors in
multivariable analysis. Adding categorically and continuously coded tumor length to TNM staging model increased
predictive accuracy by 0.2 and 0.4 % respectively. Decision curve analysis revealed that the models built by the
addition of categorically or continuously coded tumor length did not perform better than TNM staging model.
Conclusions: Tumor length is an independent prognostic factor in patients with esophageal squamous cell
carcinoma treated with radical resection. It increases predictive accuracy of TNM staging system for overall survival
in these patients. But it does not increase clinical usefulness of TNM staging system as a prediction model.
Keywords: Esophageal cancer, Squamous cell carcinoma, Tumor length, Prognosis
Background
Esophageal cancer is one of the most aggressive malignancies throughout the world with the sixth highest cancer deaths annually [1]. The tumor, node, metastasis
(TNM) staging system is an important tool to assess
prognosis, guide therapy, formulate treatment protocols
and promote the exchange of information between different centers [2]. In the current 7th edition of American
Joint Committee on Cancer (AJCC) TNM staging system,
histological grading, tumor location as well as depth of
esophageal wall invasion are used for stage grouping for
squamous cell carcinoma [3]. Recently some authors
found tumor length was an independent prognostic factor
for esophageal cancer [4–11], and even suggested incorporating tumor length into TNM staging system to identify
high-risk patients for postoperative therapy [4–9]; while
others did not find any associations between tumor length
and long-term survival in patients with esophageal cancer
[12–15]. Therefore the prognostic role of tumor length
still needs to be ascertained. On the other hand, whether
incorporating tumor length into TNM staging system
could generate a better prediction model for outcomes of
esophageal cancer patients also requires to be further investigated. The purpose of this study was to evaluate the
prognostic and predictive significance of tumor length in
patients with esophageal squamous cell carcinoma treated
with radical resection within a single institution.
* Correspondence:
Department of Thoracic Surgery, Zhejiang Cancer Hospital, 1 East Banshan
Road, Hangzhou 310022, Zhejiang Province, China
© 2016 The Author(s). Open Access This article is distributed under the terms of the Creative Commons Attribution 4.0
International License ( which permits unrestricted use, distribution, and
reproduction in any medium, provided you give appropriate credit to the original author(s) and the source, provide a link to
the Creative Commons license, and indicate if changes were made. The Creative Commons Public Domain Dedication waiver
( applies to the data made available in this article, unless otherwise stated.
Wu and Chen BMC Cancer (2016) 16:394
Methods
Study population
This study was approved by the institutional review
board of Zhejiang Cancer Hospital and the need for
individual patient consent was waived. The study was
conducted with data collected from a prospectively collected database for esophageal cancer. Between January
2003 and December 2010, 1613 consecutive cases were
surgically treated at the Department of Thoracic Surgery
of Zhejiang Cancer Hospital. Because an institutional
electronic medical record system was used in our hospital since January 2003, this date was chosen as the
starting date for the study. A total of 1435 patients with
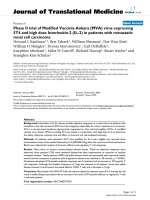
Fig. 1 Flow chart of study population
Page 2 of 11
esophageal squamous cell carcinoma after resection with
curative intent were included in this study (Fig. 1).
Among 47 patients excluded because of incomplete resection, 35 patients had macroscopic residual disease
(R2 resection) and 12 patients had microscopic disease
(R1 resection: positive proximal resection margin in nine
cases and positive distal resection margin in three cases).
Seventeen patient with previous cancer history (gastric
cancer in eight cases, lung cancer in four cases, laryngeal
caner in three cases, breast cancer in one cases and malignant lymphoma in one cases) were excluded. Of 12
patients excluded because of synchronous cancer, seven
patients had synchronous gastric cancers, three patients
Wu and Chen BMC Cancer (2016) 16:394
had synchronous hypopharyngeal cancers, one patient
had a synchronous laryngeal cancer, and one patient
had synchronous leukemia. Sixteen patients with nonsquamous carcinoma (adenocarcinoma in six cases,
adenosquamous carcinoma in four cases, small cell
carcinoma in four cases, and carcinosarcoma in two
cases) were also excluded. Because neoadjuvant therapy may influence postoperative pathological staging
and tumor length, patients with neoadjuvant therapy
were excluded. All of these 1435 patients received
preoperative evaluations including endoscopy with biopsy,
barium swallow examination, computerized tomography
of the chest and upper abdomen, and ultrasound of the
neck. Pulmonary and cardiac function tests were routinely
performed to assess medical operability. Recurrent laryngeal nerve palsy and the presence of clinical supraclavicular or cervical nodal involvement were considered a
contraindication for surgery. Histological diagnosis of each
of the patients was established before treatment. Written
informed consents were obtained from all patients before
surgery.
Surgical procedure
Three surgical approaches were commonly used: Ivor
Lewis procedure, cervico-thoraco-abdominal approach
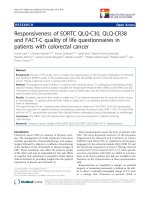
Fig. 2 Histogram of tumor length for the entire cohort of 1435 patients
Page 3 of 11
(Mckeown prodcedure), and left thoracotomy approach
(Sweet procedure). Ivor Lewis procedure and Sweet procedure with anastomosis in the chest apex were usually
performed when the tumor located in the lower and
middle segment of the esophagus. When the tumor located in the middle or upper segment of the esophagus,
Mckeown procedure with anastomosis in the left neck
was mainly conducted (Fig. 1). Meanwhile, the choice of
surgical procedure also depended on surgeons’ preferences. Two-field (mediastinal and upper abdominal)
lymph node dissection was routinely performed for all
patients. The extent of mediastinal lymph node dissection included all nodal tissue associated with
esophagus in the chest from the superior mediastinal
nodes and nodes along both recurrent laryngeal
nerves to the hiatus. The extent of upper abdominal
lymph node dissection included the paracardial, lesser
curvature, left gastric, common hepatic, celiac, and
splenic nodes. Three-field (cervical, mediastinal and
upper abdominal) lymph node dissection was not routinely performed. However, this procedure was also
performed selectively by surgeons depending on their
preference. The extent of cervical lymph node dissection included supraclavicular and cervical paraesophageal nodes.
Wu and Chen BMC Cancer (2016) 16:394
Pathological examination
After surgical resection, the esophageal specimen was
opened longitudinally from proximal to distal, extending
this incision along greater curve of stomach if attached.
The anatomical locations of the removed nodes were labeled by the operating surgeon. All specimens were fixed
in 10 % formalin overnight, unpinned. and then sent to
pathological examination. Tumor length was measured
to the closest to 1 mm. In addition to tumor length,
pathological details including histology type, differentiation, depth of invasion, lymph node status, vascular invasion, perineural involvement, the number of resected
lymph nodes as well as proximal and distal surgical resection margin were reported. Circumferential resection
margin was not routinely examined at our institution.
Data from pathological reports were reviewed retrospectively. All patients were restaged based on the 7th
edition of the American Joint Committee on Cancer
TNM staging system [3].
Follow-up
In general, a follow-up examination was performed in
our outpatient department every 3 months for the first
Page 4 of 11
2 years and 6 months thereafter. The routine follow-up
examination included a physical and routine blood examinations, blood chemistry, measurement of tumor
markers (carcinoembryonic antigen, squamous cell carcinoma antigen), radiograph of the chest, and ultrasound. Computed tomography of the chest and upper
abdomen were done every 6 months. Endoscopy was
done yearly. Survival time was defined as the period
from the date of surgery till death (including surgical
death and non-cancer related death) or the most recent
follow-up. The duration of follow-up ranged from 1 to
128 months (mean 29.8 months, median 24.0 months).
Statistical analysis
The normally distributed continuous data were described as mean ± standard deviation. Categorical data
were describes as counts and proportions. Continuous
variables were compared by student t test. The Pearson
Chi-square test was used to compare categorical variable. The survival time was calculated by the KaplanMeier method, and the log rank test was used to assess
the differences in survival between groups. To determine
an ideal cutoff value for tumor length, the relationship
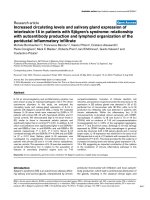
Fig. 3 Scatter plot of tumor length versus Martingale residuals for the entire cohort of 1435 patients. Patients above the horizontal line (zero)
were at increased risk for death, and those below were at decreased risk for death compared with the expected risk from Cox proportional
hazard regression model. Curved line represents scatterplot smoother. Point at which smoother line cross horizontal line occurs at 4 cm,
indicating this would be an ideal cutoff value of tumor length for these patients
Wu and Chen BMC Cancer (2016) 16:394
between tumor length and death from esophageal cancer
was investigated by using a scatter plot of the variable versus Martingale residuals from a Cox proportional hazard
regression model without the variable of interest. A
smoothed line fit of the scatter was then applied to detect
the ideal cutoff value [16]. Based on the cutoff value, the
tumor length could be treated as a categorical variable.
Univariable Cox regression models were fitted to assess
the relative effect of categorically and continuously coded
tumor length and other clinicopathological variables on
overall survival. The predictive accuracy of each clinicopathological variable was determined and was defined
as the ability to discriminate between patients who
died from cancer. The predictive accuracy was assessed
with Harrell's concordance index (C-index) [17], which is
an approximation of area under curve for time-to-event
data. A C-index of 0.5 is equal to chance discrimination
and a C-index of 1.0 represents a perfect discrimination.
Multivariable Cox proportional hazards models were
fitted to identify independent prognostic factors. A backward procedure based on the Akaike Information Criterion (AIC) was used for variable selection.
The parameters of the TNM staging system for
esophageal squamous cell carcinoma (T stage, N stage,
Grade and Location) were selected as a multivariable
base model. Predictive accuracy of the TNM staging
base model was then compared on the addition of tumor
length. Multivariate regression coefficients of the predictive variables were used to develop nomogarms. Model
performance was internally validated by measuring both
discrimination and calibration [17]. Discrimination was
evaluated by C-index as mentioned previously. Calibration
was performed by a calibration curve, in which predicted
versus actual survival are graphically depicted. Both discrimination and calibration were evaluated on this cohort
using bootstrapping with 200 resamples [17]. To assess
the clinical usefulness of prediction models, decision
curve analysis was used by visualizing the net benefits of
prediction models when different threshold probabilities
were considered [18, 19].
For all statistical tests, two sided P < 0.05 was regarded
as statistically significant. All statistical analyses were performed using SPSS version 17.0 (SPSS, Chicago, IL), and
R software version 3.1.3 ( />
Results
Cutoff value of tumor length and patients characteristics
Tumor length ranged from 0.3 to 23.0 cm (mean,
4.5 cm; median, 4.5 cm). The frequency distribution of
tumor length for the entire cohort patients was shown
in Fig. 2. Martingale residuals suggested 4 cm was an ideal
cutoff value for tumor length (Fig. 3). On the basis of this
cutoff value, patients were then divided into two groups
(≤4 cm versus > 4 cm). Comparison of clinicopathological
Page 5 of 11
characteristics between these two groups was shown in
Table 1. Tumor length > 4 cm significantly correlated with
younger age (P = 0.023), male (P < 0.001), lower location
(P = 0.01), increasing T stage (P < 0.001), worse N stage
(P < 0.001), and more resected lymph nodes (P < 0.001),
whereas no association with differentiation, vascular invasion, and perineural involvement could be found.
Univariable and multivariable analysis
Univariable analysis identified both categorically (P < 0.001)
and continuously (P < 0.001) coded tumor length were significant prognostic factors for overall survival (Table 2).
The median survival time for patients with tumor length
Table 1 Relationship between tumor length and other
clinicopathological characteristics
Variable
Tumor length
≤4.0 cm
All cases
699
736
Age (year)
58.7
57.7
Male
585
669
Female
114
67
Sex
0.023
<0.001
Tumor location
0.01
Upper
22
11
Middle
364
327
Lower
313
398
Differentiation
0.910
G1
107
107
G2
131
137
G3
461
492
T stage
<0.001
T1
166
21
T2
150
93
T3
342
540
T4
41
82
N0
376
295
N1
182
193
N2
106
170
N3
35
78
N stage
<0.001
Vascular invasion
0.429
No
578
620
Yes
121
116
No
576
585
Yes
123
151
24.0
26.5
Perineural involvement
Number of resected lymph nodes
P value
>4.0 cm
0.160
<0.001
Wu and Chen BMC Cancer (2016) 16:394
Page 6 of 11
Table 2 Univariable analysis of overall survival in 1435 patients according to clinicopathological variables
Variable
HR
95 % CI
P value
Age
1.007
0.998–1.015
0.118
Sex
52.2
51.6
Male (reference)
1
Female
0.766
0.608–0.966
0.025
Tumor location
53.2
Upper (reference)
1
Middle
1.318
0.758–2.292
0.328
Lower
1.534
0.882–2.666
0.129
Differentiation
55.4
G1 (reference)
1
G2
2.094
1.622–2.703
<0.001
G3
1.442
1.154–1.802
<0.001
T stage
60.5
T1 (reference)
1
T2
2.253
1.572–3.230
<0.001
T3
3.499
2.545–4.809
<0.001
T4
5.593
3.835–8.156
<0.001
N stage
67.1
N0 (reference)
1
N1
2.001
1.661–2.409
<0.001
N2
3.640
3.007–4.406
<0.001
N3
6.180
4.882–7.823
<0.001
Vascular invasion
51.5
No (reference)
1
Yes
1.224
1.001–1.482
0.038
Perineural involvement
53.8
No (reference)
1
Yes
1.595
1.345–1.891
<0.001
1.002
0.995–1.008
0.577
Number of resected lymph nodes
(C-index) (%)
Tumor length
50.3
56.1
≤ 4.0 cm (reference)
1
> 4.0 cm
1.582
1.368–1.830
<0.001
Tumor length*
1.121
1.088–1.155
<0.001
58.1
*tumor length treated as a continuous variable
≤ 4 cm was 48 months (95 % CI 40.8–55.2 months),
whereas for those with tumor length > 4 cm it was
27 months (95 % CI 24.3–29.7 months) (P < 0.001) (Fig. 4).
Other significant prognostic factors included sex
(P = 0.025), differentiation (P < 0.001), T stage (P < 0.001), N
stage (P < 0.001), vascular invasion (P = 0.038), and
perineural involvement (P < 0.001) (Table 2). To assess predictive accuracy for each clinicopathological variable,
C-index was calculated. Among all of the clinicopathological variables, tumor length was found to be the third
best predictor (58.1 % as a continuous variable, 56.1 % as a
categorical variable) after N stage (67.1 %) and T stage
(60.5 %) (Table 2).
In Cox multivariate analysis, variable selection based
on backward method using AIC was preformed. Both
categorically (P = 0.018) and continuously (P < 0.001)
coded tumor length were independent prognostic factors
for overall survival. Other independent prognostic factors included age, differentiation, T stage, N stage, and
number of resected lymph nodes. Sex, tumor location,
vascular invasion and perineural involvement did not
have significant impact on overall survival (Table 3).
Wu and Chen BMC Cancer (2016) 16:394
Page 7 of 11
Fig. 4 Kaplan-Meier curves depicting overall survival according to tumor length
Model comparisons
Three prediction models were built. The first was a
TNM staging base model. The second and the third
were added categorically coded and continuously coded
tumor length to the base model respectively. Results of
three multivariate regression models were listed in
Table 4. Differentiation, T stage, and N stage were independent prognostic factors in each of the three models.
Both categorically and continuously coded tumor length
reached statistical significance. Tumor location did not
reach statistical significance in each of the three models.
Three nomograms were developed for predicting overall
survival based on beta coefficients in associated models
(Fig. 5). Model performance was evaluated by internal
validated by bootstrapping. The bootstrap-corrected Cindex for TNM staging base model was 69.4 %. The
addition of categorically and continuously coded tumor
length to the TNM staging base model led to an increased bootstrap-corrected C-index of 69.6 and 69.8 %,
respectively. The calibration curves of the three prediction models were shown in Fig. 6. Each calibration curve
showed good agreement between predicted and actual
outcomes. In the decision curve analysis, three models performed similarly across a wide range threshold probabilities.
Models including tumor length (either categorically or
continuously coded) did not show any net benefit for predicting overall survival compared to the TNM staging base
model (Fig. 7).
Discussion
Tumor length was demonstrated as an independent prognostic factor for esophageal squamous cell carcinoma in
this study. This result is in agreement with some previous
studies [4–11]. But previous studies did not address the
predictive role of tumor length. Accurate prediction of
cancer prognosis is based on prediction models rather
than on a variable alone. The current TNM staging, as a
gold standard classification system to predict prognosis in
patients [2], is naturally the best option for establishing a
base prediction model. Although it is possible that a significant variable in multivariable modeling might not improve discrimination compared with a multivariable base
model, in this cohort, the addition of tumor length did
indeed increase predictive accuracy of TNM staging base
model. Categorically and continuously coded tumor
length increased discrimination of TNM staging base
model from 69.4 to 69.6 and 69.8 % respectively. However,
improved discrimination is not sufficient for a prediction
Wu and Chen BMC Cancer (2016) 16:394
Page 8 of 11
Table 3 Multivariable analysis of overall survival in 1435 patients according to clinicopathological variables
Categorical tumor length
Continuous tumor length
Variable
HR
95 % CI
P value
HR
95 % CI
P value
Age
1.011
1.002–1.019
0.014
1.010
1.002–1.019
0.015
Male (reference)
1
Female
0.896
0.908
0.715–1.155
0.342
Upper tumor (reference)
1
Middle tumor
1.150
0.660–2.005
0.622
1.169
0.671–2.038
0.581
Lower tumor
1.113
0.637–1.945
0.708
1.130
0.647–1.974
0.668
G1 (reference)
1
G2
1.503
1.153–1.959
0.003
1.516
1.163–1.976
0.002
G3
1.184
0.942–1.488
0.148
1.180
0.939–1.483
0.157
0.371
0.706–1.139
T1 (reference)
1
T2
1.708
1.182–2.649
0.004
1.666
1.153–2.406
0.006
T3
2.140
1.521–3.009
<0.001
2.081
1.483–2.919
<0.001
T4
2.781
1.855–4.171
<0.001
2.691
1.797–4.028
<0.001
N0 (reference)
1
N1
1.746
1.442–2.116
<0.001
1.716
1.416–2.078
<0.001
N2
2.974
2.422–3.652
<0.001
2.961
2.412–3.636
<0.001
N3
5.128
3.969–6.626
<0.001
5.091
3.939–6.580
<0.001
Vascular invasion
1.113
0.917–1.350
0.278
1.108
0.913–1.344
0.299
Perineural involvement
1.091
0.912–1.305
0.343
1.098
0.918–1.314
0.307
Number of resected lymph nodes
0.987
0.980–0.994
<0.001
0.987
0.980–0.994
<0.001
Tumor length
1.201
1.032–1.403
0.018
1.064
1.026–1.103
<0.001
Table 4 Cox regression models for predicting overall survival
Base model
Variable
HR
Categorical tumor length
95 % CI
P value
HR
Continuous tumor length
95 % CI
P value
1
HR
95 % CI
P value
G1 (reference)
1
G2
1.551
1.193–2.018
0.001
1.548
1.190–2.013
0.001
1
1.563
1.202–2.034
<0.001
G3
1.191
0.950–1.495
0.130
1.182
0.942–1.484
0.148
1.178
0.939–1.478
0.157
Upper tumor (reference)
1
Middle tumor
1.192
0.684–2.075
0.535
1.174
0.674–2.044
0.571
1.188
0.682–2.068
0.543
Lower tumor
1.180
0.677–2.056
0.560
1.148
0.658–2.001
0.627
1.156
0.664–2.015
0.608
1
1
T1 (reference)
1
T2
1.757
1.220–2.531
0.002
1
1.685
1.167–2.433
0.043
1
1.636
1.033–2.362
0.008
T3
2.296
1.651–3.193
<0.001
2.133
1.522–2.990
<0.001
2.067
1.478–2.892
<0.001
T4
3.066
2.070–4.544
<0.001
2.869
1.924–4.270
<0.001
2.772
1.864–4.123
<0.001
N0 (reference)
1
N1
1.717
1.418–2.079
<0.001
1.725
1.425–2.089
<0.001
1.700
1.404–2.057
<0.001
N2
2.822
2.304–3.457
<0.001
2.791
2.278–3.418
<0.001
2.777
2.268–3.402
<0.001
N3
4.705
3.670–6.032
<0.001
4.654
3.629–5.968
<0.001
4.618
3.601–5.923
<0.001
1.170
1.005–1.363
0.043
1.058
1.020–1.097
0.002
Tumor length
Bootstrap-corrected C-index (%)
69.4
1
69.6
1
69.8
Wu and Chen BMC Cancer (2016) 16:394
Page 9 of 11
Fig. 5 Nomograms based on Cox models to predict 5-year overall survival. a TNM base model; (b) model combining TNM parameters with
categorically coded tumor length; (c) model combining TNM parameters with continuously coded tumor length. Instructions: The nomogram
allows the users to obtain 5-year overall survival probability corresponding to a patient's clinicopathological characteristics. Locate the patient's
characteristic on the variable row and draw a vertical straight up to the points row to assign a value of points for the variable. Add up the total
points and drop a vertical line from the total points row to obtain 5-year overall survival
model to be clinically useful [19]. In decision curve analysis, three models resulted in similar net benefits for prediction of overall survival, which suggested inclusion of
tumor length did not increase clinical usefulness of TNM
staging system as a prediction model.
Different methods used for deciding cutoff value of
tumor length led to different cutoff values reported in
published series, ranging from 2 to 5 cm [4, 5, 7–9, 11, 12,
14, 15]. Compared to those methods, Martingale residuals
method used in this report might be more scientific because it comprehensively allows for clinicopathological
characteristics that may impact overall survival [16]. There
were also various types of tumor length used in historical
literature, such as pre-operative endoscopic tumor length
[4, 10], tumor length of fresh specimen measured in operation [5], and pathological tumor length measured after
operation [9, 12]. Tumor length may vary depending on
different measuring methods. Previous research also has
demonstrated shrinkage of tumor specimen after formalin
fixation [5, 9]. Here pathological tumor length was used
for patients undergoing radical resection because, among
all types of tumor length, it reflected the most accurate
measurement and the minimal observed variation [9, 12].
Tumor location has been included in the current staging
system for esophageal squamous cell carcinoma [3]. In the
present study, however, tumor location was not an independent prognostic factor. Many studies focusing on
prognosis of esophageal squamous cell carcinoma had
similar findings too [4, 5, 20], which supports omitting
tumor location as a parameter in the current TNM staging system. It is noteworthy that the number of resected
lymph nodes was an independent prognostic factor in
multivariable analysis. Number of resected lymph nodes
has been emphasized for its prognostic significance by
many scholars recently [12, 21, 22]. Particularly in node
negative patients number of resected lymph nodes not
only guarantees the quality of esophageal resection, but
also provides accurate staging and better prognosis.
Fig. 6 Calibration curves for internal validation of nomograms predicting 5-year overall survival. a TNM base model; (b) model combining TNM
parameters with categorically coded tumor length; (c) model combining TNM parameters with continuously coded tumor length. The x axis
nomogram-predicted probability of overall survival, and the y axis is actual survival. The diagonal line is the reference line indicating perfect
calibration. The solid line indicates performance of the current nomogram
Wu and Chen BMC Cancer (2016) 16:394
Page 10 of 11
Fig. 7 Decision curve analysis. The y axis measures net benefit, calculated by summing the benefits (true positive findings) and subtracting the
harms (false positive findings). The grey line is the net benefit for a strategy of treating all patients. The horizontal line is the net benefit of
treating no patients. Dotted line represents net benefit of using a new model. Model A, TNM base model; Model B, the model combining TNM
parameters with categorically coded tumor length; Model C, the model combining TNM parameters with continuously coded tumor length
There are a few limitations of this study. First this study
is limited to its retrospective nature in spite of data collected prospectively. Therefore these results need to be
further confirmed by a prospective study to provide a better conclusion. Second, using different surgical procedures
and different types of lymphadenctomy unavoidably leads
to a certain selection bias. Third, measuring errors may
exist in the process of pathological examination. Finally,
although bootstrap method is used for internal validation
of prediction models to obtain unbiased estimates, external validation is still needed to determine whether it can
be applied to other patient groups.
Conclusions
In conclusion, tumor length is an independent prognostic factor in patients with squamous cell carcinoma
undergoing radical resection. It increases predictive accuracy of the current TNM staging system for overall
survival. But it does not increase the clinical usefulness
of TNM staging system as a prediction model.
Additional file
Additional file 1: Datasets supporting the conclusions of this article.
(XLSX 172 kb)
Abbreviations
AIC, akaike information criterion; AJCC, American Joint Committee on Cancer;
C-index, Harrell's concordance index; TNM, tumor, node, metastasis
Acknowledgements
None.
Funding
This work did not receive funding.
Availability of data and materials
The datasets supporting the conclusions of this article are included within
the article and its Additional file 1.
Authors’ contributions
JW conceived this study, collected data, performed analysis and drafted the
manuscript. Q-XC participated in study design, literature search and
coordination and helped to draft the manuscript. Both authors read and
approved the final manuscript.
Competing interests
The authors declare that they have no competing interests.
Consent for publication
Not applicable.
Ethics approval and consent to participate
This study was approved by the institutional review board of Zhejiang
Cancer Hospital and the need for individual patient consent was waived.
Written informed consents were obtained from all patients before surgery.
Received: 30 November 2015 Accepted: 27 June 2016
Wu and Chen BMC Cancer (2016) 16:394
References
1. Jemal A, Bray F, Center MM, Ferlay J, Ward E, Forman D. Global cancer
statistics. CA Cancer J clin. 2011;61(2):69–90.
2. Sobin LH. TNM: evolution and relation to other prognostic factors.
Semin Surg Oncol. 2003;21(1):3–7.
3. Rice TW, Blackstone EH, Rusch VW. 7th edition of the AJCC cancer staging
manual: esophagus and esophagogastric junction. Ann Surg Oncol.
2010;17(7):1721–4.
4. Wang BY, Liu CY, Lin CH, Hsu PK, Hsu WH, Wu YC, Cheng CY. Endoscopic
tumor length is an independent prognostic factor in esophageal squamous
cell carcinoma. Ann Surg Oncol. 2012;19(7):2149–58.
5. Wang BY, Goan YG, Hsu PK, Hsu WH, Wu YC. Tumor length as a prognostic
factor in esophageal squamous cell carcinoma. Ann Thorac Surg.
2011;91(3):887–93.
6. Eloubeidi MA, Desmond R, Arguedas MR, Reed CE, Wilcox CM. Prognostic
factors for the survival of patients with esophageal carcinoma in the
U.S.: the importance of tumor length and lymph node status. Cancer.
2002;95(7):1434–43.
7. Gaur P, Sepesi B, Hofstetter WL, Correa AM, Bhutani MS, Watson TJ,
Swisher SG. Endoscopic esophageal tumor length: a prognostic factor for
patients with esophageal cancer. Cancer. 2011;117(1):63–9.
8. Yendamuri S, Swisher SG, Correa AM, Hofstetter W, Ajani JA, Francis A, et al.
Esophageal tumor length is independently associated with long-term
survival. Cancer. 2009;115(3):508–16.
9. Griffiths EA, Brummell Z, Gorthi G, Pritchard SA, Welch IM. Tumor length as
a prognostic factor in esophageal malignancy: univariate and multivariate
survival analyses. J Surg Oncol. 2006;93(4):258–67.
10. Davies L, Mason JD, Roberts SA, Chan D, Reid TD, Robinson M, et al.
Prognostic significance of total disease length in esophageal cancer.
Surg Endosc. 2012;26(10):2810–6.
11. Pultrum BB, Honing J, Smit JK, van Dullemen HM, van Dam GM, Groen H, et
al. A critical appraisal of circumferential resection margins in esophageal
carcinoma. Ann Surg Oncol. 2010;17(3):812–20.
12. Bollschweiler E, Baldus SE, Schroder W, Schneider PM, Holscher AH. Staging
of esophageal carcinoma: length of tumor and number of involved regional
lymph nodes. Are these independent prognostic factors? J Surg Oncol.
2006;94(5):355–63.
13. Wijnhoven BP, Tran KT, Esterman A, Watson DI, Tilanus HW. An evaluation of
prognostic factors and tumor staging of resected carcinoma of the
esophagus. Ann Surg. 2007;245(5):717–25.
14. Thompson S, Ruszkiewicz A, Jamieson G, Esterman A, Watson D,
Wijnhoven BL, et al. Improving the accuracy of TNM staging in esophageal
cancer: a pathological review of resected specimens. Ann Surg Oncol.
2008;15(12):3447–58.
15. Deeter M, Dorer R, Kuppusamy MK, Koehler RP, Low DE. Assessment of
criteria and clinical significance of circumferential resection margins in
esophageal cancer. Arch Surg. 2009;144(7):618–24.
16. Grambsch PM, Therneau TM, Fleming TR. Diagnostic plots to reveal
functional form for covariates in multiplicative intensity models.
Biometrics. 1995;51(4):1469–82.
17. Harrell Jr FE, Lee KL, Mark DB. Multivariable prognostic models: issues in
developing models, evaluating assumptions and adequacy, and measuring
and reducing errors. Stat Med. 1996;15(4):361–87.
18. Vickers AJ, Elkin EB. Decision curve analysis: a novel method for evaluating
prediction models. Med Decis Making. 2006;26(6):565–74.
19. Vickers AJ, Cronin AM, Elkin EB, Gonen M. Extensions to decision curve
analysis, a novel method for evaluating diagnostic tests, prediction models
and molecular markers. BMC Med Inform Decis Mak. 2008;8:53.
20. Yang HX, Hou X, Liu QW, Zhang LJ, Liu JG, Lin P, et al. Tumor location does
not impact long-term survival in patients with operable thoracic esophageal
squamous cell carcinoma in China. Ann Thorac Surg. 2012;93(6):1861–6.
21. Baba Y, Watanabe M, Shigaki H, Iwagami S, Ishimoto T, Iwatsuki M, et al.
Negative lymph-node count is associated with survival in patients with
resected esophageal squamous cell carcinoma. Surgery. 2013;153(2):234–41.
22. Liu Q, Tan Z, Lin P, Long H, Zhang L, Rong T, et al. Impact of the number
of resected lymph nodes on postoperative survival of patients with
node-negative oesophageal squamous cell carcinoma. Eur J Cardiothorac Surg.
2013;44(4):631–6.
Page 11 of 11
Submit your next manuscript to BioMed Central
and we will help you at every step:
• We accept pre-submission inquiries
• Our selector tool helps you to find the most relevant journal
• We provide round the clock customer support
• Convenient online submission
• Thorough peer review
• Inclusion in PubMed and all major indexing services
• Maximum visibility for your research
Submit your manuscript at
www.biomedcentral.com/submit