The genomic and transcriptomic landscape of anaplastic thyroid cancer: Implications for therapy
Bạn đang xem bản rút gọn của tài liệu. Xem và tải ngay bản đầy đủ của tài liệu tại đây (3.01 MB, 11 trang )
Kasaian et al. BMC Cancer (2015) 15:984
DOI 10.1186/s12885-015-1955-9
RESEARCH ARTICLE
Open Access
The genomic and transcriptomic landscape
of anaplastic thyroid cancer: implications
for therapy
Katayoon Kasaian1, Sam M. Wiseman2, Blair A. Walker3, Jacqueline E. Schein1, Yongjun Zhao1, Martin Hirst1,
Richard A. Moore1, Andrew J. Mungall1, Marco A. Marra1,4 and Steven JM Jones1,4,5,6*
Abstract
Background: Anaplastic thyroid carcinoma is the most undifferentiated form of thyroid cancer and one of the
deadliest of all adult solid malignancies. Here we report the first genomic and transcriptomic profile of anaplastic
thyroid cancer including those of several unique cell lines and outline novel potential drivers of malignancy and
targets of therapy.
Methods: We describe whole genomic and transcriptomic profiles of 1 primary anaplastic thyroid tumor and 3
authenticated cell lines. Those profiles augmented by the transcriptomes of 4 additional and unique cell lines were
compared to 58 pairs of papillary thyroid carcinoma and matched normal tissue transcriptomes from The Cancer
Genome Atlas study.
Results: The most prevalent mutations were those of TP53 and BRAF; repeated alterations of the epigenetic machinery
such as frame-shift deletions of HDAC10 and EP300, loss of SMARCA2 and fusions of MECP2, BCL11A and SS18 were
observed. Sequence data displayed aneuploidy and large regions of copy loss and gain in all genomes. Common regions
of gain were however evident encompassing chromosomes 5p and 20q. We found novel anaplastic gene fusions
including MKRN1-BRAF, FGFR2-OGDH and SS18-SLC5A11, all expressed in-frame fusions involving a known proto-oncogene.
Comparison of the anaplastic thyroid cancer expression datasets with the papillary thyroid cancer and normal thyroid
tissue transcriptomes suggested several known drug targets such as FGFRs, VEGFRs, KIT and RET to have lower expression
levels in anaplastic specimens compared with both papillary thyroid cancers and normal tissues, confirming the observed
lack of response to therapies targeting these pathways. Further integrative data analysis identified the mTOR signaling
pathway as a potential therapeutic target in this disease.
Conclusions: Anaplastic thyroid carcinoma possessed heterogeneous and unique profiles revealing the significance of
detailed molecular profiling of individual tumors and the treatment of each as a unique entity; the cell line sequence data
promises to facilitate the more accurate and intentional drug screening studies for anaplastic thyroid cancer.
Keywords: Anaplastic thyroid carcinoma, cell line, whole genome and transcriptome sequencing, FGFR2-OGDH fusion,
SS18-SLC5A11 fusion, MKRN1-BRAF fusion, epigenetic alterations, mTOR signaling pathway, therapy targets
* Correspondence:
1
Canada’s Michael Smith Genome Sciences Centre, British Columbia Cancer
Agency, Vancouver, British Columbia, Canada
4
Department of Medical Genetics, University of British Columbia, Vancouver,
British Columbia, Canada
Full list of author information is available at the end of the article
© 2015 Kasaian et al. Open Access This article is distributed under the terms of the Creative Commons Attribution 4.0
International License ( which permits unrestricted use, distribution, and
reproduction in any medium, provided you give appropriate credit to the original author(s) and the source, provide a link to
the Creative Commons license, and indicate if changes were made. The Creative Commons Public Domain Dedication waiver
( applies to the data made available in this article, unless otherwise stated.
Kasaian et al. BMC Cancer (2015) 15:984
Background
Anaplastic thyroid carcinoma (ATC) is an uncommon
malignancy that accounts for only 1-2 % of thyroid cancers and yet it is responsible for 14-39 % of all thyroid
cancer related deaths [1, 2]. Dedifferentiation of thyroid
follicular cells in the course of tumor evolution results in
this most aggressive form of thyroid cancer and one of the
deadliest of all adult solid malignancies with 68.4 % and
80.7 % mortality rates at 6 and 12 moths, respectively [2].
A study of 516 patients from 12 population-based cancer
registries recorded in the Surveillance, Epidemiology and
End Results database between 1973 and 2000 found that
diagnosis made before the age of 60, confined disease to
the thyroid and treatment with surgical resection and external beam radiation therapy are associated with better,
but still dismal, survival in ATC patients [2]. Though aggressive multimodal treatment strategies may achieve better survival for those patients who present with fewer
disease risks, for those with worse prognosis and extensive
local and distant involvement at diagnosis, such treatments could worsen quality of life [3]. No effective or
standard therapy for the treatment of anaplastic thyroid
cancer exists; several clinical trials involving a small number of patients have failed to demonstrate any prolonged
response and the use of chemotherapeutics such as doxorubicin and paclitaxel has not shown any significant survival benefits [2, 3]. Multikinase inhibitors have more
recently been used in the treatment of advanced and refractory thyroid cancers, and although some of these result in objective responses and can improve survival in
select patients with differentiated thyroid cancers (DTC),
the response of ATCs has been less consequential [1].
The rare occurrence of ATC and the rapid death and
short follow-ups as a result of its aggressive progression
have made it challenging to study the biology of the disease or to conduct clinical trials where responses to novel
therapies can be examined [4]. Retrospective studies of
small cohorts of patients have found anaplastic thyroid
carcinoma to be a heterogeneous disease on the molecular
level, rendering it impossible to define a common and specific route of oncogenic transformation and thus to identify effective therapeutics [5]. Mutations of various
pathways including MAPK, PI3K and Wnt have been described as potential drivers of this malignancy [5, 6]. A recent whole exome sequencing experiment also identified
repeated alterations of MAPK, ErbB and RAS signaling
pathways and described mutations in genes not previously
implicated in ATC such as mTOR, NF1, NF2, MLH1,
MLH3, MSH5, MSH6, ERBB2, EIF1AX and USH2A [7].
Alterations of MAPK and PI3K pathways are shared with
the less lethal DTCs, suggesting their progression to ATC
through step-wise accumulation of mutations and tumor
evolution [4]; however, dedifferentiation of preexisting benign nodules and DTCs are not the only means of disease
Page 2 of 11
development and at least a subset of ATCs may arise de
novo [5].
Tumor-derived cell lines provide an alternative to
studying patient specimens when profiling rare tumors
and these can facilitate the investigation of therapeutic
effectiveness in pre-clinical settings. Schweppe and colleagues have reported on cross-contamination and mislabeling concerns in 40 % of thyroid cancer cell lines
that have been used in over 200 published studies [8, 9].
They have clearly emphasized the need for detailed
characterization of all thyroid-derived, including ATCderived, cell lines. In this study, we describe the genomic
and transcriptomic profiles of 1 primary ATC and 3 authenticated anaplastic thyroid cancer cell lines [9]. Those
profiles augmented by the transcriptomes of 4 additional
and unique cell lines [8] were compared to 58 pairs of
papillary thyroid carcinoma (PTC) and matched normal
tissue transcriptomes from The Cancer Genome Atlas
(TCGA) study [10]. To the best of our knowledge, this is
the first report of whole genome and transcriptome analyses of anaplastic thyroid cancer, allowing for the identification of regions of copy number alteration and large
structural events at the base level resolution.
Methods
Study specimens
Excision biopsy of a primary and treatment-naive anaplastic thyroid carcinoma tumor and peripheral blood
sample were collected from a 63-year old male at the
time of palliative thyroidectomy; the patient lacking
prior personal or family history of thyroid disease or
cancer and radiation exposure presented with lung metastasis. He provided written informed consent for the
complete genomic profiling of his specimens; these were
collected as part of a research project approved by the
British Columbia Cancer Agency’s Research Ethics Board
and are in accordance with the Declaration of Helsinki.
In addition, 3 authenticated ATC cell lines, THJ-16T,
THJ-21T and THJ-29T [9], obtained from the Mayo
Clinic (Jacksonville, FL) and 4 unique cell lines [8],
ACT-1 and T238 from Dr. R. Schweppe at the University of Colorado (Denver, Colorado) and C643 and
HTh7 from Dr. N.E. Heldin at the Karolinska Institute
(Uppsala, Sweden), were evaluated in this study.
Library preparation and sequencing
DNA from the ATC tumor, the matched peripheral
blood specimen, and THJ-16T, THJ-21T and THJ-29T
cell lines were subjected to whole genome sequencing;
100 bp paired-end sequence reads were generated on
Illumina HiSeq2500 instruments following the manufacturer’s protocol with minor variations. In addition, 75 bp
paired-end transcriptome sequence reads were produced
for the tumor and all 7 cell lines. The aligned sequence
Kasaian et al. BMC Cancer (2015) 15:984
datasets have been deposited at the protected European
Genome-phenome Archive (EGA, />ega/) under accession number EGAS00001001214.
Library construction and sequencing protocols are
detailed in the supplementary material.
Page 3 of 11
employing ABySS and Trans-ABySS [13] and the
alignment-based SV detection tool Minimum Overlap
Junction Optimizer (MOJO) ( />MOJO).
Results
Sequence data analysis
Single nucleotide variants and indels
Sequence reads from the whole genome libraries were
aligned to the human reference genome (build GRCh37)
using the Burrows-Wheeler Alignment (BWA) tool [11].
The tumor’s genomic sequence was compared to that of
patient’s constitutive DNA to identify somatic alterations. Regions of copy number variation (CNV) and
loss of heterozygosity (LOH) were determined using
Control-FREEC [12]. De novo assembly and annotation
of genomic data using ABySS and Trans-ABySS [13]
were used to identify small insertions and deletions
(indels) and larger structural variants (SVs) including
translocations, inversion and duplications leading to
gene fusions; identified SVs were verified using an orthogonal alignment-based detection tool, BreakDancer
[14]. Single nucleotide variants (SNVs) and indels in the
tumor/normal pair were identified using a probabilistic
joint variant calling approach utilizing SAMtools and
Strelka [15, 16]. Variants in the unpaired cell line genomic data were identified using SAMtools [15]; the indel
lists for these samples were refined to include only those
events that were also called through de novo assembly.
Sequence reads from the transcriptome libraries were
aligned to the human reference genome (build GRCh37)
using TopHat [17] with Ensembl gene model annotation
file on the -G parameter. The reference sequence and
the corresponding annotation files were provided by
Illumina’s iGenome project and downloaded from the
TopHat homepage ( />igenomes.shtml). Quantification of gene expression was
accomplished using HTSeq [18] in intersectionnonempty mode and excluding reads with quality less
than 10, all subsequent analyses were run using only the
count values for the protein-coding elements. Fifty-eight
pairs of papillary thyroid carcinoma and matched normal tissue transcriptomes from The Cancer Genome
Atlas project [10] were used for differential gene expression analysis. To ensure consistent analysis, raw sequence reads were downloaded from the Cancer
Genome Hub and processed using the analysis pipeline
described above. Protein-coding gene read counts were
used as input into the R package edgeR [19] for differential gene expression analysis. Single-sample gene set enrichment analysis (ssGSEA) [20] was performed for each
of the 8 transcriptomes to elucidate the oncogenic profiles enriched in each library when compared with normal thyroid tissue expression profiles. Structural variants
were identified using de novo assembly-based approach
Twenty-four somatic SNVs and indels were identified in
the tumor’s genome including heterozygous BRAF
p.V600E and TP53 p.Y163C mutations. All three cell
lines had TP53 homozygous nonsense or missense mutations with known pathogenic alleles. Other variants related to tumor biology included a homozygous BRAF
p.V600E mutation in THJ-21T and heterozygous and
homozygous frame-shift deletions of HDAC10
(p.H134Tfs) and CDKN2A (p.Q70Sfs), respectively, in
THJ-29T. Additionally, THJ-16T harbored a heterozygous activating mutation in PIK3CA (p.E545K), a variant
of unknown significance in RET (p.E90K) and a homozygous frame-shift deletion (p.S799Ffs) in EP300. Alterations of TP53 and BRAF were the only recurrent events
and no mutations of the previously described ATC genes
including H-, K-, N-RAS, CTNNB1, IDH1, ALK, PTEN,
APC, or AXIN1 [6, 7, 21] were identified in these specimens. This is likely due to a small number of samples
examined here and the infrequent mutations of these
genes in the overall ATC population [6]. All identified
protein-coding variants are listed in the Additional file 1.
Copy number variants
Evaluation of the copy number status and single nucleotide allele frequencies of the genomic data revealed extensive regions of gene copy loss and gain
and the presence of triploid genomes in all 4 samples
(Fig. 1), consistent with previous observations of aneuploidy in the majority of ATCs [22]. Large-scale
copy number changes have also been described in
ATCs [1] and are a hallmark of the progression from
the mostly “quiet” differentiated cancers [10] to the
aggressive and lethal ATCs. Although the tumor and
the cell lines showed variable regions of copy number
alterations, a 26 Mb minimal region on 5p, encompassing 196 genes, and the long arm of chromosome
20 showed gain of extra gene copies in all samples
(Fig. 1). High-level and recurrent amplifications of 5p
and chromosome 20 have been reported in studies
utilizing comparative genomic hybridization in studying ATCs [21] indicating that genes located in these
regions might play an important role in ATC tumor
initiation and/or progression. The 5p region includes
proto-oncogenes such as FGF10 and SKP2, mTOR
signaling pathway members RICTOR and PRKAA1, in
addition to IL7R, OSMR, LIFR, PRLR and GHR, all
receptors involved in JAK-STAT and the downstream
Kasaian et al. BMC Cancer (2015) 15:984
Page 4 of 11
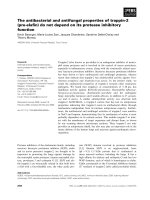
Fig. 1 Regions of copy number variation and loss of heterozygosity. A circos plot depicting, from the outer ring inward, tumor CNV, THJ-29T CNV,
THJ-21T CNV, THJ-16T CNV, tumor LOH, THJ-29T LOH, THJ-21T LOH and THJ-16T LOH. Red and blue CNV regions illustrate the regions of copy
gain and loss, respectively. The LOH tracks illustrate the B Allele Frequencies (BAF) ranging from 0.5 to 1. Those regions with BAF > = 0.9 are
highlighted in blue. Regions of 5p and 20q showed recurrent copy gain in all samples
PI3K-Akt pathways. Anti-apoptotic and cell cycle
genes BCL2L1, YWHAB, E2F1 and AURKA, protooncogenes PLCG1 and STK4 and chromatin remodeling genes ASXL1, CHD6 and DNMT3B have all
gained extra copies through the amplification of 20q.
Noteworthy observations of copy number change included the presence of 15 copies of each of KDR/
VEGFR1, KIT and PDGFRA in a region of focal amplification on chromosome 4 in THJ-29T cell line. THJ-21T
showed a region of high amplification on chromosome
11 leading to the accumulation of 25 copies of each of
BIRC2, BIRC3, MMP1/3/7/8/10/13/27 and YAP1; this
cell line also had a complete loss of a small region on
chromosome 9 encompassing SMARCA2, a member of
the SWI/SNF complex, and GLIS3, a transcription factor implicated in the development and normal functioning of the thyroid (Additional file 2: Figure S1). Proteincoding genes with changes in copy number and their
referred copy numbers from the sequence data are listed
in the Additional file 1.
Kasaian et al. BMC Cancer (2015) 15:984
Page 5 of 11
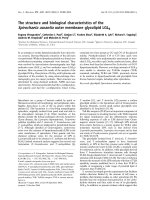
Fig. 2 Somatic structural variants in ATC genomes and transcriptomes a. Structural variants identified in the genomic and transcriptomic datasets
b. Detailed structure of the potentially oncogenic fusions: SS18 (transcript: ENST00000415083)/SLC5A11 (transcript: ENST00000347898) fusion in the
tumor, MKRN1 (transcript: ENST00000255977)/BRAF (transcript: ENST00000288602) fusion in THJ-16T cell line and FGFR2 (transcript:
ENST00000358487)/OGDH (transcript: ENST00000222673) fusion in THJ-29T cell line
Structural variants
The study specimens were found to have anywhere
between 1 to 32 structural variants (Fig. 2a and
Additional file 1). Expressed in-frame gene fusions
involving at least one proto-oncogene have been described in various cancers and are shown to be the
driver of malignant phenotype, at times as the only
such event in the tumor. We identified instances of
these fusions in the genomes of THJ-16T and THJ29T cell lines and the tumor (Fig. 2b). These included an MKRN1-BRAF fusion in THJ-16T; the fusion product has lost the N terminal regulatory
region of BRAF while retaining its kinase domain,
hence likely leading to the constitutive activation of
the kinase. A fusion of these two genes was also
found in 1 TCGA PTC sample (0.2 % population frequency) [10]. A reciprocal fusion between chromosomes 7 and 10 led to an in-frame fusion of FGFR2
and OGDH in THJ-29T, retaining the growth factor
receptor’s kinase domain. Two TCGA PTC cases
were also reported to have FGFR2 gene fusions with
VCL and OFD1 as partners [10]. FGFR2 is found
fused to various genes in different cancers where the
fusion partners facilitate its constitutive activation
through providing dimerization domains [23]. Sensitivity to FGFR inhibitors have been observed in patients harboring FGFR2 fusions with the same
breakpoint as that found in the THJ-29T ATC cell
line [23] and thus testing for these fusions might
provide a tractable therapeutic option for a subset of
patients diagnosed with anaplastic thyroid cancer.
We also identified a translocation between chromosomes 16 and 18 in the tumor, fusing the protooncogene SS18 and SLC5A11. SS18 (also known as
SYT) is commonly found fused to one of SSX1,
SSX2 or SSX4 in synovial sarcomas [24]. In addition
to the above potentially oncogenic fusions, gene
members of the axon guidance pathway, recurrently
Kasaian et al. BMC Cancer (2015) 15:984
A
Page 6 of 11
B
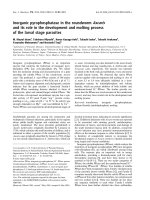
Fig. 3 Transcriptomic analysis of ATCs a. The expression levels (RPKM = reads per kilobase per million mapped reads) of select genes in the TCGA
and ATC specimens are plotted. Median, first and third quartile values are marked for each distribution b. Samples were ordered on the basis of
pathology and 1647 significantly expressed genes in 58 TCGA normal thyroid tissue transcriptomes, 58 TCGA papillary thyroid cancer
transcriptomes and 8 anaplastic thyroid cancer transcriptomes were clustered
altered in pancreatic cancer [25], were also found to
be involved in multiple fusions: CADM2-EPHA3 fusion in the tumor’s genome, fusion of chromosome
19 to SLIT1 on chromosome 10 in the THJ-21T
genome and SRGAP3-SETD5 fusion in THJ-29T
(Additional file 1).
Analysis of differential transcript abundance
Despite the heterogeneous molecular profile of ATCs
evident from the lack of commonly mutated genes and
oncogenic fusions, the transcriptomic analysis of the
tumor and all 7 cell lines showed consistent up- and
down-regulation of several genes when compared to the
compendium of normal thyroid tissue transcriptomes.
Overexpressed genes included focal adhesion, cytoskeleton and ECM-receptor interaction pathway genes such
as ITGA3, ITGB1, FLNA, ACTN1, and CD44 indicating
alterations of genes involved in regulation of normal cell
shape and migration. Cancer-related genes with significant up-regulation in all ATCs included MYC, mTOR,
PRKCA and TGFB1 (Fig. 3a). The down-regulated genes
included thyroid differentiation signature genes such as
TG, TTF1, TSHR and TPO (Additional file 2: Figure S2)
in addition to the tumor suppressor FHIT. Genes
believed to be cancer drivers and to serve as drug targets
in other malignancies showed consistent downregulation in anaplastic thyroid cancer; these included
ERBB4, NTRK2, FGF7 and MAPK10 (Additional file 2:
Figure S3). Differential gene expression analysis of the
ATC cohort against the TCGA normal transcriptomes
using edgeR found 840 and 574 genes to be down- and
up-regulated in ATCs, respectively (Benjamini-Hochberg
P< 0.05 and fold change >4 or <-4); similar analysis
yielded 605 and 419 down- and up-regulated genes in
ATCs when compared to PTCs. Pathway analysis of
these differentially expressed genes showed ECMreceptor interaction, focal adhesion, endocytosis, cell
cycle, p53 signaling, ErbB signaling and general cancer
pathways to be up regulated in ATCs. Common downregulated networks included tight junctions, cell adhesion molecules and various metabolism pathways
(Fig. 3b). Single-sample gene set enrichment analysis
pointed to a potential role of epigenomic deregulation in
ATCs where the top signatures enriched with over- and
under-expressed ATC genes included genes that were
up- and down-regulated, respectively, upon knockdown
of BMI1 or PCGF2, both members of the Polycomb
group [26] (Fig. 4).
Discussion
Anaplastic thyroid cancer is an extremely aggressive malignancy with dismal prognosis that has had little change
in its 4-month median survival rate over the past 50
years [21]. Similar to the case we genomically profiled,
the majority of ATC patients present with a rapidly
growing neck mass often causing dyspnea, dysphagia
and at times vocal cord paralysis [27]. The extremely
poor prognosis of ATC is reflected by the current
American Joint Committee on Cancer staging system for
thyroid cancer in which individuals with anaplastic
Kasaian et al. BMC Cancer (2015) 15:984
Page 7 of 11
Fig. 4 Single-sample gene set enrichment analysis (ssGSEA). ssGSEA was performed for all 8 transcriptome libraries using fold changes in
expression of each gene (ATC expression/average expression in 58 normal libraries) in order to identify enriched oncogenic signatures. Top 20 %
most enriched signatures that were shared in two or more libraries are plotted. The molecular signatures enriched with up- and down-regulated
ATC genes included genes that were up- and down-regulated upon knockdown of BMI1 or PCGF2 or both genes [26]. Standard names of the
oncogenic signature gene sets from the MSigDB are listed below the plot
histopathology, regardless of extent of disease, are classified as having stage IV disease [2]. There are currently
no standard therapies for the treatment of anaplastic
thyroid cancer as its rarity and rapidly fatal course have
made it difficult to study large cohorts of patients and to
conduct randomized clinical trials [28]. Doxorubicin is
the most commonly used chemotherapeutic agent for
the treatment of progressive and metastatic ATC, but
has little impact on survival, with a partial response
rate estimated to be 10-30%; if administered in combination with cisplatin, it may have slightly higher efficacy [28, 29]. Multimodal treatments comprised of
surgical resection, external beam radiation therapy
and systemic therapy have been associated with increased survival in some patients [1] though often
only effective in managing uncommonly diagnosed localized ATCs [30]. Individual responses to targeted
therapies including multi-kinase inhibitors have been
reported [31–33], however, no single agent has shown
significant improvement in progression-free survival
in the setting of a clinical trial and thus none has
gained approval for routine clinical use. Phase II trials
of pazopanib [34], imatinib [35], gefitinib [36], axitinib [37] and sorafenib [38, 39] in small patient cohorts showed limited or negligible activity. This is
despite some of these agents, such as sorafenib,
resulting in objective response and receiving approval
for the treatment of advanced DTCs.
The important role of increased endothelial cell proliferation and angiogenesis in thyroid cancer progression
and maintenance is well recognized [37], and consequently the majority of the tested compounds are aimed
at blocking these signaling pathways. The expression of
some of the intended targets of these drugs by our ATC
specimens, and the 58 pairs of PTC and normal thyroid
tissues, are depicted in the Additional file 2: Figures S2
and S3. The majority of these drug targets, including
FGFR1, 2, 3 and 4, VEGFR1, 2 and 3, PDGFRA,
PDGFRB, KIT and RET, show similar or lower expression
in ATCs compared with both normal tissues and PTCs.
The extent of messenger RNA expression might not be
an accurate estimate of the protein level in the cell, and
over-activation of a kinase is not captured on the transcript level, nonetheless, mRNA is an intermediary information molecule and its amount in the cell serves as a
surrogate for protein expression levels. Based on the
current differential mRNA expression analysis none of
the multi-kinase inhibitors with observed response in
DTCs would have an effect on the survival of ATC patients; this is in agreement with the failure of all tested
compounds to date and has implications in the development of future clinical trials. Lenvatinib has recently
gained approval for the treatment of refractory DTCs,
but the first described trial for its use in the treatment of
9 ATC patients showed only a median progression-free
survival of 5.5 months [40]. We predict, based on the
Kasaian et al. BMC Cancer (2015) 15:984
current study, that lenvatinib would not result in prolonged response in ATCs given the lower expression of
all its targets (vascular endothelial growth factor receptors 1,2, and 3, fibroblast growth factor receptors 1, 2, 3
and 4, platelet-derived growth factor receptor alpha,
RET and KIT) in ATC specimens (Additional file 2:
Figure 3). Generally, inhibitors of growth factors and
their receptors appear to have a very limited effect on
the survival of ATC patients. A similar lack of inefficacy
is also found when using vascular disrupting agents. A
single agent trial of the fosbretabulin (also known as
combretastatin A-4 phosphate) or its combination use
with carboplatin/paclitaxel in a cohort of patients, although showed some clinical activity, had no effect on
progression-free survival [41, 42].
Analysis of genomic and transcriptomic datasets in
this study allowed for identification of potential new
drug targets. TRIP13 has gained extra copies in all specimens as a result of the 5p gain described above. This
gene and its binding partner PRKDC promote nonhomologous end joining (NHEJ) in cancer cells resulting
in chemoresistance in head and neck malignancies
where inhibitors of NHEJ, such as Nu7026, are believed
to re-sensitize cells to cisplatin [43]. Both TRIP13 and
PRKDC show very high expression in the ATCs we studied and could serve as novel targets for therapy. The
mTOR signaling pathway is also a putative target and inhibitors such as everolimus may show efficacy in ATC.
Mutations of the pathway genes including mTOR and
the tumor suppressor TSC2 have been previously described in ATC [7, 31] and a dramatic and longlasting response to everolimus in an ATC patient with
a truncating mutation in TSC2 was reported [31].
Though no mutations were identified in the current
study, a high level expression of mTOR and its downstream effector HIF1A was observed, thus raising the
possibility for the use of mTOR inhibitors (Fig. 3a).
Overexpression of mTOR or loss of TSC2, its negative
regulator, through promoting the transcriptional level
of HIF1A leads to increased angiogenesis that is sensitive to rapamycin treatment [44]. Given that overexpression of vascular growth factor receptors are not
likely to directly lead to increased angiogenesis in
ATCs, mTOR signaling emerges as a key angiogenesis
driving pathway in this cancer. The effect of everolimus on 5 ATC cell lines including HTh7 and C643
were tested by Papewalis and colleagues [45]. They
found that both cell lines responded to therapy with
HTh7 exhibiting a much higher sensitivity when compared to known responding lymphoma cell lines. Prior
to embarking on clinical trials, further in vitro and in
vivo studies are needed to elucidate the mechanism of
response and resistance to targeted therapeutics such
as mTOR inhibitors.
Page 8 of 11
Tumor genomes frequently show a vast amount of
copy number change and aneuploidy. As these can be
the side effect of the altered cell cycle machinery and
disease progression rather than its driver(s), all copy
number changes may not contribute to changes in gene
expression levels. Integrative analysis of CNV and expression datasets thus allowed for the identification of
correlated changes of these variations in all 4 specimens.
Cell cycle kinase AURKA and the transcription factor
E2F1, both located on chromosome 20 with gain of copies, also showed overexpression providing additional evidence for the deregulation of cell cycle control in ATCs.
Overexpression of aurora kinase A is believed to be the
cause of vast chromosomal abnormalities in ATCs given
its key regulatory role in mitotic cell division, chromosome segregation and cytokinesis through association
with centrosomes and the mitotic spindle [5, 30]. Several
investigational drugs with inhibitory effect on AURKA
are under study and these might serve as promising
therapeutics in ATCs. It is however imperative to demonstrate the high expression of these kinases as the
driver of malignancy rather than just a by-product of the
high rate of cell division in cancers particularly ATCs
[27]. Similarly, tissue transglutaminase gene (TGM2) has
gained extra copies in all samples and also shows overexpression compared with normal thyroid tissue and
PTCs. Over-activation of TGM2 in ATCs correlates with
its observed over-expression in pancreatic cancer, another aggressive human malignancy with mortality rates
close to 100%. TGM2 over-expression leads to tissue invasion, metastasis and chemotherapeutic resistance in
cancers of the pancreas [46] and is shown to protect
these cancer cells from autophagy leading to growth advantage and resistance to chemotherapy [46]. TGM2
may as a result serve as a direct drug target where its
blockage leads to autophagic cell death.
A successful evolutionary history for cancer requires
rapid and dynamic changes in the blueprint of the cell.
Through providing a larger pool of possible mutational
targets, recurrent hits to specific cellular machineries or
pathways, rather than the same gene, can accelerate the
success of the cancer in overcoming its host defenses.
We found alterations of the epigenetic machinery in all
4 ATC specimens with genome sequence data. A translocation of SS18, a member of SWI/SNF complex [47] in
the tumor, homozygous frame-shift deletion in the histone acetyltransferase EP300 and a fusion of methyl
CpG binding protein MECP2 and F8 in THJ-16T cell
line, complete loss of SMARCA2, another member of
the SWI/SNF complex and interacting partner of SS18
[47], in THJ-21T, a heterozygous frame-shift deletion in
the histone deacetylase HDAC10 and a gene fusion of
the transcriptional repressor and member of the SWI/
SNF complex BCL11A [47] and GRIP2 in THJ-29T.
Kasaian et al. BMC Cancer (2015) 15:984
SS18 is a subunit of the SWI/SNF complex [47] and
hence plays a major role in transcriptional regulation of
the cell. It also interacts with various members of chromatin remodeling complexes such as SMARCA2,
SMARCA4 [24] and EP300 [48] through its conserved
N-terminal SNH domain that is found to be indispensible for the transforming ability of SS18-SSX oncoprotein [24]. Although the fusion partner, SLC5A11, is
distinct from that observed in sarcomas, it is likely that
this fusion has transforming potential in ATCs. Only the
last 8 residues of SS18 are deleted in its fusion to SSX
genes and the mere deletion of these same 8 amino acids
in the absence of a fusion partner was shown to disrupt
the normal function of the protein [48]. Loss of SS18 Cterminal might be sufficient for tumorigenesis or that a
yet unknown function of SLC5A11 may lead to the malignant transformation. The FGFR2-OGDH fusion in
THJ-29T is, in addition to the involvement of the
growth factor receptor, intriguing considering the role of
OGDH in the control of metabolism and cellular epigenetic state. OGDH is a metabolic enzyme of the tricarboxylic acid (TCA) cycle and a subunit of the complex
which converts 2-oxoglutarate, product of IDH, to succinate, substrate of SDH. Mutations of IDH1 and IDH2 as
well as those in SDH have been observed in numerous cancers and found to cause global epigenetic changes in the
tumor [49, 50]. 2-oxoglutarate is required for the normal
functioning of chromatin-modifying enzymes such as UTX,
JARID1C and TET2 [50] and succinate acts as an inhibitor
of DNA and histone demethylases [49]; changes in their
cellular concentration as a result of OGDH translocation
can in turn alter the epigenomic state of ATC cells. Further
evidence for the potential role of epigenomic deregulation
in ATC came from single-sample GSEA. Top 20% most
enriched oncogenic signatures in each of the 8 transcriptome libraries were identified and those shared in two or
more libraries are plotted in Fig. 4. Top signatures enriched
with over- and under-expressed ATC genes included genes
that were up- and down-regulated, respectively, upon
knockdown of BMI1 or PCGF2 or both genes [26].
BMI1 and PCGF2 are members of the Polycomb
group of transcriptional regulators which control the
expression of, among others, genes involved in ECM
remodeling, cell adhesion and integrin-mediated
signaling pathways [26], all of which demonstrated
deregulation in ATCs. It is conceivable that understanding the effect of epigenetic changes in anaplastic
thyroid cancer could pave the way for the development and application of novel therapeutics in this
aggressive solid tumor. Histone deacetylase inhibitor
valproic acid, for instance, increases the effect of both
doxorubicin and paclitaxel in ATC cells [21] providing in vitro experimental evidence for a driving role
of deregulated epigenetic control in ATC.
Page 9 of 11
Conclusions
In this study, we profiled the molecular alterations of several anaplastic thyroid carcinoma specimens including
unique and authenticated ATC cell lines. This study is
underpowered in drawing general conclusions for this
cancer given the availability of only one primary tumor
and the often-observed distinct profiles of cell lines and
patient specimens. Given the heterogeneous genomic profiles of these samples and the low frequency of recurrent
mutations, studies involving larger cohorts of cases
through multi-institutional collaborations are required to
identify genes at the “long tail” of the mutational
spectrum, and to decipher the underlying biology of the
disease. Furthermore, lack of common targetable oncogenic mutations, observed responses to targeted therapies
in other cancer types harboring the same aberrations as
those found in at least a small subset of ATCs [23],
and clinical responses to targeted therapies described
in individual ATC patients [31–33] calls for a more
genotype-driven approach to diagnosis and treatment
of this rare and rapidly fatal cancer. With recent advances in molecular and information technology alike,
it is anticipated that sequencing-based clinical tests
provide the ability to comprehensively assay the large
number of diverse and complex mutational forms that
can arise, hence facilitating routine application of precision oncology in the clinic.
Availability of data and materials
The aligned sequence datasets have been deposited at the
protected European Genome-phenome Archive (EGA,
under accession number
EGAS00001001214.
Additional files
Additional file 1: Supplementary tables listing the identified mutations,
copy number variations and structural events. (XLSX 2590 kb)
Additional file 2: Supplementary file outlining the detailed sequencing
methodology and additional figures. (DOCX 434 kb)
Abbreviations
ATC: Anaplastic thyroid carcinoma; BWA: Burrows-Wheeler alignment;
CNV: Copy number variation; DTC: Differentiated thyroid cancer; LOH: Loss of
heterozygosity; MOJO: Minimum overlap junction optimizer; PTC: Papillary
thyroid cancer; SNV: Single nucleotide variant; ssGSEA: Single-sample gene
set enrichment analysis; SV: Structural variant; TCA: Tricarboxylic acid;
TCGA: The cancer genome atlas.
Competing interests
Authors declare no conflict of interest.
Authors’ contributions
KK performed data analysis, generated figures and wrote manuscript. SMW
performed surgery. BAW provided pathology review. JES, YZ, MH, RAM and
AJM collected specimen, constructed sequencing libraries and performed
sequencing experiments. SMW, MAM and SJMJ conceived and designed
study. All authors read and approved the manuscript.
Kasaian et al. BMC Cancer (2015) 15:984
Acknowledgments
We are greatly indebted to the patient for his participation in this study. We
would like to thank Karen Mungall for providing support in the assembly
process and to acknowledge the contribution of the Genome Sciences
Centre biospecimen, library construction and sequencing cores to this work.
This study was funded by the Canadian Cancer Society Research Institute
grant #2010-700329. KK is a recipient of the doctoral fellowship from the
Canadian Institutes of Health Research. MAM is UBC Canada Research Chair
in Genome Science.
Author details
1
Canada’s Michael Smith Genome Sciences Centre, British Columbia Cancer
Agency, Vancouver, British Columbia, Canada. 2Department of Surgery, St.
Paul’s Hospital and University of British Columbia, Vancouver, British
Columbia, Canada. 3Department of Pathology and Laboratory Medicine, St.
Paul’s Hospital and University of British Columbia, Vancouver, British
Columbia, Canada. 4Department of Medical Genetics, University of British
Columbia, Vancouver, British Columbia, Canada. 5Department of Molecular
Biology and Biochemistry, Simon Fraser University, Burnaby, British Columbia,
Canada. 6570 West 7th Ave, Vancouver, British Columbia V5Z 4S6, Canada.
Received: 24 August 2015 Accepted: 25 November 2015
References
1. Smallridge RC, Ain KB, Asa SL, Bible KC, Brierley JD, Burman KD, et al.
American Thyroid Association guidelines for management of patients with
anaplastic thyroid cancer. Thyroid. 2012;22(11):1104–39.
2. Kebebew E, Greenspan FS, Clark OH, Woeber KA, McMillan A. Anaplastic
thyroid carcinoma. Treatment outcome and prognostic factors. Cancer.
2005;103(7):1330–5.
3. Sugitani I, Miyauchi A, Sugino K, Okamoto T, Yoshida A, Suzuki S. Prognostic
factors and treatment outcomes for anaplastic thyroid carcinoma: ATC Research
Consortium of Japan cohort study of 677 patients. World J Surg.
2012;36(6):1247–54.
4. Wiseman SM, Loree TR, Hicks Jr WL, Rigual NR, Winston JS, Tan D, et
al. Anaplastic thyroid cancer evolved from papillary carcinoma:
demonstration of anaplastic transformation by means of the intersimple sequence repeat polymerase chain reaction. Arch Otolaryngol
Head Neck Surg. 2003;129(1):96–100.
5. Ragazzi M, Ciarrocchi A, Sancisi V, Gandolfi G, Bisagni A, Piana S. Update on
anaplastic thyroid carcinoma: morphological, molecular, and genetic features
of the most aggressive thyroid cancer. Int J Endocrinol. 2014;2014:790834.
6. Xing M. Molecular pathogenesis and mechanisms of thyroid cancer. Nat
Rev Cancer. 2013;13(3):184–99.
7. Kunstman JW, Juhlin CC, Goh G, Brown TC, Stenman A, Healy JM, et al.
Characterization of the mutational landscape of anaplastic thyroid cancer
via whole-exome sequencing. Hum Mol Genet. 2015.
8. Schweppe RE, Klopper JP, Korch C, Pugazhenthi U, Benezra M, Knauf JA, et
al. Deoxyribonucleic acid profiling analysis of 40 human thyroid cancer cell
lines reveals cross-contamination resulting in cell line redundancy and
misidentification. J Clin Endocrinol Metab. 2008;93(11):4331–41.
9. Marlow LA, D'Innocenzi J, Zhang Y, Rohl SD, Cooper SJ, Sebo T, et al.
Detailed molecular fingerprinting of four new anaplastic thyroid carcinoma
cell lines and their use for verification of RhoB as a molecular therapeutic
target. J Clin Endocrinol Metab. 2010;95(12):5338–47.
10. Cancer Genome Atlas Research Network. Electronic address:
, Cancer Genome Atlas Research Network:
Integrated genomic characterization of papillary thyroid carcinoma. Cell.
2014;159(3):676–90.
11. Li H, Durbin R. Fast and accurate long-read alignment with BurrowsWheeler transform. Bioinformatics. 2010;26(5):589–95.
12. Boeva V, Popova T, Bleakley K, Chiche P, Cappo J, Schleiermacher G, et al.
Control-FREEC: a tool for assessing copy number and allelic content using nextgeneration sequencing data. Bioinformatics. 2012;28(3):423–5.
13. Simpson JT, Wong K, Jackman SD, Schein JE, Jones SJ, Birol I. ABySS: a parallel
assembler for short read sequence data. Genome Res. 2009;19(6):1117–23.
14. Chen K, Wallis JW, McLellan MD, Larson DE, Kalicki JM, Pohl CS, et al.
BreakDancer: an algorithm for high-resolution mapping of genomic structural
variation. Nat Methods. 2009;6(9):677–81.
Page 10 of 11
15. Li H, Handsaker B, Wysoker A, Fennell T, Ruan J, Homer N, et al. The Sequence
Alignment/Map format and SAMtools. Bioinformatics. 2009;25(16):2078–9.
16. Saunders CT, Wong WS, Swamy S, Becq J, Murray LJ, Cheetham RK.
Strelka: accurate somatic small-variant calling from sequenced tumornormal sample pairs. Bioinformatics. 2012;28(14):1811–7.
17. Kim D, Pertea G, Trapnell C, Pimentel H, Kelley R, Salzberg SL. TopHat2:
accurate alignment of transcriptomes in the presence of insertions, deletions
and gene fusions. Genome Biol. 2013;14(4):R36. -2013-14-4-r36.
18. Anders S, Pyl PT, Huber W. HTSeq–a Python framework to work with
high-throughput sequencing data. Bioinformatics. 2015;31(2):166–9.
19. Robinson MD, McCarthy DJ, Smyth GK. edgeR: a Bioconductor package
for differential expression analysis of digital gene expression data.
Bioinformatics. 2010;26(1):139–40.
20. Subramanian A, Tamayo P, Mootha VK, Mukherjee S, Ebert BL, Gillette
MA, et al. Gene set enrichment analysis: a knowledge-based approach
for interpreting genome-wide expression profiles. Proc Natl Acad Sci U
S A. 2005;102(43):15545–50.
21. Smallridge RC, Marlow LA, Copland JA. Anaplastic thyroid cancer: molecular
pathogenesis and emerging therapies. Endocr Relat Cancer. 2009;16(1):17–44.
22. Wiseman SM, Loree TR, Rigual NR, Hicks Jr WL, Douglas WG,
Anderson GR, et al. Anaplastic transformation of thyroid cancer:
review of clinical, pathologic, and molecular evidence provides new
insights into disease biology and future therapy. Head Neck. 2003;
25(8):662–70.
23. Borad MJ, Champion MD, Egan JB, Liang WS, Fonseca R, Bryce AH, et
al. Integrated genomic characterization reveals novel, therapeutically
relevant drug targets in FGFR and EGFR pathways in sporadic
intrahepatic cholangiocarcinoma. PLoS Genet. 2014;10(2):e1004135.
24. Nagai M, Tanaka S, Tsuda M, Endo S, Kato H, Sonobe H, et al.
Analysis of transforming activity of human synovial sarcomaassociated chimeric protein SYT-SSX1 bound to chromatin remodeling
factor hBRM/hSNF2 alpha. Proc Natl Acad Sci U S A.
2001;98(7):3843–8.
25. Biankin AV, Waddell N, Kassahn KS, Gingras MC, Muthuswamy LB, Johns AL,
et al. Pancreatic cancer genomes reveal aberrations in axon guidance
pathway genes. Nature. 2012;491(7424):399–405.
26. Wiederschain D, Chen L, Johnson B, Bettano K, Jackson D, Taraszka J, et al.
Contribution of polycomb homologues Bmi-1 and Mel-18 to
medulloblastoma pathogenesis. Mol Cell Biol. 2007;27(13):4968–79.
27. Nikiforov YE. Editorial: anaplastic carcinoma of the thyroid–will aurora B light
a path for treatment? J Clin Endocrinol Metab. 2005;90(2):1243–5.
28. Shimaoka K, Schoenfeld DA, DeWys WD, Creech RH, DeConti R. A
randomized trial of doxorubicin versus doxorubicin plus cisplatin in patients
with advanced thyroid carcinoma. Cancer. 1985;56(9):2155–60.
29. Gottlieb JA, Hill Jr CS. Chemotherapy of thyroid cancer with adriamycin.
Experience with 30 patients. N Engl J Med. 1974;290(4):193–7.
30. Wiseman SM, Masoudi H, Niblock P, Turbin D, Rajput A, Hay J, et al.
Anaplastic thyroid carcinoma: expression profile of targets for therapy offers
new insights for disease treatment. Ann Surg Oncol. 2007;14(2):719–29.
31. Wagle N, Grabiner BC, Van Allen EM, Amin-Mansour A, Taylor-Weiner A,
Rosenberg M, et al. Response and acquired resistance to everolimus in
anaplastic thyroid cancer. N Engl J Med. 2014;371(15):1426–33.
32. Grande E, Capdevila J, Diez JJ, Longo F, Carrato A. A significant response to
sunitinib in a patient with anaplastic thyroid carcinoma. J Res Med Sci.
2013;18(7):623–5.
33. Rosove MH, Peddi PF, Glaspy JA. BRAF V600E inhibition in anaplastic thyroid
cancer. N Engl J Med. 2013;368(7):684–5.
34. Bible KC, Suman VJ, Menefee ME, Smallridge RC, Molina JR, Maples WJ, et al.
A multiinstitutional phase 2 trial of pazopanib monotherapy in advanced
anaplastic thyroid cancer. J Clin Endocrinol Metab. 2012;97(9):3179–84.
35. Ha HT, Lee JS, Urba S, Koenig RJ, Sisson J, Giordano T, et al. A phase II study
of imatinib in patients with advanced anaplastic thyroid cancer. Thyroid.
2010;20(9):975–80.
36. Pennell NA, Daniels GH, Haddad RI, Ross DS, Evans T, Wirth LJ, et al. A phase II study
of gefitinib in patients with advanced thyroid cancer. Thyroid. 2008;18(3):317–23.
37. Cohen EE, Rosen LS, Vokes EE, Kies MS, Forastiere AA, Worden FP, et al. Axitinib
is an active treatment for all histologic subtypes of advanced thyroid cancer:
results from a phase II study. J Clin Oncol. 2008;26(29):4708–13.
38. Gupta-Abramson V, Troxel AB, Nellore A, Puttaswamy K, Redlinger M,
Ransone K, et al. Phase II trial of sorafenib in advanced thyroid cancer. J Clin
Oncol. 2008;26(29):4714–9.
Kasaian et al. BMC Cancer (2015) 15:984
Page 11 of 11
39. Savvides P, Nagaiah G, Lavertu P, Fu P, Wright JJ, Chapman R, et al. Phase II
trial of sorafenib in patients with advanced anaplastic carcinoma of the
thyroid. Thyroid. 2013;23(5):600–4.
40. Anonymous ESMO; 2014.
41. Mooney CJ, Nagaiah G, Fu P, Wasman JK, Cooney MM, Savvides PS, et al. A
phase II trial of fosbretabulin in advanced anaplastic thyroid carcinoma and
correlation of baseline serum-soluble intracellular adhesion molecule-1 with
outcome. Thyroid. 2009;19(3):233–40.
42. Sosa JA, Elisei R, Jarzab B, Balkissoon J, Lu SP, Bal C, et al. Randomized safety
and efficacy study of fosbretabulin with paclitaxel/carboplatin against
anaplastic thyroid carcinoma. Thyroid. 2014;24(2):232–40.
43. Banerjee R, Russo N, Liu M, Basrur V, Bellile E, Palanisamy N, et al.
TRIP13 promotes error-prone nonhomologous end joining and induces
chemoresistance in head and neck cancer. Nat Commun. 2014;5:4527.
44. Land SC, Tee AR. Hypoxia-inducible factor 1alpha is regulated by the
mammalian target of rapamycin (mTOR) via an mTOR signaling motif. J Biol
Chem. 2007;282(28):20534–43.
45. Papewalis C, Wuttke M, Schinner S, Willenberg HS, Baran AM,
Scherbaum WA, et al. Role of the novel mTOR inhibitor RAD001
(everolimus) in anaplastic thyroid cancer. Horm Metab Res. 2009;41(10):
752–6.
46. Akar U, Ozpolat B, Mehta K, Fok J, Kondo Y, Lopez-Berestein G. Tissue
transglutaminase inhibits autophagy in pancreatic cancer cells. Mol Cancer Res.
2007;5(3):241–9.
47. Kadoch C, Hargreaves DC, Hodges C, Elias L, Ho L, Ranish J, et al. Proteomic
and bioinformatic analysis of mammalian SWI/SNF complexes identifies
extensive roles in human malignancy. Nat Genet. 2013;45(6):592–601.
48. Eid JE, Kung AL, Scully R, Livingston DM. p300 interacts with the nuclear protooncoprotein SYT as part of the active control of cell adhesion. Cell. 2000;102(6):
839–48.
49. Gaude E, Frezza C. Defects in mitochondrial metabolism and cancer. Cancer
Metab. 2014;2:10-3002-2-10. eCollection 2014.
50. Kaelin Jr WG, McKnight SL. Influence of metabolism on epigenetics and
disease. Cell. 2013;153(1):56–69.
Submit your next manuscript to BioMed Central
and we will help you at every step:
• We accept pre-submission inquiries
• Our selector tool helps you to find the most relevant journal
• We provide round the clock customer support
• Convenient online submission
• Thorough peer review
• Inclusion in PubMed and all major indexing services
• Maximum visibility for your research
Submit your manuscript at
www.biomedcentral.com/submit