Xử lý hình ảnh thông minh P4
Bạn đang xem bản rút gọn của tài liệu. Xem và tải ngay bản đầy đủ của tài liệu tại đây (954.48 KB, 76 trang )
Intelligent Image Processing.SteveMann
Copyright 2002 John Wiley & Sons, Inc.
ISBNs: 0-471-40637-6 (Hardback); 0-471-22163-5 (Electronic)
4
COMPARAMETRIC EQUATIONS,
QUANTIGRAPHIC IMAGE
PROCESSING, AND
COMPARAGRAPHIC RENDERING
The EyeTap glasses of the previous chapter absorb and quantify rays of light,
process these rays of light, and then resynthesize corresponding rays of light.
Each synthesized ray of light is collinear with, and responsive to, a corresponding
absorbed ray of light. The exact manner in which it is responsive is the subject of
this chapter. In other words, this chapter provides meaning to the word “quantify”
in the phrase “absorb and quantify.”
It is argued that hidden within the flow of signals from typical cameras, through
image processing, to display media, is a homomorphic filter. While homomor-
phic filtering is often desirable, there are some occasions when it is not. Thus
cancellation of this implicit homomorphic filter is proposed, through the intro-
duction of an antihomomorphic filter. This concept gives rise to the principle
of photoquantigraphic image processing, wherein it is argued that most cameras
can be modeled as an array of idealized light meters each linearly responsive to
a semimonotonic function of the quantity of light received and integrated over
a fixed spectral response profile. This quantity, called the “photoquantigraphic
quantity,” is neither radiometric nor photometric but rather depends only on the
spectral response of the sensor elements in the camera. A particular class of func-
tional equations, called “comparametric equations,” is introduced as a basis for
photoquantigraphic image processing. Comparametric equations are fundamental
to the analysis and processing of multiple images differing only in exposure. The
well-known gamma correction of an image is presented as a simple example of a
comparametric equation, for which it is shown that the underlying photoquanti-
graphic function does not pass through the origin. For this reason it is argued that
exposure adjustment by gamma correction is inherently flawed, and alternatives
are provided. These alternatives, when applied to a plurality of images that differ
only in exposure, give rise to a new kind of processing in the amplitude domain
103
104
COMPARAMETRIC EQUATIONS, QUANTIGRAPHIC IMAGE PROCESSING
(as opposed to the time domain or the frequency domain). While the theoret-
ical framework presented in this chapter originated within the field of wearable
cybernetics (wearable photographic apparatus) in the 1970s and early 1980s, it is
applicable to the processing of images from nearly all types of modern cameras,
wearable or otherwise. This chapter follows roughly a 1992 unpublished report
by the author entitled “Lightspace and the Wyckoff Principle.”
4.1 HISTORICAL BACKGROUND
The theory of photoquantigraphic image processing, with comparametric
equations, arose out of the field of wearable cybernetics, within the context of
so-called mediated reality (MR) [19] and personal imaging [1], as described in
previous chapters. However, this theory has potentially much more widespread
applications in image processing than just the wearable photographic personal
assistant for which it was developed. Accordingly a general formulation that
does not necessarily involve a wearable photographic system will be given in
this chapter. In this way, this chapter may be read and used independent of the
specific application to which it pertains within the context of this book.
4.2 THE WYCKOFF PRINCIPLE AND THE RANGE OF LIGHT
The quantity of light falling on an image sensor array, or the like, is a real-
valued function q(x, y) of two real variables x and y. An image is typically
a degraded measurement of this function, where degredations may be divided
into two categories: those that act on the domain (x, y) and those that act on
the range q. Sampling, aliasing, and blurring act on the domain, while noise
(including quantization noise) and the nonlinear response function of the camera
act on the range q.
Registering and combining multiple pictures of the same subject matter will
often result in an improved image of greater definition. There are four classes of
such improvement:
1. Increased spatial resolution (domain resolution)
2. Increased spatial extent (domain extent)
3. Increased tonal fidelity (range resolution)
4. Increased dynamic range (range extent)
4.2.1 What’s Good for the Domain Is Good for the Range
The notion of producing a better picture by combining multiple input pictures
has been well studied with regard to the domain (x, y) of these pictures. Horn
and Schunk, for example, provide means of determining optical flow [71], and
many researchers have then used this result to spatially register multiple images
THE WYCKOFF PRINCIPLE AND THE RANGE OF LIGHT
105
and provide a single image of increased spatial resolution and increased spatial
extent. Subpixel registration methods such as those proposed by [72] attempt to
increase domain resolution. These methods depend on slight (subpixel) shift from
one image to the next. Image compositing (mosaicking) methods such as those
proposed by [73,74] attempt to increase domain extent. These methods depend
on large shifts from one image to the next.
Although methods that are aimed at increasing domain resolution and domain
extent tend to also improve tonal fidelity by virtue of a signal-averaging and
noise-reducing effect, we will see in what follows that images of different
exposure can be combined to further improve upon tonal fidelity and dynamic
range. Just as spatial shifts in the domain (x, y) improve the image, we will also
see that exposure shifts (shifts in the range, q) also improve the image.
4.2.2 Extending Dynamic Range and Improvement of Range
Resolution by Combining Differently Exposed Pictures of the Same
Subject Matter
The principles of photoquantigraphic image processing and the notion of using
differently exposed pictures of the same subject matter to make a picture
composite of extended dynamic range was inspired by the pioneering work of
Charles Wyckoff who invented so-called extended response film [75,76].
Before the days of digital image processing, Wyckoff formulated a multiple
layer photographic emulsion [76,75]. The Wyckoff film had three layers that were
identical in their spectral sensitivities (each was roughly equally sensitive to all
wavelengths of light) and differed only in their overall sensitivities to light (e.g.,
the bottom layer was very slow, with an ISO rating of 2, while the top layer was
very fast with an ISO rating of 600).
A picture taken on Wyckoff film can both record a high dynamic range
(e.g., a hundred million to one) and capture very subtle differences in exposure.
Furthermore the Wyckoff picture has very good spatial resolution, and thus
appears to overcome the resolution to depth trade-off by using different color
dyes in each layer that have a specular density as opposed the diffuse density of
silver. Wyckoff printed his grayscale pictures on color paper, so the fast (yellow)
layer would print blue, the medium (magenta) layer would print green, and the
slow (cyan) layer would print red. His result was a pseudocolor image similar
to those used now in data visualization systems to display floating point arrays
on a computer screen of limited dynamic range.
Wyckoff’s best-known pictures are perhaps his motion pictures of nuclear
explosions in which one can clearly see the faint glow of a bomb just before it
explodes (which appears blue, since it only exposed the fast top layer), as well
as the details in the highlights of the explosion (which appear white, since they
exposed all three layers whose details are discernible primarily on account of the
slow bottom layer).
The idea of computationally combining differently exposed pictures of the
same scene to obtain extended dynamic range (i.e., a similar effect to that
106
COMPARAMETRIC EQUATIONS, QUANTIGRAPHIC IMAGE PROCESSING
embodied by the Wyckoff film) has been recently proposed [63]. In fact, most
everyday scenes have a far greater dynamic range than can be recorded on a
photographic film or electronic imaging apparatus. A set of pictures that appear
identical except for their exposure collectively show us much more dynamic range
than any single picture from a set, and this also allows the camera’s response
function to be estimated, to within a single constant unknown scalar [59,63,77].
A set of functions
f
i
(x) = f(k
i
q(x)), (4.1)
where k
i
are scalar constants, is known as a Wyckoff set [63,77], so named
because of the similarity with the layers of a Wyckoff film. A Wyckoff set
of functions f
i
(x) describes a set of images differing only in exposure, when
x = (x, y) is the continuous spatial coordinate of the focal plane of an electronic
imaging array (or piece of film), q is the quantity of light falling on the array (or
film), and f is the unknown nonlinearity of the camera’s (or combined film’s and
scanner’s) response function. Generally, f is assumed to be a pointwise function,
that is, invariant to x.
4.2.3 The Photoquantigraphic Quantity, q
The quantity q in (4.1) is called the photoquantigraphic quantity [2], or just the
photoquantity (or photoq) for short. This quantity is neither radiometric (radiance
or irradiance) nor photometric (luminance or illuminance). Notably, since the
camera will not necessarily have the same spectral response as the human eye,
or in particular, that of the photopic spectral luminous efficiency function as
determined by the CIE and standardized in 1924, q is not brightness, lightness,
luminance, nor illuminance. Instead, photoquantigraphic imaging measures the
quantity of light integrated over the spectral response of the particular camera
system,
q =
∞
0
q
s
(λ)s(λ) dλ, (4.2)
where q
s
(λ) is the actual light falling on the image sensor and s is the spectral
sensitivity of an element of the sensor array. It is assumed that the spectral
sensitivity does not vary across the sensor array.
4.2.4 The Camera as an Array of Light Meters
The quantity q reads in units that are quantifiable (i.e., linearized or logarithmic)
in much the same way that a photographic light meter measures in quantifiable
(linear or logarithmic) units. However, just as the photographic light meter
imparts to the measurement its own spectral response (e.g., a light meter using
a selenium cell will impart the spectral response of selenium cells to the
measurement), photoquantigraphic imaging accepts that there will be a particular
spectral response of the camera that will define the photoquantigraphic unit q.
THE WYCKOFF PRINCIPLE AND THE RANGE OF LIGHT
107
Each camera will typically have its own photoquantigraphic unit. In this way the
camera may be regarded as an array of light meters:
q(x, y) =
∞
0
q
ss
(x, y, λ)s(λ) dλ, (4.3)
where q
ss
is the spatially varying spectral distribution of light falling on the
image sensor. This light might, in principle, be captured by an ideal Lippman
photography process that preserves the entire spectral response at every point on
an ideal film plane, but more practically, it can only be captured in grayscale or
tricolor (or a finite number of color) response at each point.
Thus varying numbers of photons of lesser or greater energy (frequency times
Planck’s constant) are absorbed by a given element of the sensor array and, over
the temporal integration time of a single frame in the video sequence (or the
picture taking time of a still image) will result in the photoquantigraphic quantity
given by 4.3.
In a color camera, q(x, y) is simply a vector quantity, such as [q
r
(x, y),
q
g
(x, y), q
b
(x, y)], where each component is derived from a separate spectral
sensitivity function. In this chapter the theory will be developed and explained
for grayscale images, where it is understood that most images are color images
for which the procedures are applied to the separate color channels. Thus in
both grayscale and color cameras the continuous spectral information q
s
(λ) is
lost through conversion to a single number q or to typically 3 numbers, q
r
, q
g
,
and q
b
.
Ordinarily cameras give rise to noise. That is, there is noise from the sensor
elements and further noise within the camera (or equivalently noise due to film
grain and subsequent scanning of a film, etc.). A goal of photoquantigraphic
imaging is to estimate the photoquantity q in the presence of noise. Since q
s
(λ)
is destroyed, the best we can do is to estimate q. Thus q is the fundamental or
“atomic” unit of photoquantigraphic image processing.
4.2.5 The Accidentally Discovered Compander
Most cameras do not provide an output that varies linearly with light input.
Instead, most cameras contain a dynamic range compressor, as illustrated in
Figure 4.1. Historically the dynamic range compressor in video cameras arose
because it was found that televisions did not produce a linear response to the video
signal. In particular, it was found that early cathode ray screens provided a light
output approximately equal to voltage raised to the exponent of 2.5. Rather than
build a circuit into every television to compensate for this nonlinearity, a partial
compensation (exponent of 1/2.22) was introduced into the television camera at
much lesser cost, since there were far more televisions than television cameras
in those days before widespread deployment of video surveillance cameras,
and the like. Indeed, early television stations, with names such as “American
Broadcasting Corporation” and “National Broadcasting Corporation” suggest this
108
COMPARAMETRIC EQUATIONS, QUANTIGRAPHIC IMAGE PROCESSING
CAMERA
Compressor
Sensor noise Image noise
Expander
DISPLAY
Sensor
''Lens''
Cathode ray tube
q
q
^
f
++
Light
rays
Every camera equiv.
to ideal photoq. camera
with noise and distortion
Storage,
transmission,
processing, ...
Degraded depiction
of subject matter
n
q
n
f
f
−1
f
1
~
Subject
matter
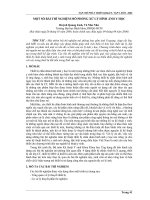
Figure 4.1 Typical camera and display. Light from subject matter passes through lens
(approximated with simple algebraic projective geometry, or an idealized ‘‘pinhole’’) and is
quantified in q units by a sensor array where noise n
q
is also added to produce an output
that is compressed in dynamic range by an unknown function f. Further noise n
f
is introduced
by the camera electronics, including quantization noise if the camera is a digital camera and
compression noise if the camera produces a compressed output such as a jpeg image, giving
rise to an output image f
1
(x, y). The apparatus that converts light rays into f
1
(x, y) is labeled
CAMERA
.Theimagef
1
is transmitted or recorded and played back into a
DISPLAY
system, where
the dynamic range is expanded again. Most cathode ray tubes exhibit a nonlinear response
to voltage, and this nonlinear response is the expander. The block labeled ‘‘expander’’ is
therefore not usually a separate device. Typical print media also exhibit a nonlinear response
that embodies an implicit expander.
one-to-many mapping (one camera to many televisions across a whole country).
Clearly, it was easier to introduce an inverse mapping into the camera than to
fix all televisions.
1
Through a fortunate and amazing coincidence, the logarithmic response of
human visual perception is approximately the same as the inverse of the response
of a television tube (i.e., human visual response is approximately the same as the
response of the television camera) [78,79]. For this reason, processing done on
typical video signals could be on a perceptually relevant tone scale. Moreover
any quantization on such a video signal (e.g., quantization into 8 bits) could be
close to ideal in the sense that each step of the quantizer could have associated
with it a roughly equal perceptual change in perceptual units.
Figure 4.2 shows plots of the compressor (and expander) used in video
systems together with the corresponding logarithm log(q + 1), and antilogarithm
exp(q) − 1, plots of the human visual system and its inverse. (The plots have
been normalized so that the scales match.) With images in print media, there is
a similarly expansive effect in which the ink from the dots bleeds and spreads
out on the printed paper, such that the midtones darken in the print. For this
reason printed matter has a nonlinear response curve similar in shape to that
of a cathode ray tube (i.e., the nonlinearity expands the dynamic range of the
printed image). Thus cameras designed to capture images for display on video
1
It should be noted that some cameras, such as many modern video surveillance cameras, operate
linearly when operating at very low light levels.
THE WYCKOFF PRINCIPLE AND THE RANGE OF LIGHT
109
Renormalized signal level,
f
1
Normalized response
Photoquantity,
q
0
0
10
8
6
4
2
0.2 0.4 0.6 0.8 1
Photoquantity,
q
Dynamic range expandersDynamic range compressors
0
0
1
0.8
0.6
0.4
0.2
246810
Power
law
Logarithmic
Antilog
Power law
Figure 4.2 The power law dynamic range compression implemented inside most cameras
showing approximately the same shape of curve as the logarithmic function, over the range of
signals typically used in video and still photography. The power law response of typical cathode
ray tubes, as well as that of typical print media, is quite similar to the antilog function. The act of
doing conventional linear filtering operations on images obtained from typical video cameras,
or from still cameras taking pictures intended for typical print media, is in effect homomorphic
filtering with an approximately logarithmic nonlinearity.
screens have approximately the same kind of built-in dynamic range compression
suitable for print media as well.
It is interesting to compare this naturally occurring (and somewhat accidental)
development in video and print media with the deliberate introduction of
companders (compressors and expanders) in audio. Both the accidentally
occurring compression and expansion of picture signals and the deliberate use
of logarithmic (or mu-law) compression and expansion of audio signals serve to
allow 8 bits to be used to often encode these signals in a satisfactory manner.
(Without dynamic range compression, 12 to 16 bits would be needed to obtain
satisfactory reproduction.)
Most still cameras also provide dynamic range compression built into the
camera. For example, the Kodak DCS-420 and DCS-460 cameras capture
internally in 12 bits (per pixel per color) and then apply dynamic range
compression, and finally output the range-compressed images in 8 bits (per pixel
per color).
4.2.6 Why Stockham Was Wrong
When video signals are processed, using linear filters, there is an implicit
homomorphic filtering operation on the photoquantity. As should be evident
from Figure 4.1, operations of storage, transmission, and image processing take
place between approximately reciprocal nonlinear functions of dynamic range
compression and dynamic range expansion.
110
COMPARAMETRIC EQUATIONS, QUANTIGRAPHIC IMAGE PROCESSING
Many users of image-processing systems are unaware of this fact, because
there is a common misconception that cameras produce a linear output, and that
displays respond linearly. There is a common misconception that nonlinearities
in cameras and displays arise from defects and poor-quality circuits, when in
actual fact these nonlinearities are fortuitously present in display media and
deliberately present in most cameras. Thus the effect of processing signals such
as f
1
in Figure 4.1 with linear filtering is, whether one is aware of it or not,
homomorphic filtering.
Tom Stockham advocated a kind of homomorphic filtering operation in which
the logarithm of the input image is taken, followed by linear filtering (i.e., linear
space invariant filters), and then by taking the antilogarithm [58].
In essence, what Stockham didn’t appear to realize is that such homomorphic
filtering is already manifest in simply doing ordinary linear filtering on ordinary
picture signals (from video, film, or otherwise). In particular, the compressor
gives an image f
1
= f(q)= q
1/2.22
= q
0.45
(ignoring noise n
q
and n
f
)thathas
the approximate effect of f
1
= f(q)= log(q + 1). This is roughly the same
shape of curve and roughly the same effect (i.e., to brighten the midtones of
the image prior to processing) as shown in Figure 4.2. Similarly a typical video
display has the effect of undoing (approximately) the compression, and thus
darkening the midtones of the image after processing with ˆq =
˜
f
−1
(f
1
) = f
2.5
1
.
In some sense what Stockham did, without really realizing it, was to apply
dynamic range compression to already range compressed images, and then do
linear filtering, and then apply dynamic range expansion to images being fed to
already expansive display media.
4.2.7 On the Value of Doing the Exact Opposite of
What Stockham Advocated
There exist certain kinds of image processing for which it is preferable to
operate linearly on the photoquantity q. Such operations include sharpening
of an image to undo the effect of the point spread function (PSF) blur of
a lens (see Fig. 3.27). Interestingly many textbooks and papers that describe
image restoration (i.e., deblurring an image) fail to take into account the inherent
nonlinearity deliberately built into most cameras.
What is needed to do this deblurring and other kinds of photoquantigraphic
image processing is an antihomomorphic filter. The manner in which an
antihomomorphic filter is inserted into the image processing path is shown in
Figure 4.3.
Consider an image acquired through an imperfect lens that imparts a blurring
to the image, with a blurring kernel B. The lens blurs the actual spatiospectral
(spatially varying and spectrally varying) quantity of light q
ss
(x,y,λ),whichis
the quantity of light falling on the sensor array just prior to being measured by
the sensor array:
˜q
ss
(x,y,λ)=
B(x − u, y − v)q
ss
(u, v, λ) du d v. (4.4)
THE WYCKOFF PRINCIPLE AND THE RANGE OF LIGHT
111
CAMERA
Compressor
Sensor noise
Image noise
Expander
DISPLAY
Sensor
''Lens''
Cathode ray tube
f
q
^
f
^
~
^
Estimated
expander
Linear
processing
Estimated
compressor
Subject
matter
Light
rays
f
−1
f
1
q
1
f
−1
n
q
n
f
++
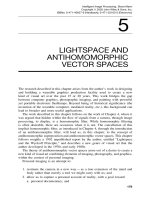
Figure 4.3 The antihomomorphic filter. Two new elements
ˆ
f
−1
and
ˆ
f have been inserted, as
compared to Figure 4.1. These are estimates of the inverse and forward nonlinear response
function of the camera. Estimates are required because the exact nonlinear response of a
camera is generally not part of the camera specifications. (Many camera vendors do not even
disclose this information if asked.) Because of noise in the signal f
1
, and also because of noise
in the estimate of the camera nonlinearity f, what we have at the output of
ˆ
f
−1
is not q but rather
an estimate
˜
q. This signal is processed using linear filtering, and then the processed result is
passed through the estimated camera response function
ˆ
f, which returns it to a compressed
tone scale suitable for viewing on a typical television, computer, and the like, or for further
processing.
This blurred spatiospectral quantity of light ˜q
ss
(x,y,λ)is then photoquantified
by the sensor array:
q(x, y) =
∞
0
˜q
ss
(x, y, λ)s(λ) dλ
=
∞
0
∞
−∞
∞
−∞
B(x − u, y − v)q
ss
(u, v, λ)s(λ) du dv dλ
=
∞
−∞
∞
−∞
B(x − u, y − v)
∞
0
q
ss
(u, v, λ)s(λ) d λ
du d v
=
∞
−∞
∞
−∞
B(x − u, y − v)q(u, v) d u d v,
(4.5)
which is just the blurred photoquantity q.
The antihomomorphic filter of Figure 4.3 can be used to better undo the effect
of lens blur than traditional linear filtering, which simply applies linear operations
to the signal f
1
and therefore operates homomorphically rather than linearly on
the photoquantity q. So we see that in many practical situations there is an
articulable basis for doing exactly the opposite of what Stockham advocated. Our
expanding the dynamic range of the image before processing and compressing it
afterward is opposed to what Stockham advocated, which was to compress the
dynamic range before processing and expand it afterward.
4.2.8 Using Differently Exposed Pictures of the Same Subject Matter
to Get a Better Estimate of q
Because of the effects of noise (quantization noise, sensor noise, etc.), in practical
imaging situations, the Wyckoff set, which describes a plurality of pictures that
112
COMPARAMETRIC EQUATIONS, QUANTIGRAPHIC IMAGE PROCESSING
differ only in exposure (4.1), should be rewritten
f
i
(x) = f(k
i
q(x) + n
q
i
) + n
f
i
,(4.6)
where each image has, associated with it, a separate realization of a photoquanti-
graphic noise process n
q
and an image noise process n
f
that includes noise
introduced by the electronics of the dynamic range compressor f , and other
electronics in the camera that affect the signal after its dynamic range has been
compressed. In a digital camera, n
f
also includes the two effects of finite word
length, namely quantization noise (applied after the image has undergone dynamic
range compression), and the clipping or saturation noise of limited dynamic range.
In a camera that produces a data-compressed output, such as the Kodak DC260
which produces JPEG images, n
f
also includes data-compression noise (JPEG
artifacts, etc., which are also applied to the signal after it has undergone dynamic
range compression). Refer again to Figure 4.1.
If it were not for noise, we could obtain the photoquantity q from any one
of a plurality of differently exposed pictures of the same subject matter, for
example, as
q =
1
k
i
f
−1
(f
i
), (4.7)
where the existence of an inverse for f follows from the semimonotonicity
assumption. Semimonotonicity follows from the fact that we expect pixel values
to either increase or stay the same with increasing quantity of light falling on the
image sensor.
2
However, because of noise, we obtain an advantage by capturing
multiple pictures that differ only in exposure. The dark (underexposed) pictures
show us highlight details of the scene that would have been overcome by noise
(i.e., washed out) had the picture been “properly exposed.” Similarly the light
pictures show us some shadow detail that would not have appeared above the
noise threshold had the picture been “properly exposed.”
Each image thus provides us with an estimate of the actual photoquantity q:
q =
1
k
i
(f
−1
(f
i
− n
f
i
) − n
q
i
), (4.8)
where n
q
i
is the photoquantigraphic noise associated with image i,andn
f
i
is the
image noise for image i. This estimate of q, ˆq may be written
ˆq
i
=
1
ˆ
k
i
ˆ
f
−1
(f
i
), (4.9)
where ˆq
i
is the estimate of q based on considering image i,and
ˆ
k
i
is the estimate
of the exposure of image i based on considering a plurality of differently exposed
2
Except in rare instances where the illumination is so intense as to damage the imaging apparatus,
for example, when the sun burns through photographic negative film and appears black in the final
print or scan.
THE WYCKOFF PRINCIPLE AND THE RANGE OF LIGHT
113
images. The estimated ˆq
i
is also typically based on an estimate of the camera
response function f , which is also based on considering a plurality of differently
exposed images. Although we could just assume a generic function f(q)= q
0.45
,
in practice, f varies from camera to camera. We can, however, make certain
assumptions about f that are reasonable for most cameras, such as that f does
not decrease when q is increased (that f is semimonotonic), that it is usually
smooth, and that f(0) = 0.
In what follows, we will see how k and f are estimated from multiple
differently exposed pictures. For the time being, let us suppose that they have
been successfully estimated so that we can calculate ˆq
i
from each of the input
images i. Such calculations, for each input image i, give rise to a plurality of
estimates of q, which in theory would be identical, were it not for noise. However,
in practice, because of noise, the estimates ˆq
i
are each corrupted in different ways.
Therefore it has been suggested that multiple differently exposed images may be
combined to provide a single estimate of q that can then be turned into an image
of greater dynamic range, greater tonal resolution, and less noise [63,77]. The
criteria under which collective processing of multiple differently exposed images
of the same subject matter will give rise to an output image that is acceptable at
every point (x, y) in the output image, are summarized below:
The Wyckoff Signal/Noise Criteria
∀(x
0
,y
0
) ∈ (x, y), ∃k
i
q(x
0
,y
0
) such that
1. k
i
q(x
0
,y
0
) n
q
i
,and
2. c
i
(q(x
0
,y
0
)) c
i
1
k
i
f
−1
(n
f
i
)
.
The first criterion indicates that for every pixel in the output image, at least
one of the input images provides sufficient exposure at that pixel location to
overcome sensor noise, n
q
i
. The second criterion states that of those at least one
input image provides an exposure that falls favorably (i.e., is neither overexposed
nor underexposed) on the response curve of the camera, so as not to be overcome
by camera noise n
f
i
. The manner in which differently exposed images of the same
subject matter are combined is illustrated, by way of an example involving three
input images, in Figure 4.4.
Moreover it has been shown [59] that the constants k
i
as well as the unknown
nonlinear response function of the camera can be determined, up to a single
unknown scalar constant, given nothing more than two or more pictures of the
same subject matter in which the pictures differ only in exposure. Thus the
reciprocal exposures used to tonally register (tonally align) the multiple input
images are estimates 1/
ˆ
k
i
in Figure 4.4. These exposure estimates are generally
made by applying an estimation algorithm to the input images, either while
simultaneously estimating f or as a separate estimation process (since f only
has to be estimated once for each camera, but the exposure k
i
is estimated for
every picture i that is taken).
Expander
DISPLAY
Cathode ray tube
f
^
f
−1
~
Compressor
Sensor noise Image noise
Subject
matter
Subject
matter
Subject
matter
Sensor
"Lens"
Light
rays
f
Estimated
expander
Estimated
expander
Estimated
expander
Estimated
compressor
Compressor
Sensor noise Image noise
Sensor
"Lens"
Light
rays
f
^
q
1
^
q
2
^
q
3
^
Compressor
Sensor noise Image noise
Sensor
"Lens"
Light
rays
f
^
^
^
^
^
^
k
1
^
CAMERA set to exposure 1
CAMERA set to exposure 2
CAMERA set to exposure 3
q
^
Anti−−homomorphic
Wyckoff filter
Optional anti−homomorphic
Wyckoff filter to act on estimated
photoquantity may
be inserted
here
Assumptions (see text for corresponding equations):
for every point in the imput image set,
1. There exists at least one image in the set
for which the exposure is sufficient to
overcome sensor noise, and
2. At least one image that satisfies
the above has an exposure that is not
lost in image noise by being to far into
the toe or shoulder region of the response
curve.
k
1
q
k
2
q
k
3
q
n
q
1
n
q
2
n
q
3
n
f
3
n
f
2
n
f
1
1/
k
1
c
1
1/
k
2
c
2
1/
k
3
c
3
f
1
f
2
f
3
f
−1
^
f
−1
^
f
−1
++
++
++
114
THE WYCKOFF PRINCIPLE AND THE RANGE OF LIGHT
115
Owing to the large dynamic range that some Wyckoff sets can cover, small
errors in f tend to have adverse effects on the overall estimate ˆq. Thus it
is preferable to estimate f as a separate process (i.e., by taking hundreds of
exposures with the camera under computer program control). Once f is known
(previously measured), then k
i
can be estimated for a particular set of images.
Thefinalestimateforq, depicted in Figure 4.4, is given by
ˆq(x, y) =
i
ˆc
i
ˆq
i
i
ˆc
i
=
i
[ˆc
i
(ˆq(x, y))/
ˆ
k
i
]
ˆ
f
−1
(f
i
(x, y))
i
ˆc
i
(ˆq(x, y))
,(4.10)
where ˆc
i
is given by
ˆc
i
(log(q(x, y))) =
df
i
(x, y)
d log ˆq(x, y)
=
d
ˆ
f(
ˆ
k
i
ˆq(x, y))
d log ˆq(x, y)
.(4.11)
From this expression we can see that c
i
(log(q)) are just shifted versions of
c(log(q)), or dilated versions of c(q).
The intuition behind the certainty function is that it captures the slope of
the response function, which indicates how quickly the output (pixel value or
the like) of the camera varies for given input. In the noisy camera, especially
a digital camera where quantization noise is involved, generally the camera’s
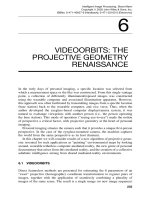
Figure 4.4 The Wyckoff principle. Multiple differently exposed images of the same subject
matter are captured by a single camera. In this example there are three different exposures.
The first exposure (
CAMERA
set to exposure 1) gives rise to an exposure k
1
q, the second to
k
2
q, and the third to k
3
q. Each exposure has a different realization of the same noise process
associated with it, and the three noisy pictures that the camera provides are denoted f
1
, f
2
,
and f
3
. These three differently exposed pictures comprise a noisy Wyckoff set. To combine
them into a single estimate, the effect of f is undone with an estimate
ˆ
f that represents our
best guess of what the function f is. While many video cameras use something close to the
standard f = kq
0.45
function, it is preferable to attempt to estimate f for the specific camera
in use. Generally, this estimate is made together with an estimate of the exposures k
i
.After
re-expanding the dynamic ranges with
ˆ
f
−1
, the inverse of the estimated exposures 1/
ˆ
k
i
is
applied. In this way the darker images are made lighter and the lighter images are made darker,
so they all (theoretically) match. At this point the images will all appear as if they were taken
with identical exposure, except for the fact that the pictures that were brighter to start with
will be noisy in lighter areas of the image and those that had been darker to start with will be
noisy in dark areas of the image. Thus rather than simply applying ordinary signal averaging,
a weighted average is taken. The weights are the spatially varying certainty functions c
i
(x, y).
These certainty functions turn out to be the derivative of the camera response function shifted
up or down by an amount k
i
. In practice, since f is an estimate, so is c
i
, and it is denoted
ˆ
c
i
in
the figure. The weighted sum is
ˆ
q(x, y), the estimate of the photoquantity q(x, y).Toviewthis
quantity on a video display, it is first adjusted in exposure, and it may be adjusted to a different
exposure level than any of the exposure levels used in taking the input images. In this figure,
for illustrative purposes, it is set to the estimated exposure of the first image,
ˆ
k
1
. The result is
then range-compressed with
ˆ
f for display on an expansive medium (
DISPLAY
).
116
COMPARAMETRIC EQUATIONS, QUANTIGRAPHIC IMAGE PROCESSING
output will be reliable where it is most sensitive to a fixed change in input light
level. This point where the camera is most responsive to changes in input is at
the peak of the certainty function c. The peak in c tends to be near the middle
of the camera’s exposure range. On the other hand, where the camera exposure
input is extremely large or small (i.e., the sensor is very overexposed or very
underexposed), the change in output for a given input is much less. Thus the
output is not very responsive to the input and the change in output can be easily
overcome by noise. Thus c tends to fall off toward zero on either side of its peak
value.
The certainty functions are functions of q. We may also write the uncertainty
functions, which are functions of pixel value in the image (i.e., functions of
grayvalue in f
i
), as
U(x,y) =
dF
−1
(f
i
(x, y))
df
i
(x, y)
.(4.12)
Its reciprocal is the certainty function C in the domain of the image (i.e., the
certainty function in pixel coordinates):
C(x, y) =
df
i
(x, y)
dF−1(f
i
(x, y))
,(4.13)
where F = log f and F
−1
() = log(f
−1
()). Note that C is the same for all images
(i.e., for all values of image index i), whereas c
i
was defined separately for
each image. For any i the function c
i
is a shifted (dilated) version of any other
certainty function c
j
, where the shift (dilation) depends on the log exposure K
i
(the exposure k
i
).
Thefinalestimateofq (4.10) is simply a weighted sum of the estimates from
q obtained from each of the input images, where each input image is weighted
by the certainties in that image.
4.2.9 Exposure Interpolation and Extrapolation
The architecture of this process is shown in Figure 4.5, which depicts an image
acquisition section (in this illustration, of three images), followed by an analysis
section (to estimate q) and by a resynthesis section to generate an image again
at the output (in this case four different possible output images are shown). The
output image can look like any of the input images, but with improved signal-
to-noise ratio, better tonal range, better color fidelity, and the like. Moreover an
output image can be an interpolated or extrapolated version in which it is lighter
or darker than any of the input images.
It should be noted that this process of interpolation or extrapolation provides a
new way of adjusting the tonal range of an image, and this new method is called
“comparadjustment.” As illustrated in Figure 4.5, the image synthesis portion
may also include various kinds of deblurring operations, and other kinds of
image-sharpening and lateral inhibition filters to reduce the dynamic range of
THE WYCKOFF PRINCIPLE AND THE RANGE OF LIGHT
117
Underexposed
‘‘Properly’’
exposed
Overexposed
Underexposure
‘‘Proper’’ exposure
Overexposure
Q
Q
c
Q
c
n
f
Q
c
n
f
Q
Q
F
^
F
^
F
^
1/
k
2
=0.995
^
^
^
^
Q
log(
f
)
log(
f
)
log(
f
)
Q
Q
^
^
^
q
^
Q
log(
f
)
^
Q
log(
f
)
^
Q
log(
f
)
^
Q
log(
f
)
^
k
a
k
b
k
c
k
d
q
Inverse
of estimated
camera
response
function
Camera
response
function
Inverses of estimates
of the relative exposures
Derivatives of the
estimates of the
response function, shifted
by exposure estimates
Estimate of the photoquantigraphic
quantity
q
(
x
,
y
)
Desired "virtual" exposures
Wyckoff
set (three
differently
exposed
pictures of
same
subject
matter)
Image
acquisition
Image
analysis
Image
synthesis
Original photoquantigraphic quantity
q
(
x
,
y
)
Three different exposures
two aperture-stops apart
^
1/
k
1
=4.01
^
1/
k
3
=0.26
The effect of
noise is to make
only midtones
be reliable
k
1
=0.25
k
2
=1.0
k
3
=4.0
Q
^
^
^
Relative certainty
functions work like
overlapping filters
in a filterbank, but
in the" amplitude domain"
rather than the frequency
domain
Examples of four synthetic images from a variety of extrapolated or interpolated exposure levels
n
f
f
1
c
1
q
1
q
2
q
3
c
1
c
2
c
3
c
2
c
3
f
1
f
1
f
1
f
2
f
3
f
a
f
b
f
c
f
d
Figure 4.5 Comparadjustment (quantigraphic image exposure adjustment on a Wyckoff set).
Multiple (in this example, 3) differently exposed (in this example by K = 2 f/stops)imagesare
acquired. Estimates of q from each image are obtained. These are combined by weighted sum.
The weights are the estimates of the certainty function shifted along the exposure axis by an
amount given by the estimated exposure for each image. From the estimated photoquantity
ˆ
q,
one or more output images may be generated by multiplying by the desired synthetic exposure
and passing the result through the estimated camera nonlinearity. In this example four synthetic
pictures are generated, each being an extrapolated or interpolated exposure of the three input
exposures. Thus we have a ‘‘virtual camera’’ [64] in which a exposure can be set retroactively.
118
COMPARAMETRIC EQUATIONS, QUANTIGRAPHIC IMAGE PROCESSING
the output image without loss of fine details. The result can be printed on paper
or presented to an electronic display in such a way as to have optimal tonal
definition.
4.3 COMPARAMETRIC IMAGE PROCESSING: COMPARING
DIFFERENTLY EXPOSED IMAGES OF THE SAME SUBJECT MATTER
As previously mentioned, comparison of two or more differently exposed
images may be done to determine q, or simply to tonally register the images
without determining q. Also, as previously mentioned, tonal registration is
more numerically stable than estimation of q, so there are some advantages
to comparametric analysis and comparametric image processing in which one of
the images is selected as a reference image, and others are expressed in terms
of this reference image, rather than in terms of q. Typically the dark images are
lightened, and/or the light images are darkened so that all the images match the
selected reference image. Note that in such lightening and darkening operations,
full precision is retained for further comparametric processing. Thus all but the
reference image will be stored as an array of floating point numbers.
4.3.1 Misconceptions about Gamma Correction: Why Gamma
Correction Is the Wrong Thing to Do!
So-called gamma correction (raising the pixel values in an image to an exponent)
is often used to lighten or darken images. While gamma correction does have
important uses, such as lightening or darkening images to compensate for
incorrect display settings, it will now be shown that when one uses gamma
correction to lighten or darken an image to compensate for incorrect exposure,
one is making an unrealistic assumption about the camera response function
whether or not one is aware of it.
Proposition 4.3.1 Tonally registering differently exposed images of the same
subject matter by gamma correcting them with exponent γ = k
is equivalent
to assuming that the nonlinear response function of the camera is f(q)=
exp(q
).
Proof The process of gamma correcting an image f to obtain a gamma-corrected
image g = f
γ
may be written
g(q) = f(kq)= (f (q))
γ
,(4.14)
where f is the original image, and g is the lightened or darkened image.
Solving (4.14) for f , the camera response function, we obtain
f(q)= exp(q
) = exp(q
log(γ )/ log(k)
).
(4.15)
COMPARAMETRIC IMAGE PROCESSING
119
We can verify that (4.15) is a solution of (4.14) by noting that g(q) = f(kq)=
exp
(kq)
= exp(k
q
) =
exp(q
)
γ
= f
γ
.
Example Two images, f
1
and f
2
differ only in exposure. Image f
2
was taken with
twice as much exposure as f
1
;thatis,iff
1
= f(q),thenf
2
= f(2q). Suppose
that we wish to tonally align the two images by darkening f
2
.Ifwedarkenf
2
by squaring all the pixel values of f
2
(normalized on the interval from 0 to 1, of
course), then we have implicity assumed, whether we choose to admit it or not,
that the camera response function must have been f(q)= exp(q
log
k
(2)
) = exp(q).
We see that the underlying solution of gamma correction, namely the camera
response function (4.15), does not pass through the origin. In fact f(0) = 1.
Since most cameras are designed so that they produce a signal level output of
zero when the light input is zero, the function f(q) does not correspond to a
realistic or reasonable camera response function. Even a medium that does not
itself fall to zero at zero exposure (e.g., film) is ordinarily scanned in such a
way that the scanned output is zero for zero exposure, assuming that the d
min
(minimum density for the particular emulsion being scanned) is properly set in
the scanner. Therefore it is inappropriate and incorrect to use gamma correction
to lighten or darken differently exposed images of the same subject matter, when
the goal of this lightening or darkening is tonal registration (making them look
the “same,” apart from the effects of noise which is accentuated in the shadow
detail of images that are lightened and the highlight detail of images that are
darkened).
4.3.2 Comparametric Plots and Comparametric Equations
To understand the shortcomings of gamma correction, and to understand some
alternatives, the concept of comparametric equations and comparametric plots
will now be introduced. Equation 4.14 is an example of what is called a
comparametric equation [64]. Comparametric equations are a special case
of the more general class of equations called functional equations [80] and
comparametric plots are a special case of the more general class of plots called
parametric plots.
The notion of a parametric plot is well understood. For example, the parametric
plot (r cos(q), r sin(q)) is a plot of a circle of radius r. Note that the circle can
be expressed in a form that does not depend explicitly on q, and that the shape
of the circle plotted is independent (assuming perfect precision in the sin and
cos functions) of the extent q so long as the domain of q includesatleastall
points around the circle (i.e., an interval over 2π such as the interval from 0 to
2π).
Informally, a comparametric plot (“comparaplot” for short) is a special kind
of parametric plot in which a function f is plotted against itself, and in which
the parameterization of the ordinate is a linearly scaled parameterization of the
abscissa. An intuitive understanding of a comparametric plot is provided by
way of Figure 4.6. Illustrated is a hypothetical system that would generate a
120
COMPARAMETRIC EQUATIONS, QUANTIGRAPHIC IMAGE PROCESSING
FF S
15 ips
30 ips
Tape
Speed
Rew Play
FF S
15 ips
30 ips
Tape
Speed
RewPlay
f
(
t
)
f
(2
t
) XY Plotter
High-speed
tape player
Low-speed
tape player
Output
f
(2
t
)
Output
f
(
t
)
Figure 4.6 A system that generates comparametric plots. To gain a better intuitive
understanding of what a comparametric plot is, consider two tape recorders that record
identical copies of the same subject matter and then play it back at different speeds. The
outputs of the two tape recorders are fed into an XY plotter, so that we have a plot of f(t) on the
X axis and a plot of f(2t) on the Y axis. Plotting the function f against a contracted or dilated
(stretched out) version of itself gives rise to a comparametric plot. If the two tapes start playing
at the same time origin, a linear comparametric plot is generated.
comparametric plot by playing two tape recordings of the same subject matter
(i.e., two copies of exactly the same tape recorded arbitrary signal) at two different
speeds into an XY plotter. If the subject matter recorded on the tapes is simply a
sinusoidal waveform, then the resulting comparametric plot is a Lissajous figure.
Lissajous figures are comparametric plots where the function f is a sinusoid.
However, for arbitrary signals recorded on the two tapes, the comparametric plot
is a generalization of the well-known Lissajous figure.
Depending on when the tapes are started, and on the relative speeds of
the two playbacks, the comparametric plot takes on the form x = f(t) and
y = f(at+ b),wheret is time, f is the subject matter recorded on the tape, x
is the output of the first tape machine, and y is the output of the second tape
machine.
The plot (f (t), f (at + b)) will be called an affine comparametric plot.
The special case when b = 0 will be called a linear comparametric plot,and
corresponds to the situation when both tape machines begin playing back the
subject matter at exactly the same time origin, although at possibly different
COMPARAMETRIC IMAGE PROCESSING
121
speeds. Since the linear comparametric plot is of particular interest in this book,
it will be assumed, when not otherwise specified, that b = 0 (we are referring to
a linear comparametric plot).
More precisely, the linear comparametric plot is defined as follows:
Definition 4.3.1 A plot along coordinates (f (q), f(kq)) is called a compara-
metric plot [64] of the function f(q).
Here the quantity q is used, rather than time t, because it will not necessarily
be time in all applications. In fact it will most often (in the rest of this book)
be a quantity of light rather than an axis of time. The function f() will also
be an attribute of the recording device (camera), rather than an attribute of the
input signal. Thus the response function of the camera will take on the role of
the signal recorded on the tape in this analogy.
A function f(q) has a family of comparametric plots, one for each value of
the constant k, which is called the comparametric ratio.
Proposition 4.3.2 When a function f(q) is monotonic, the comparametric plot
(f (q), f(kq)) can be expressed as a monotonic function g(f ) not
involving q.
Thus the plot in Definition 4.3.1 may be rewritten as a plot (f, g(f )), not
involving q. In this form the function g is called the comparametric function,
and it expresses the range of the function f(kq) as a function of the range of
the function f(q), independently of the domain q of the function f .
The plot g defines what is called a comparametric equation:
Definition 4.3.2 Equations of the form g(f (q)) = f(kq) are called compara-
metric equations [64].
A better understanding of comparametric equations may be had by referring
to the following diagram:
k
q kq
f f
f(g) f(kq)
g
(4.16)
wherein it is evident that there are two equivalent paths to follow from q to
f(kq):
g
◦
f = f
◦
k. (4.17)
Equation (4.17) may be rewritten
g = f
◦
k
◦
f
−1
,(4.18)
122
COMPARAMETRIC EQUATIONS, QUANTIGRAPHIC IMAGE PROCESSING
which provides an alternative definition of comparametric equation to that given
in Definition 4.3.2.
Equation 4.14 is an example of a comparametric equation, and (4.15) is a
solution of (4.14).
It is often preferable that comparametric equations be on the interval from zero
to one in the range of f . Equivalently stated, we desire comparametric equations
to be on the interval from zero to one in the domain of g and the range of g.In
this case the corresponding plots and equations are said to be unicomparametric.
(Actual images typically range from 0 to 255 and must thus be rescaled so that
they range from 0 to 1, for unicomparametric image processing.)
Often we also impose further constraints that f(0) = 0, g(0) = 0, g(1) = 1,
and differentiability at the origin. Solving a comparametric equation is equivalent
to determining the unknown camera response function from a pair of images
that differ only in exposure, when the comparametric equation represents the
relationship between grayvalues in the two pictures, and the comparametric ratio
k represents the ratio of exposures (i.e., if one picture was given taken with twice
the exposure of the other, then k = 2).
4.3.3 Zeta Correction of Images
An alternative to gamma correction is proposed. This alternative, called zeta
correction [70], will also serve as another example of a comparametric equation.
For zeta correction, we simply adjust the exponential solution (4.15) of the
comparametric equation given by traditional gamma correction, f(q)= exp(q
),
so that the solution passes through the origin:
f(q)= exp(q
) − 1.(4.19)
This camera response function passes through the origin (i.e., f(0) = 0, and is
therefore much more realistic and reasonable than the response function implicit
in gamma correction of images).
Using this camera response function (4.19), we define zeta correction as
g = (f + 1)
γ
− 1,(4.20)
which is the comparametric equation to which (4.19) is a solution. Thus (4.20)
defines a recipe for darkening or lightening an image f(q)to arrive at a corrected
(comparadjusted) image g(f (q)) where the underlying response function f(q)
is zero for q = 0.
More generally, in applying this recipe for comparadjustment of images, the
camera response function could be assumed to have been any of a family of
curves defined by
f(q)= exp(βq
) − 1,(4.21)
which are all solutions to (4.20).
As with gamma correction, the comparametric equation of zeta correction
passes through the origin. To be unicomparametric, we would like to have it also
pass through (1, 1), meaning we would like g(1) = 1.
COMPARAMETRIC IMAGE PROCESSING
123
We can achieve this unicomparametric attribute by first applying a property of
comparametric equations that will be shown later, namely that if we replace
f with a function h(f ) and replace g with the same function h(g) in a
comparametric equation and its solution, the transformed solution is a solution
to the transformed comparametric equation. Let us consider h(f ) = κf and
h(g) = κg (i.e., h serves to multiply by a constant κ). We therefore have that
f(q)=
exp(q
) − 1
κ
(4.22)
is a solution to the transformed comparametric equation:
g =
(κf + 1)
γ
− 1
κ
.(4.23)
Now, if we choose κ = 2
ζ
− 1, we obtain a response function
f(q)=
exp(q
) − 1
2
ζ
− 1
.(4.24)
The comparametric equation (4.23), with the denominator deleted, forms the
basis for zeta correction of images:
g =
((2
ζ
− 1)f + 1)
1/ζ
− 1, ∀ζ = 0,
2
f
− 1forζ = 0,
(4.25)
where γ has been fixed to be equal to 1/ζ so that there is only one degree of
freedom, ζ .
Implicit in zeta correction of images is the assumption of an exponential
camera response function, scaled. Although this is not realistic (given that the
exponential function expands dynamic range, and most cameras have compressive
response functions rather than expansive response functions), it is preferable
to gamma correction because of the implicit notion of a response function for
which f(0) = 0. With standard IEEE arithmetic, values of ζ can range from
approximately −50 to +1000.
4.3.4 Quadratic Approximation to Response Function
It is easier to derive a comparametric equation by working backward from
a solution to a comparametric equation than it is to solve a comparametric
equation. Thus we can build up a table of various comparametric equations and
their solutions, and then use properties of comparametric equations, which will
be described later, to rework entries from the table into desired formats. This
procedure is similar to the way that Laplace transforms are inverted by using a
table along with known properties.
124
COMPARAMETRIC EQUATIONS, QUANTIGRAPHIC IMAGE PROCESSING
Accordingly let us consider some other simple examples of comparametric
equations and their solutions. Suppose, for example, that we have a solution
f(q)= aq
2
+ bq + c(4.26)
to a comparametric equation g = g(f ). To generate the comparametric equation
to which (4.26) is a solution, we note that g(f (q)) = f(kq)= a(kq)
2
+
b(kq) + c. Now we wish to find the relationship between g and f not involving
q. The easiest way to do this is to eliminate q from each of f and g by noting
(starting with f )that
1
a
f = q
2
+
b
a
q +
c
a
(4.27)
and completing the square
1
a
f =
q +
b
2a
2
+
c
a
−
b
2
(2a)
2
.(4.28)
This gives
q =
−b ±
b
2
− 4a(c− f)
2a
.(4.29)
Similarly, for g,wehave
kq =
−b ±
b
2
− 4a(c− g)
2a
.(4.30)
So, setting k times (4.29) equal to (4.30), we have
k
−b ±
b
2
− 4a(c− f)
2a
=
−b ±
b
2
− 4a(c− g)
2a
(4.31)
which gives us the desired relationship between f and g without involving q.
Equation (4.31) is therefore a comparametric equation. It has the solution given
by (4.26).
Equation (4.31) can be made explicit in g:
g =
−2b + b
2
+ 4ac− 2b
2
k ± 2bk
b
2
− 4a(c− f)+ 2b
2
k
2
− 4ack
2
+ 4af k
2
∓ 2bk
2
b
2
− 4a(c− f)
4a
,(4.32)
which can be written in a simpler form as
g =
k
2
d
2
± 2b(k − k
2
)d + k
2
b
2
− 2b
2
k + 4ac + b
2
− 2b
4a
(4.33)
COMPARAMETRIC IMAGE PROCESSING
125
if we let the discriminant of (4.29) be d =
b
2
− 4a(c− f). Equation 4.33, can
be further understood in an even simpler form:
g = α ± βd + γd
2
,(4.34)
where α = (k
2
b
2
− 2b
2
k + 4ac + b
2
− 2b)/(4a), β = (b(k − k
2
))/(2a),and
γ = (k
2
)/(4a).
From (4.34) the general shape of the curve contains a constant component, a
primarily square root component, and a somewhat linear component, such that the
equation captures the general shape of quadratic curves but scaled down halfway
in powers. Thus (4.34) will be referred to as a “half-quadratic,” or “biratic”
model.
4.3.5 Practical Example: Verifying Comparametric Analysis
One of the important goals of comparametric analysis is to be able to determine a
camera response function and the exposure settings from two or more differently
exposed images [63,59,77]. Thus, even if we do not have the camera, we can
determine the response function of the camera from only the differently exposed
images.
Just as it is much easier to generate a comparametric equation from the solution
of a comparametric equation, it is also much easier to work backward from the
camera, if we have it available to us, than it is to solve the response function
when we only have a collection of pictures of overlapping scene content to work
with. Thus we will consider first the easier task of finding the response function
when we have the camera.
Logarithmic Logistic Curve Unrolling (Logunrolling):
The Photocell Experiment
Suppose that we just want to measure the response function of one pixel of the
camera, which we can regard as a light sensor, much like a photocell, cadmium
sulphide (CDS) cell, or solar cell (i.e., like the selenium solar cell used in a light
meter). To measure the response function of such a cell, all we really need is a
small light source that we could move toward the cell while observing the cell’s
output. In a camera the output is usually a number that ranges from 0 to 255, or
a set of three numbers that range from 0 to 255.
We next provide a light source of known relative output. We can do this by
varying the voltage on a lamp, for example. We could use a light dimmer, but
light dimmers produce a lot of flicker due to triac switching noise. Therefore it
is better to use a variable autotransformer (a Variac(TM), Powerstat(TM), etc.)
to adjust the voltage to a light bulb, and to use the well-known fact that the
light output of most light bulbs varies as q = v
3.5
(the three and a halfth power
law). We note that the color temperature of lights shifts when they are operated
at different voltages, meaning that the light becomes more yellow as the voltage
decreases.
126
COMPARAMETRIC EQUATIONS, QUANTIGRAPHIC IMAGE PROCESSING
A simpler and much more accurate and consistent way to vary the output of a
light source is to move it further from or closer to the sensor, or to cover portions
of it with black cardboard. So we begin with the light source far away, and move
it toward the sensor (camera, cell, or whatever) until some small output f
1
is
observable by the sensor. We associate this light output with the quantity of light
q
1
produced by the light source. Then we cover half the light source, if it’s a
small lamp, with a round reflector; we cover exactly half the reflector output
of the lamp with black paper, and this causes the quantity of light received at
the sensor to decrease to q
0
= q
1
/2. The measured quantity at the sensor is now
f
0
= f(q
0
). Next we move the half-covered lamp toward the sensor until the
quantity f
1
is observed. At this point, although the lamp is half covered up, it
is closer to the sensor, so the same amount of light q
1
reaches the sensor as did
when the lamp was further away and not half covered. Now, if we uncover the
other half of the lamp, the quantity of light received at the sensor will increase
to q
2
= 2q
1
. Thus, whatever quantity we observe, call it f
2
, it will be equal to
f(2q
1
) which is equal to f(4q
0
),wheref is the unknown response function of
the camera. We continue this process, now covering half the lamp back up again
to reduce its output back down to that of q
1
, and then moving it still closer to
the sensor until we observe an output of f
2
on the sensor. At this point we know
that the lamp is providing a quantity of light q
2
to the sensor even though it is
half covered. We can uncover the lamp in order to observe f
3
which we know
will be f
3
= f(2q
2
) = f(4q
1
) = f(8q
0
). As we repeat the process, we are able
to measure the response function of the sensor on a logarithmic scale where the
base of the logarithm is 2.
3
This process is called “log unrolling,” and we will denote it by the function
logunroll( ). Alternatively, we could use the inverse square law of light to
determine the response function of the camera.
Unfortunately, both the log-unrolling method, and the inverse square law
method suffer from various problems:
•
Only one element (i.e., one pixel or one region of pixels) of the sensor array
is used, so these methods are not very robust.
•
Most cameras have some kind of automatic gain control or automatic
exposure. Even cameras that claim to provide manual exposure settings often
fail to provide truly nonimage-dependent settings. Thus most cameras, even
when set to “manual,” will exhibit a change in output at the one area of the
sensor that depends on light incident on other areas of the sensor.
•
The output scale is too widely spaced. We only get one reading per doubling
of the exposure in the half covering method.
3
This log
2
spacing is quite wide; we only get to find f on a very coarse q axis that doubles each
time. However, we could use a smaller interval, by covering the lamp in quarter sections, or smaller
sections, such as varying the lamp in smaller output increments with pie-shaped octants of black
paper.
COMPARAMETRIC IMAGE PROCESSING
127
•
If we try to reduce the factor k from 2 to 4/3 by quarter-covering, the
cumulative error increases.
Measuring the Response Function f
Both the log-unrolling method and the inverse square law method are easy to
implement with almost no special equipment other than the camera and other
objects one can find in the average home or office, such as a lamp and some
black cardboard.
However, if we have access to a test pattern, having regions of known
transmissivity or reflectivity, we can measure the response function of the camera
much more easily, and in a way that does not suffer from many of the problems
with the log-unrolling method, and the inverse square law method. A CamAlign-
CGH test pattern from DSC Laboratories, Toronto, Canada (Serial No. S009494),
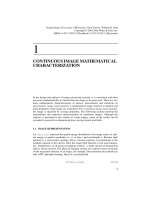
as shown in Figure 4.7 was used. The author cropped out the top graylevels test
pattern portion of the picture, and averaged down columns, to obtain a mean
plot as shown in Figure 4.8a. The author then differentiated the resulting list of
numbers to find the transition regions, and took the median across each such
region to obtain a robust estimate of f(q) for each of the 11 steps, as well as the
black regions of the test pattern. Using the known reflectivity of each of these
12 regions, a set of 12 ordered pairs (q, f (q)) results. These data are tabulated
Figure 4.7 Picture of test pattern taken by author on Wednesday December 20, 2000, late
afternoon, with imaging portion of wearable camera system mounted to tripod, for the purpose
of determining the response function f(q) of the imaging apparatus. Exposure was 1/30 s at
f/16 (60 mm lens on a D1 sensor array). WearComp transmission index v115 (115th light vector
of this transmission from a Xybernaut MA IV).