High expression of GEM and EDNRA is associated with metastasis and poor outcome in patients with advanced bladder cancer
Bạn đang xem bản rút gọn của tài liệu. Xem và tải ngay bản đầy đủ của tài liệu tại đây (884.25 KB, 10 trang )
Laurberg et al. BMC Cancer 2014, 14:638
/>
RESEARCH ARTICLE
Open Access
High expression of GEM and EDNRA is associated
with metastasis and poor outcome in patients
with advanced bladder cancer
Jens Reumert Laurberg1, Jørgen Bjerggaard Jensen2, Troels Schepeler1, Michael Borre2, Torben F Ørntoft1
and Lars Dyrskjøt1*
Abstract
Background: The standard treatment for non-metastatic muscle-invasive bladder cancer (stages T2–T4a) is radical
cystectomy with lymphadenectomy. However, patients undergoing cystectomy show metastatic spread in 25% of
cases and these patients will have limited benefit from surgery. Identification of patients with high risk of lymph
node metastasis will help select patients that may benefit from neoadjuvant and/or adjuvant chemotherapy.
Methods: RNA was procured by laser micro dissection of primary bladder tumors and corresponding lymph node
metastases for Affymetrix U133 Plus 2.0 Gene Chip expression profiling. A publically available dataset was used for
identification of the best candidate markers, and these were validated using immunohistochemistry in an
independent patient cohort of 368 patients.
Results: Gene Set Enrichment Analysis showed significant enrichment for e.g. metastatic signatures in the
metastasizing tumors, and a set of 12 genes significantly associated with lymph node metastasis was identified.
Tumors did not cluster according to their metastatic ability when analyzing gene expression profiles using
hierarchical cluster analysis. However, half (6/12) of the primary tumor clustered together with matching lymph
node metastases, indicating a large degree of intra-patient similarity in these patients. Immunohistochemical
analysis of 368 tumors from cystectomized patients showed high expression of GEM (P = 0.033; HR = 1.46) and
EDNRA (P = 0.046; HR = 1.60) was significantly associated with decreased cancer-specific survival.
Conclusions: GEM and EDNRA were identified as promising prognostic markers for patients with advanced bladder
cancer. The clinical relevance of GEM and EDNRA should be evaluated in independent prospective studies.
Keywords: Bladder cancer, Metastasis, Outcome, GEM, EDNRA
Background
Bladder cancer is the 4th most common cancer in men and
the 11th most common cancer in women [1]. Patients with
non-muscle-invasive bladder cancer (NMIBC) are predominantly treated with transurethral resection of the bladder
in combination with Bacillus Calmette-Guerin (BCG) or
Mitomycin C. Cystectomy is offered if local control cannot
be maintained. Recently, treatment of NMIBC has shifted
towards a more aggressive approach based on EORTC risk
scores, resulting in more patients receiving cystectomy
* Correspondence:
1
Department of Molecular Medicine, Aarhus University Hospital,
Brendstrupgaardsvej 100, 8200 Aarhus N, Denmark
Full list of author information is available at the end of the article
[2,3]. The standard treatment for non-metastatic muscleinvasive bladder cancer (MIBC) (stages T2–T4a) is radical
cystectomy with lymphadenectomy [4]. Patients with immobile tumors (T4b) receive chemotherapy– sometimes
followed by salvage cystectomy or radiotherapy [5]. Fiveyear cancer-specific survival for patients with MIBC is 65%
following cystectomy and neoadjuvant chemotherapy increases the 5-year survival with 6–8% but is, for now, not
standard treatment in all clinical settings [6,7].
Patients undergoing cystectomy show metastatic spread
in 25% of cases [8], and these patients will have limited
benefit of surgery. Identification of patients with high risk
of lymph node metastasis could help identify patients that
would benefit from neoadjuvant chemotherapy. Therefore,
© 2014 Laurberg et al.; licensee BioMed Central Ltd. This is an Open Access article distributed under the terms of the Creative
Commons Attribution License ( which permits unrestricted use, distribution, and
reproduction in any medium, provided the original work is properly credited. The Creative Commons Public Domain
Dedication waiver ( applies to the data made available in this article,
unless otherwise stated.
Laurberg et al. BMC Cancer 2014, 14:638
/>
identification of metastatic disease (to lymph nodes or distant organs) prior to cystectomy is of high importance.
Previously, several studies have focused on studying molecular markers to identify metastatic risk or ability based
on analysis of the patient’s primary tumor. Key players in
the DNA-damage-response and cell-cycle machinery (e.g.
p53, Rb, p21, p16, Tip60) have been investigated by immunohistochemistry, but none of the markers have shown significant power in validation studies to reach the clinic
[9-12]. More recently, gene-expression signatures have revealed promising results but have not yet been validated in
prospective patient cohorts [13,14]. Smith et al. reported a
20 gene signature in the primary tumor for predicting
lymph node metastasis based on three different cohorts,
making it the first study in MIBC where the gene signature
was validated in an independent patient cohort [15].
Patients with high relative risk (1.74) and low relative risk
(0.70) of node positive disease could be identified. In other
disease like e.g. breast cancer, metastatic capacity of the
primary tumors has been studied intensely, and several
gene expression signatures for predicting metastatic outcome have been develop and successfully validated [16-19].
Here we laser micro dissected primary bladder tumors
and corresponding lymph node metastases and performed
microarray gene expression profiling of the procured cells.
We compared gene expression patterns in primary bladder tumors with and without metastatic disease and by including previously published data from Riester et al. [20]
we identified a panel of 12 transcripts significantly associated with disease outcome. The prognostic value of GEM
(GTP binding protein overexpressed in skeletal muscle)
and EDNRA (endothelin receptor type A) were successfully validated in an independent patient cohort using tissue microarrays (TMAs).
Methods
Patients and follow-up
Written informed consent was obtained from all patients
and the study was approved by the Central Denmark
Region Committees on Biomedical Research Ethics (1994/
2920). All patients were cystectomized at Department of
Urology at Aarhus University Hospital between 1998
and 2008, and surviving patients had at least 36 months
of follow-up, and were censored after a maximum of
96 months. Tumor stage was determined using the American Joint Committee on Cancer recommendations from
2002 and WHO 2004 classification was used to determine
tumor grade. All patients were clinically free of metastasis
before surgery and no patients received neoadjuvant or adjuvant treatment in terms of chemotherapy or radiotherapy.
Page 2 of 10
biobank. Tissue for the biobank was embedded in
Tissue-Tek® O.C.T™ Compound and snap frozen in liquid nitrogen before storage at −80°C. Sections were examined by a genitourinary pathologist to identify
carcinoma cell content. Following, cresyl violet stained
tissue was microdissected using the PALM laser microbeam system. RNA extraction was performed using
RNeasy Micro Kits (Qiagen) according to manufacturer
protocols. RNA quality was assessed using an Agilent
Bioanalyzer 2100 (RIN: 2.4-8.8; median 5.9). Total RNA
was amplified and converted to cDNA using Nugen
Pico-RNA system. The two-round amplification kit is
optimized to amplify low volumes and poor quality RNA
for Affymetrix array analysis. After amplification, the
cDNA was fragmented and labeled using NuGen FLOvation kit, loaded onto the Affymetrix U133 Plus 2.0
Gene Chip according to the manufacturer’s protocol,
and scanned using the Affymetrix 3000 7G Scanner.
Microarray data analysis
Raw microarray data was normalized and intensity measures generated by RMA [21] using GeneSpring version
11 software. Unsupervised hierarchical cluster analysis of
all transcripts with a variance above 1.5 was performed
using Cluster 3.0 and Java tree-view software [22]. Gene
Set Enrichment Analysis (GSEA) v2.07 software was
used to test if previously published gene signatures and
curated pathways were enriched in the data. We used
the inbuilt KEGG, BIOCARTA, REACTOME, gene
ontology, and oncogenic signatures in MsigDB database
and supplemented with curated signatures containing
“cancer”, “metastasis”, “cell cycle”, “repair”, “DNA damage”, and “hypoxia”. We used the default significance
levels to test if significant enrichment was reached with
normalized p-values below 0.05 and with false discovery
rates below 0.25. A previously published dataset (GEO
ID: GSE31684; U133 Plus 2.0 GeneChip) from laser microdissected tumors from 93 cystectomized patients was
retrieved. A total of 69 patients were included in the
analysis, after exclusion of all patients without reported
lymph node status, and all node negative patients without 24 months of follow-up.
Tissue microarray (TMA) analysis
Biopsies from a total of 368 tumors from cystectomy
specimens and from 41 lymph node metastases were incorporated into a TMA. All tumors were reevaluated regarding T-stage and grade by the same uro-pathologist
prior to placement on the TMA. The patients included
and the TMA construction is described earlier [11].
Laser micro dissection, RNA extraction and microarray analysis
Immunohistochemistry and Western blotting
All patient specimens collected at the time of surgery
were split into tissue for pathology and tissue for the
The immunohistochemichal staining procedure was carried out based on the EnVision + TM System HRP (Dako)
Laurberg et al. BMC Cancer 2014, 14:638
/>
Page 3 of 10
as previously described [23]. Antibodies against GEM
(Novus Biologicals # NBP1-58906) diluted 1:150 and
against EDNRA (Abcam #ab76259) diluted 1:800 were
used. The specificity of the antibodies against GEM and
EDNRA was validated by Western blotting using T24 cell
line essentially as described earlier [24].
Scoring of IHC staining
A Hamamatsu Nanozoomer scanner (Hamamatsu Corporation, Hamamatsu City, Japan) was used to scan the
TMA slides, and VIS visualization software (Visiopharm
A/S, Hørsholm, Denmark) was used for visualization of
IHC staining during scoring of the protein expression
intensities. Percentage of positive carcinoma cells was
scored on a continuous scale for each core, and optimal
cut-off values were afterwards defined by ROC curves.
Scoring was performed by two observers blinded to outcome. The first observer scored on a continuous scale,
and the second scored according to the dichotomized
cutoff value generated. Differences in the dichotomized
scorings were reviewed and consensus was reached.
Statistics
Comparisons between the metastatic and non-metastatic
groups were performed using two-sided t-test statistics.
Categorical data was compared in univariate analysis using
the χ2 test and censored data was compared using log-rank
test. Hazard ratios (HR) were estimated using Cox proportional hazard models. Multivariate analysis was performed
separately for each biomarker including only significant
clinical parameter from the univariate analysis. All analyses
were performed using STATA (version 11).
Results
For gene expression profiling we selected 18 primary
tumors and 12 matched lymph node metastases from
18 patients with bladder cancer. Ten patients had at
least one lymph node metastasis at time of cystectomy,
and 6 patients died of bladder cancer. Clinical and
histopathological information for each patient is listed
in Table 1.
Molecular subgroup analysis
Initially, data was filtered, selecting only transcripts with a
variance above 1.5 across all samples (11046 transcripts).
We performed unsupervised hierarchical cluster analysis to
investigate if tumors clustered based on stage or metastatic
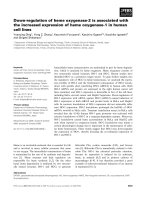
abilities, and if lymph nodes showed a high degree of similarity to the matched primary tumors (Figure 1). Cluster
analysis separated the tumors into two main clusters; one
cluster (cluster A) contained seven primary metastasizing
tumors, three primary non-metastasizing tumors, and eight
lymph nodes, and among these were six of the seven
matched pairs. The other cluster (cluster B) contained five
primary non-metastasizing tumors, five metastasizing primary tumors, and four lymph nodes. Seven of the lymph
nodes clustered together with their matched primary
tumor, indicating a large degree of intra-patient similarity
Table 1 Clinical and histopathological information for each patient used for gene expression profiling
Patient
Gender
T-stage
N status
Relapse
Dead of Bladder cancer
2211
Man
4a
Positive
No
No
Time to relapse (months)
24
1599
Woman
1
Positive
No
No
22
2114
Man
3b
Positive
Yes
Yes
2117
Man
3b
Positive
No
No
2130
Man
1
Positive
Yes
Yes
2163
Man
2
Positive
No
No
2180
Man
3
Positive
Yes
Yes
18
30
2207
Man
4a
Positive
Yes
Yes
9
22
2249
Woman
1
Positive
Yes
Yes
3
2237
Woman
2
Positive
No
No
31
1956
Man
1
Negative
No
No
66
1930
Man
1
Negative
No
No
61
1940
Woman
2
Negative
No
No
1743
Man
1
Negative
Yes
Yes
2036
Man
2
Negative
No
No
77
1874
Man
3b
Negative
No
No
63
1607
Woman
2
Negative
No
No
60
1956
Man
1
Negative
No
No
61
9
Follow up (months)
61
11
14
16
65
13
61
40
57
Laurberg et al. BMC Cancer 2014, 14:638
/>
Page 4 of 10
Figure 1 Unsupervised hierarchical cluster analysis of all samples. Square brackets are used when the coupled tumor and metastasis cluster
together. Green color represents a primary non-metastasizing tumor. Dark green represents a primary non-metastasizing tumor which later develops
lymph node metastases in the abdomen. Blue color represents a primary metastasizing tumor. Red color represents a lymph node metastasis.
in these patients. However, the overall expression patterns
did not show significant separation of the tumors based on
metastatic ability. Most of the muscle-invasive tumors
clustered together in cluster A – as expected.
Gene set enrichment analysis (GSEA)
To investigate the differences between the metastatic
and non-metastatic tumors more specifically, we applied
GSEA for investigating enrichment for previously published signatures regarding key elements in the metastatic process together with enrichment for pathway
elements (Table 2). Interestingly, all signatures regarding
extracellular function, metastasis, hypoxia, proliferation,
and survival were exclusively enriched in metastatic tumors while all signatures regarding repair and cell cycle
were enriched in non-metastatic tumors. Cell signaling
was primarily enriched in metastatic tumors while metabolism was primarily enriched in non-metastatic tumors. In addition, we investigated enrichment for
previously published signatures comparing primary tumors and metastasis [25-27]; both signatures containing
tumors from many different tissues were significantly
enriched in our dataset (Ramaswamy et al., P = 0.02 and
Daves et al., P = 0.03), while the signature from metastatic malignant melanoma was borderline significantly
enriched (Daves et al., P = 0.06).
Laurberg et al. BMC Cancer 2014, 14:638
/>
Page 5 of 10
Table 2 GSEA of published signatures in MsigDB
Enriched in
Enriched in
metastatic tumors non-metastatic tumors
Extracellular function
10
0
Metastasis
7
0
Proliferation and survival
7
0
Hypoxia up
1
0
Cell signaling
20
6
Metabolism
8
13
Hypoxia down
0
1
Repair
0
15
Cell cycle
0
33
Others
17
32
Matched-pair analysis
We used the paired tumors and lymph node metastases
to investigate the intra- and inter-patient similarity.
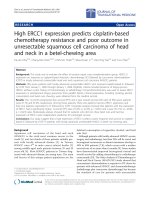
When comparing differences in transcript levels between
the matched primary tumors and metastases using twofold difference as cut-off, we did not find any transcripts
that were differentially expressed in all 12 tumor-lymph
node comparisons (Figure 2). MMP2 was the only gene
that was down-regulated in 11 lymph node metastases,
while 18 transcripts were up or down regulated in 10
lymph node metastases. In general, as observed in the
cluster analysis, the patients show a large heterogeneity
in expression patterns between primary tumors and
lymph node metastases. Using Ingenuity Pathway Analysis we did not identify any general pathway changes
between primary tumors and lymph node metastases,
probably because of this large heterogeneity observed
between patients.
Identification of markers associated with outcome
Because of the large heterogeneity observed and because
of the limited sample size we included a previously published dataset for delineation of markers associated with
outcome (GEO ID: GSE31684). The dataset contained
Affymetrix U133 Plus 2.0 GeneChip data from 69 patients with known lymph node status and at least
24 months of follow-up if no lymph node metastasis was
present at surgery. Separately, for both datasets, we delineated transcripts associated with the presence or absence of metastasis; only transcripts with a mean fold
change difference > 2 and with a P < 0.05 (student’s ttest) were selected. Twelve transcripts up-regulated in
metastasizing tumors passed our selection criteria in
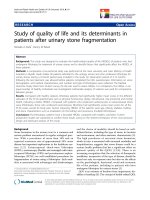
both datasets (Table 3). We selected EDNRA and GEM
(Figure 3) for further validation using immunohistochemistry (IHC). For this we used a tissue microarray
containing 409 core biopsies from both primary tumors
(n = 368) and lymph node metastases (n = 41). Both
GEM and EDNRA protein expression was localized in
the cytoplasm of the cells, and no staining was observed
in normal urothelium or connective tissue cells. IHC
Figure 2 Tumor heterogeneity measures. The distribution of transcripts with more than two-fold difference in tumor-metastasis pair comparisons.
Two lymph node metastases were included from two patients resulting in 12 comparisons in total.
Laurberg et al. BMC Cancer 2014, 14:638
/>
Page 6 of 10
Table 3 Transcripts significantly up-regulated in metastasizing tumors in both cohorts
Non-metastatic vs metastatic
tumors
Transcript
Lymph node metastasis vs non-metastatic
tumors
p-value
FC
Non-metastatic vs metastatic tumors
(Riester et al.)
p-value
FC
p-value
FC
COL6A2
0.0397
1.0967
0.7515
0.1176
0.0461
1.7263
LMCD1
0.0248
1.1631
0.0036
1.7576
0.0196
1.7212
FZD1
0.0287
1.5193
0.0878
1.1318
0.0055
1.0648
MITF
0.0364
1.6083
0.4593
−0.3003
0.0164
1.0783
EDNRA
0.0051
1.6613
0.0181
1.0262
0.0177
1.4840
EBF1
0.0211
1.7592
0.0168
1.8477
0.0149
1.0386
TPST1
0.0199
1.7953
0.1975
0.8709
0.0318
1.1064
AEBP1
0.0242
2.2697
0.0077
1.6563
0.0072
3.0447
PALLD
0.0344
2.3131
0.1163
0.9763
0.0104
1.4558
GEM
0.0121
2.3136
0.0000
3.2533
0.0219
1.5247
PXDN
0.0044
3.1464
0.0042
1.8611
0.0356
1.9232
KITLG
0.0110
3.3621
0.0537
1.6857
0.0323
1.1616
FC = Log 2 fold change differences.
Bold indicates significant p-values when comparing lymph node metastasis and non-metastatic tumors.
scoring was performed by two observers independently,
with an inter-observer agreement of 0.70 (GEM) and of
0.81 (EDNRA), using Cohen’s kappa. The clinical and
histopathological characteristics for the patients included
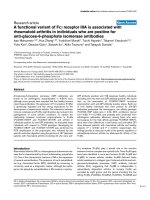
in this cohort are listed in Table 4. High expression of
GEM (P = 0.033; HR = 1.46) and EDNRA (P = 0.046;
HR = 1.60) were significantly associated with decreased
cancer-specific survival (Figure 4). Furthermore, after performing multivariate analysis high EDRNA expression
showed significantly association with decreased cancer-
specific survival (P = 0.046), while GEM showed no significance (P = 0.11). Finally we investigated the similarity
in protein expression between matched primary tumors
and lymph node metastases; 94% of the lymph nodes
showed similar expression as in the primary tumors for
EDNRA and 71% for GEM.
Discussion
The risk of recurrence and later metastasis following
cystectomy is as high as 50% [28] and most patients will
Figure 3 Differences in GEM and EDNRA expression in primary non-metastasizing tumors (PNT), primary metastasizing tumors (PMT),
and lymph nodes metastases (M).
Laurberg et al. BMC Cancer 2014, 14:638
/>
Page 7 of 10
Table 4 Univariate and multivariate Cox regression analysis of disease specific survival as function of molecular
markers
Univariate analysis
Nr. of patients
Multivariate analysis
including EDNRA
Multivariate analysis
including GEM
HR = 1.56 (P=0.007)
HR = 1.62 (P=0.015)
HR = 1.45 (P=0.048)
HR = 1.59 (P<0.001)
HR = 1.28 (P=0.049)
HR = 1.22 (P=0.070)
HR = 3.98 (P<0.001)
HR = 3.82 (P<0.001)
HR = 3.55 (P<0.001)
368
Median Follow-up months (range)
62 (2–96)
Age median (range)
64 (39–79)
Sex
Men
268
Women
100
T-stage
T1
43 (12%)
T2
129 (35%)
T3
146 (40%)
T4
50 (13%)
Lymph node metastases
N0
278 (76%)
N1-3
89 (24%)
Grade
HR = 1.01 (P=0.47)
HR = 1.18 (P=0.78)
Low grade
8 (2%)
High grade
360 (98%)
EDNRA
HR = 1.60 (P=0.046)
High
206 (76%)
Low
65 (24%)
GEM
HR = 1.46 (P=0.032)
High
173 (59%)
Low
120 (41%)
HR = 1.63 (P=0.042)
HR = 1.33 (P=0.11)
Values in bold indicate significant uni- and multivariate analysis (P<0.05).
ultimately succumb to the disease following recurrence
[29]. Therefore, early detection of metastasis and prediction of recurrence risk following cystectomy could ultimately improve survival as better treatment regimens
could be applied. The aim of this study was to identify
markers of lymph node metastasis at (before) cystectomy. We compared gene-expression profiles from 10
primary bladder tumors with 12 matched lymph node
metastases and eight primary tumors without metastasis
to identify markers associated with metastatic disease,
and to test similarity between lymph node metastases
and matched primary tumors. Overall, we found no
large difference in gene expression between the two
patient groups. Furthermore, we found that primary
tumors and corresponding lymph node metastases
showed comparable gene expression profiles in half of
the cases. The reason for this lack of overall difference
between the groups may be caused by tumor heterogeneity, minor sub clones responsible for metastatic ability,
and also by inclusion of tumors of different stages (T1-T4).
Gene set enrichment analysis (GSEA) was used to investigate biological differences between metastasizing and
non-metastasizing tumors. Interestingly, signatures associated with “metastasis”, “extracellular function”,
“proliferation and survival”, and “cell signaling” were
significantly enriched in the metastasizing tumors while
signatures associated with “metabolism”, “cell cycle” and
“DNA repair” were associated with non-metastatic tumors – indicating that the overall biological process
may be different in the two tumor groups. However, due
to the large heterogeneity we were not able to identify
general molecular differences between lymph node metastases and primary tumors.
The tumor heterogeneity (intra and inter) may make
marker identification difficult, and consequently we included additional patient samples from a previously published dataset [20] for delineating significant markers of
outcome. The panel of 12 genes that were significant in
Laurberg et al. BMC Cancer 2014, 14:638
/>
Page 8 of 10
Figure 4 EDNRA (A) and GEM protein (B) expression in the TMA validation cohort. Top: Staining pattern of a positive and a negative core
of EDNRA and GEM. Bottom: Kaplan-Meier survival curves of disease specific survival as a function of marker expression in the patient cohort.
both datasets contained GEM and EDNRA. These genes
were selected for further validation based on significance, difference in expression, expression level, and
based on antibody availability. We found no overlap between our 12 genes and the 21-gene metastasis signature
reported by Smith et al. previously [15], which may reflects multiple factors like cohort heterogeneity and size,
and differences in sampling (laser micro dissection vs
bulk tumor analysis). We found high expression of GEM
and EDNRA to be significantly associated with a decrease in cancer-specific survival, when analyzing the
protein expression on a cohort of 368 patients. Furthermore, high EDNRA was significantly associated with decreased cancer-specific survival in multivariate analysis.
The possible functional roles of EDNRA (endothelin receptor type A) and GEM (GTP binding protein overexpressed in skeletal muscle) in cancer progression and
metastasis are currently unclear. EDNRA and GEM have
not been associated with disease outcome and cancer outcome. GEM is a small GTP-binding protein that plays a
role in regulating Ca2+ channel expression at the cell surface [30]. Furthermore, it is involved in cytoskeletal remodeling in interphase cells and is a spindle-associated
protein required for prober mitotic progression [31].
EDNRA is a G-protein coupled receptor for endothelins
and it is expressed on vascular smooth-muscle cells and
on heart, kidney, and neuronal cells [32].
This study included a limited number of tumors in the
initial characterization of tumor subgroups, and although
we isolated carcinoma cells in primary tumors and lymph
node metastases using laser-micro dissection, the patient
cohort may still be too small to draw firm conclusion regarding molecular subgroups and differences between primary tumors and metastatic lesions. The strength of our
approach is the inclusion of matched lymph node metastasis in the selection of candidate markers for metastasis,
and this is to our knowledge the first study of bladder cancer that compare the lymph nodes to the primary tumors.
Recently, large intra-tumor heterogeneity of several
cancer types has been reported [33-35]. A recent study
of clear cell renal cell carcinomas showed significant
molecular heterogeneity using whole-exome sequencing
of multiple tumor areas [36]. As small cellular subclones may be responsible for the disease progression
and metastasis it may be difficult to identify any good
molecular markers of outcome by analyzing the bulk tumors. Other studies of tumor metastasis in mice have
shown limited overlap in genomic alterations (about 9%)
between primary tumors and metastases [37], indicating
that metastatic lesions probably propagate from small
sub-populations in the primary tumors. Intra-tumor heterogeneity has so far not been addressed in detail in
bladder cancer. However, Li et al. [38] performed wholeexome sequencing of 66 individual cells from a single
Laurberg et al. BMC Cancer 2014, 14:638
/>
muscle invasive tumor, and identified large variation in
mutant genes between the cells. Other groups [39,40] have
recently shown that muscle invasive bladder cancers belong to 4–5 distinct molecular subgroups. Consequently,
future studies of prognostic markers for patients with advanced bladder cancer should include large patient cohorts, stratification according to overall tumor subgroup
and sub-clonal analysis to compensate for the large inter
and intra tumor heterogeneity for these patients.
Page 9 of 10
7.
8.
9.
10.
Conclusion
We observed a high degree of heterogeneity between
primary tumors with and without metastases, and between paired samples of primary tumors and associated
lymph-node metastases. GEM and EDNRA were identified to be promising prognostic markers for patients
with advanced bladder cancer. The clinical relevance of
GEM and EDNRA should be evaluated in independent
prospective studies.
12.
Competing interests
The authors declare that they have no competing interests.
13.
Authors’ contributions
JRL, JBJ, TFØ and LD designed the study; MB and JBJ provide tumor tissue
and clinical data; JRL, JBJ and TS performed the laboratory research; JRL, TS
and LD analyzed data; JRL and LD wrote the paper. All authors read and
approved the final manuscript.
11.
14.
15.
Acknowledgements
The work was also supported The John and Birthe Meyer Foundation; the
Danish Cancer Society; the Ministry of Technology and Science; The Danish
Cancer Biobank (DCB) and the Lundbeck Foundation. Furthermore, our
research has received funding from the European Community’s Seventh
Framework program FP7/2007-2011 under grant agreement n° 201663. We
thank Ms. Pamela Celis, Ms. Margaret Gellett, and Ms. Hanne Steen for
excellent technical assistance.
Author details
1
Department of Molecular Medicine, Aarhus University Hospital,
Brendstrupgaardsvej 100, 8200 Aarhus N, Denmark. 2Department of Urology,
Aarhus University Hospital, Brendstrupgaardsvej 100, 8200 Aarhus N,
Denmark.
Received: 1 April 2014 Accepted: 27 August 2014
Published: 30 August 2014
References
1. Jemal A, Siegel R, Xu J, Ward E: Cancer statistics, 2010. CA Cancer J Clin
2010, 60(5):277–300.
2. Babjuk M, Oosterlinck W, Sylvester R, Kaasinen E, Bohle A, Palou-Redorta J,
Roupret M: EAU guidelines on non-muscle-invasive urothelial carcinoma
of the bladder, the 2011 update. Eur Urol 2011, 59(6):997–1008.
3. Sylvester RJ, van der Meijden AP, Oosterlinck W, Witjes JA, Bouffioux C,
Denis L, Newling DW, Kurth K: Predicting recurrence and progression in
individual patients with stage Ta T1 bladder cancer using EORTC risk
tables: a combined analysis of 2596 patients from seven EORTC trials.
Eur Urol 2006, 49(3):466–477.
4. Stenzl A, Cowan NC, De Santis M, Kuczyk MA, Merseburger AS, Ribal MJ,
Sherif A, Witjes JA: Treatment of muscle-invasive and metastatic bladder
cancer: update of the EAU guidelines. Eur Urol 2011, 59(6):1009–1018.
5. Kaufman E, Fried M: Polypoid lesions following surgical correction of
bladder exstrophy. Endoscopy 2009, 41 Suppl 2:E323.
6. Griffiths G, Hall R, Sylvester R, Raghavan D, Parmar MK: International phase
III trial assessing neoadjuvant cisplatin, methotrexate, and vinblastine
16.
17.
18.
19.
20.
21.
22.
23.
chemotherapy for muscle-invasive bladder cancer: long-term results of
the BA06 30894 trial. J Clin Oncol 2011, 29(16):2171–2177.
Sherif A, Holmberg L, Rintala E, Mestad O, Nilsson J, Nilsson S, Malmstrom
PU: Neoadjuvant cisplatinum based combination chemotherapy in
patients with invasive bladder cancer: a combined analysis of two
Nordic studies. Eur Urol 2004, 45(3):297–303.
Jensen JB, Ulhoi BP, Jensen KM: Evaluation of different lymph node (LN)
variables as prognostic markers in patients undergoing radical
cystectomy and extended LN dissection to the level of the inferior
mesenteric artery. BJU Int 2012, 109(3):388–393.
Matsushita K, Cha EK, Matsumoto K, Baba S, Chromecki TF, Fajkovic H, Sun
M, Karakiewicz PI, Scherr DS, Shariat SF: Immunohistochemical biomarkers
for bladder cancer prognosis. Int J Urol 2011, 18(9):616–629.
Laurberg JR, Brems-Eskildsen AS, Nordentoft I, Fristrup N, Schepeler T, Ulhoi
BP, Agerbaek M, Hartmann A, Bertz S, Wittlinger M, Fietkau R, Rödel C, Borre
M, Jensen JB, Orntoft T, Dyrskjøt L: Expression of TIP60 (tat-interactive
protein) and MRE11 (meiotic recombination 11 homolog) predict
treatment-specific outcome of localised invasive bladder cancer. BJU Int
2012, 110(11):E1228–E1236.
Jensen JB, Munksgaard PP, Sorensen CM, Fristrup N, Birkenkamp-Demtroder
K, Ulhoi BP, Jensen KM, Orntoft TF, Dyrskjot L: High expression of
karyopherin-alpha2 defines poor prognosis in non-muscle-invasive
bladder cancer and in patients with invasive bladder cancer undergoing
radical cystectomy. Eur Urol 2011, 59(5):841–848.
Shariat SF, Tokunaga H, Zhou J, Kim J, Ayala GE, Benedict WF, Lerner SP:
p53, p21, pRB, and p16 expression predict clinical outcome in
cystectomy with bladder cancer. J Clin Oncol 2004, 22(6):1014–1024.
Blaveri E, Simko JP, Korkola JE, Brewer JL, Baehner F, Mehta K, Devries S,
Koppie T, Pejavar S, Carroll P, Waldman FM: Bladder cancer outcome
and subtype classification by gene expression. Clin Cancer Res 2005,
11(11):4044–4055.
Sanchez-Carbayo M, Socci ND, Lozano J, Saint F, Cordon-Cardo C: Defining
molecular profiles of poor outcome in patients with invasive bladder
cancer using oligonucleotide microarrays. J Clin Oncol 2006, 24(5):778–789.
Smith SC, Baras AS, Dancik G, Ru Y, Ding KF, Moskaluk CA, Fradet Y,
Lehmann J, Stöckle M, Hartmann A, Lee JK, Theodorescu D: A 20-gene
model for molecular nodal staging of bladder cancer: development and
prospective assessment. Lancet Oncol 2011, 12(2):137–143.
Perou CM, Sørlie T, Eisen MB, van de Rijn M, Jeffrey SS, Rees CA, Pollack JR,
Ross DT, Johnsen H, Akslen LA, Fluge O, Pergamenschikov A, Williams C,
Zhu SX, Lønning PE, Børresen-Dale AL, Brown PO, Botstein D: Molecular
portraits of human breast tumours. Nature 2000, 406(6797):747–752.
Sørlie T, Perou CM, Tibshirani R, Aas T, Geisler S, Johnsen H, Hastie T, Eisen
MB, van de Rijn M, Jeffrey SS, Thorsen T, Quist H, Matese JC, Brown PO,
Botstein D, Lønning PE, Børresen-Dale AL: Gene expression patterns of
breast carcinomas distinguish tumor subclasses with clinical
implications. Proc Natl Acad Sci U S A 2001, 98(19):10869–10874.
van't Veer LJ, Dai H, van de Vijver MJ, He YD, Hart AA, Mao M, Peterse HL, van
der Kooy K, Marton MJ, Witteveen AT, Schreiber GJ, Kerkhoven RM, Roberts C,
Linsley PS, Bernards R, Friend SH: Gene expression profiling predicts clinical
outcome of breast cancer. Nature 2002, 415(6871):530–536.
Ellis MJ, Suman VJ, Hoog J, Lin L, Snider J, Prat A, Parker JS, Luo J,
DeSchryver K, Allred DC, Esserman LJ, Unzeitig GW, Margenthaler J, Babiera
GV, Marcom PK, Guenther JM, Watson MA, Leitch M, Hunt K, Olson JA:
Randomized phase II neoadjuvant comparison between letrozole,
anastrozole, and exemestane for postmenopausal women with estrogen
receptor-rich stage 2 to 3 breast cancer: clinical and biomarker
outcomes and predictive value of the baseline PAM50-based intrinsic
subtype–ACOSOG Z103. J Clin Oncol 2011, 29(17):2342–2349.
Riester M, Taylor JM, Feifer A, Koppie T, Rosenberg JE, Downey RJ, Bochner BH,
Michor F: Combination of a novel gene expression signature with a clinical
nomogram improves the prediction of survival in high-risk bladder cancer.
Clin Cancer Res 2012, 18(5):1323–1333.
Irizarry RA, Hobbs B, Collin F, Beazer-Barclay YD, Antonellis KJ, Scherf U,
Speed TP: Exploration, normalization, and summaries of high density
oligonucleotide array probe level data. Biostatistics 2003, 4(2):249–264.
Eisen MB, Spellman PT, Brown PO, Botstein D: Cluster analysis and display
of genome-wide expression patterns. Proc Natl Acad Sci U S A 1998,
95(25):14863–14868.
Heeboll S, Borre M, Ottosen PD, Andersen CL, Mansilla F, Dyrskjot L, Orntoft
TF, Torring N: SMARCC1 expression is upregulated in prostate cancer and
Laurberg et al. BMC Cancer 2014, 14:638
/>
24.
25.
26.
27.
28.
29.
30.
31.
32.
33.
34.
35.
36.
37.
38.
positively correlated with tumour recurrence and dedifferentiation.
Histol Histopathol 2008, 23(9):1069–1076.
Schepeler T, Mansilla F, Christensen LL, Orntoft TF, Andersen CL: Clusterin
expression can be modulated by changes in TCF1-mediated Wnt signaling.
J Mol Signal 2007, 2:6.
Daves MH, Hilsenbeck SG, Lau CC, Man TK: Meta-analysis of multiple
microarray datasets reveals a common gene signature of metastasis in
solid tumors. BMC Med Genomics 2011, 4:56.
Ramaswamy S, Ross KN, Lander ES, Golub TR: A molecular signature of
metastasis in primary solid tumors. Nat Genet 2003, 33(1):49–54.
Jaeger J, Koczan D, Thiesen HJ, Ibrahim SM, Gross G, Spang R, Kunz M:
Gene expression signatures for tumor progression, tumor subtype, and
tumor thickness in laser-microdissected melanoma tissues. Clin Cancer
Res 2007, 13(3):806–815.
Shariat SF, Karakiewicz PI, Palapattu GS, Lotan Y, Rogers CG, Amiel GE,
Vazina A, Gupta A, Bastian PJ, Sagalowsky AI, Schoenberg MP, Lerner SP:
Outcomes of radical cystectomy for transitional cell carcinoma of the
bladder: a contemporary series from the Bladder Cancer Research
Consortium. J Urol 2006, 176(6 Pt 1):2414–2422. discussion 2422.
Rink M, Lee DJ, Kent M, Xylinas E, Fritsche HM, Babjuk M, Brisuda A, Hansen J,
Green DA, Aziz A, Cha EK, Novara G, Chun FK, Lotan Y, Bastian PJ, Tilki D,
Gontero P, Pycha A, Baniel J, Mano R, Ficarra V, Trinh QD, Tagawa ST,
Karakiewicz PI, Scherr DS, Sjoberg DD, Shariat SF, Bladder Cancer Research
Consortium: Predictors of cancer-specific mortality after disease recurrence
following radical cystectomy. BJU Int 2013, 111(3 Pt B):E30–E36.
Beguin P, Nagashima K, Gonoi T, Shibasaki T, Takahashi K, Kashima Y,
Ozaki N, Geering K, Iwanaga T, Seino S: Regulation of Ca2+ channel
expression at the cell surface by the small G-protein kir/Gem.
Nature 2001, 411(6838):701–706.
Andrieu G, Quaranta M, Leprince C, Hatzoglou A: The GTPase Gem and its
partner Kif9 are required for chromosome alignment, spindle length
control, and mitotic progression. FASEB J 2012, 26(12):5025–5034.
Yu JC, Pickard JD, Davenport AP: Endothelin ETA receptor expression in
human cerebrovascular smooth muscle cells. Br J Pharmacol 1995,
116(5):2441–2446.
Gerlinger M, Rowan AJ, Horswell S, Larkin J, Endesfelder D, Gronroos E, Martinez
P, Matthews N, Stewart A, Tarpey P, Varela I, Phillimore B, Begum S, McDonald
NQ, Butler A, Jones D, Raine K, Latimer C, Santos CR, Nohadani M, Eklund AC,
Spencer-Dene B, Clark G, Pickering L, Stamp G, Gore M, Szallasi Z, Downward J,
Futreal PA, Swanton C: Intratumor heterogeneity and branched evolution
revealed by multiregion sequencing. N Engl J Med 2012, 366(10):883–892.
Lohr JG, Stojanov P, Carter SL, Cruz-Gordillo P, Lawrence MS, Auclair D,
Sougnez C, Knoechel B, Gould J, Saksena G, Cibulskis K, McKenna A,
Chapman MA, Straussman R, Levy J, Perkins LM, Keats JJ, Schumacher SE,
Rosenberg M, Multiple Myeloma Research C, Getz G, Golub TR: Widespread
genetic heterogeneity in multiple myeloma: implications for targeted
therapy. Cancer Cell 2014, 25(1):91–101.
Shah SP, Roth A, Goya R, Oloumi A, Ha G, Zhao Y, Turashvili G, Ding J, Tse K,
Haffari G, Bashashati A, Prentice LM, Khattra J, Burleigh A, Yap D, Bernard V,
McPherson A, Shumansky K, Crisan A, Giuliany R, Heravi-Moussavi A, Rosner
J, Lai D, Birol I, Varhol R, Tam A, Dhalla N, Zeng T, Ma K, Chan SK, et al: The
clonal and mutational evolution spectrum of primary triple-negative
breast cancers. Nature 2012, 486(7403):395–399.
Gerlinger M, Horswell S, Larkin J, Rowan AJ, Salm MP, Varela I, Fisher R,
McGranahan N, Matthews N, Santos CR, Martinez P, Phillimore B, Begum S,
Rabinowitz A, Spencer-Dene B, Gulati S, Bates PA, Stamp G, Pickering L, Gore
M, Nicol DL, Hazell S, Futreal PA, Stewart A, Swanton C: Genomic architecture
and evolution of clear cell renal cell carcinomas defined by multiregion
sequencing. Nat Genet 2014, 46(3):225–233.
Wu X, Northcott PA, Dubuc A, Dupuy AJ, Shih DJ, Witt H, Croul S, Bouffet E,
Fults DW, Eberhart CG, Garzia L, Van Meter T, Zagzag D, Jabado N,
Schwartzentruber J, Majewski J, Scheetz TE, Pfister SM, Korshunov A, Li XN,
Scherer SW, Cho YJ, Akagi K, MacDonald TJ, Koster J, McCabe MG, Sarver AL,
Collins VP, Weiss WA, Largaespada DA, et al: Clonal selection drives
genetic divergence of metastatic medulloblastoma. Nature 2012,
482(7386):529–533.
Li Y, Xu X, Song L, Hou Y, Li Z, Tsang S, Li F, Im KM, Wu K, Wu H, Ye X, Li G, Wang
L, Zhang B, Liang J, Xie W, Wu R, Jiang H, Liu X, Yu C, Zheng H, Jian M, Nie L,
Wan L, Shi M, Sun X, Tang A, Guo G, Gui Y, Cai Z, et al: Single-cell sequencing
analysis characterizes common and cell-lineage-specific mutations in a
muscle-invasive bladder cancer. Gigascience 2012, 1(1):12.
Page 10 of 10
39. Cancer Genome Atlas Research N: Comprehensive molecular characterization
of urothelial bladder carcinoma. Nature 2014, 507(7492):315–322.
40. Sjödahl G, Lauss M, Lövgren K, Chebil G, Gudjonsson S, Veerla S, Patschan O,
Aine M, Fernö M, Ringnér M, Månsson W, Liedberg F, Lindgren D, Höglund
M: A molecular taxonomy for urothelial carcinoma. Clin Cancer Res 2012,
18(12):3377–3386.
doi:10.1186/1471-2407-14-638
Cite this article as: Laurberg et al.: High expression of GEM and EDNRA
is associated with metastasis and poor outcome in patients with
advanced bladder cancer. BMC Cancer 2014 14:638.
Submit your next manuscript to BioMed Central
and take full advantage of:
• Convenient online submission
• Thorough peer review
• No space constraints or color figure charges
• Immediate publication on acceptance
• Inclusion in PubMed, CAS, Scopus and Google Scholar
• Research which is freely available for redistribution
Submit your manuscript at
www.biomedcentral.com/submit