Response of phosphate solubilising inoculants (Jumpstart) on biochemistry and yield of rice (Oryza sativa L.)
Bạn đang xem bản rút gọn của tài liệu. Xem và tải ngay bản đầy đủ của tài liệu tại đây (256.96 KB, 9 trang )
Int.J.Curr.Microbiol.App.Sci (2017) 6(6): 1529-1537
International Journal of Current Microbiology and Applied Sciences
ISSN: 2319-7706 Volume 6 Number 6 (2017) pp. 1529-1537
Journal homepage:
Original Research Article
/>
Response of Phosphate Solubilising Inoculants (Jumpstart) on
Biochemistry and Yield of Rice (Oryza sativa L.)
M. Geethalakshmi1, V. Ravichandran1*, P. Boominathan2 and P. Jeyakumar2
1
Department of Rice, Tamil Nadu Agricultural University, Coimbatore-641003,
Tamil Nadu, India
2
Department of Crop Physiology, Tamil Nadu Agricultural University, Coimbatore-641003,
Tamil Nadu, India
*Corresponding author
ABSTRACT
Keywords
Phosphorus,
Rice,
Physiology,
Chlorophyll.
Article Info
Accepted:
21 May 2017
Available Online:
10 June 2017
Phosphorus plays a significant role in several physiological and biochemical activities in
plants. Phosphorus in soils is immobilized due to formation of insoluble complexes such as
iron and aluminium hydrous oxides and calcium carbonate. Phosphate-solubilizing
microorganisms (PSM) play an important role in insoluble phosphates into soluble forms
involves processes of acidulation, ion chelation and exchange reactions. Present study, a
field experiment was carried out to study the physiological and yield response of
phosphate solubilising inoculants (JumpStart) on rice variety CO 47 under machine
transplanting rice ecosystem. The present study revealed that the treatment P3S3 (100% P +
JumpStart 10E5) was recorded increased total chlorophyll (3.03 mg g-1) and higher leaf
carbohydrate (82.06 mg g-1) at 50% flowering stage. The lower enzyme activity of acid
phosphatase (0.022 µmol of pNPP g-1 min-1) and ATPase (29.37 µg of Pi g-1 h-1) were
recorded by treatment P3S3 (100% P + JumpStart 10E5) over control at 50% flowering
stage. The uptake of phosphorus by plants was found higher in P3S3 treatment observed at
all stages of crop growth. At 50% flowering stage, phosphorus (69.26 kg ha -1), uptake
were observed higher in P3S3 treatment than control. The maximum grain yield of 8426 kg
ha-1 was registered by P3S3 (100% P + JumpStart) with an increase of 16.4 per cent over
control. This might be due to the significant increment of major yield components such as
number of productive tillers per plant, panicle dry weight and number of grains per panicle
by the application of 100 % recommended phosphorus with seed treatment of JumpStart
10E5.
Introduction
Phosphorus is an essential nutrient required
by rice (Kim et al., 1998) and it has a defined
role in plant metabolisms such as root
development,
photosynthesis,
nutrient
transport within the plant, Meiosis,
phospholipid in cell walls and reproductive
parts of plant (Rasipour and Asgharzadeh,
2007). The judicious and proper use of
phosphorous in rice markedly increases the
yield and quality of rice. Without adequate
supply of plant with phosphorous, plant
cannot attain its maximum yield.
Low level of available P in soils is one of the
major constraints for rice production in the
world. This is particularly apparent under
1529
Int.J.Curr.Microbiol.App.Sci (2017) 6(6): 1529-1537
upland conditions commonly characterized by
poorly fertile, erodible, badly leached, highly
acidic, and P-fixing soils, normally with little
or no fertilizer applied (IRRI, 1997). Even
under lowland conditions, P deficiency is
identified as a main factor limiting the
performance of modern rice varieties to
approach their optimum yields. Application of
P fertilizers is a quick remedy for P
deficiency in rice soils. However, nonorganic
fertilizers are not always available to a large
sector of poor rice farmers. Besides, some rice
soils that are low in available P can also fix it
into a highly less soluble mineral. Dobermann
et al., (1998) estimated that more than 90% of
the added fertilizer P may rapidly be
transformed to P forms that are not easily
available to plants.
The microorganisms perform an important
role in agriculture by supplying nutrients to
plants and reduce the demand of chemical
fertilizers (Cakmakci et al., 2006).
Particularly,
phosphate
solubilizing
microorganisms are able to solubilize
unavailable soil P and enhance the yield of
crops (Adesemoye and Kloepper, 2009).
Phosphate
solubilizing
microorganisms
(PSMs) are ubiquitous, and their numbers
vary from soil to soil.
The use of P solubilizing microorganisms
improves the soil fertility and increase the
crop production to fulfill the requirement.
Further,
the
efficiency
of
these
microorganisms to meet P requirement of
crops will depend greatly on their impact
under
practical
farming
conditions.
Penicillium bilaii (a phosphorus solubilising
fungus) is a newly isolated soil fungus that
has profound effect on solubilization of
phosphorus. The efficacy of Penicillium bilaii
has been test verified in various crops such as
wheat, canola, chick pea, mustard and lentil
elsewhere. However, the usefulness of
Penicillium bilaii has not been tested in rice
crop under machine transplanting system.
Keeping this in view, the present study was
conducted at field level to evaluate the
performance of different inoculation of
Penicillium bilaii in combination with three
levels
of
phosphatic
fertilizer
on
biochemistry, P uptake and yield of rice.
Materials and Methods
The Present investigation was carried out in
the field no. H7a of Department of Rice,
Tamil
Nadu
Agricultural
University,
Coimbatore during Kharif season of 2015.
Rice variety CO 47 seed material collected
from Department of Rice. Before sowing,
three bags (1 kg each) of rice seeds were
soaked for 24 hours. Seeds were then seed
treated with three different population of
Phosphate
solubilising
inoculants
–
Penicillium bilaii (Jump Start) at the rate of
160 mg per Kg of seeds and 6 ml of water
was added and agitated for one minute as per
the treatments and compared with the
recommended seed treatment of Azophos at
the rate of 20g kg-1 of seeds and control (No
seed treatment).The experimental field with
provisions made for draining excess water
was well irrigated, puddled and leveled by
leveler to minimize undulations, field
conditions were maintained for two days to
make the land convenient for machine
transplanting.
The field experiment was laid out in split plot
design with three replications. The treatments
are as follows three main plot of three
different P levels P1- 0 % (0 kgP ha-1), P2- 50
% P (25 kg P ha-1) and P3-100%P (50 kgP ha1
) (Recommended dose). Sub plot of five
different seed treatments S1- No Seed
Treatment, S2- JumpStart 10E4 (0.00967 mg
kg-1 of seeds), S3-JumpStart 10E5 (0.0967
mg kg-1of seeds), S4- JumpStart 10E6 (9.667
mg kg-1 of seeds) and S5- Azophos at the 20g
1530
Int.J.Curr.Microbiol.App.Sci (2017) 6(6): 1529-1537
kg-1 of seeds. Five plants were selected at
different growth stages for recording
observation. Total Chlorophyll content in
leaves was estimated by using the method
described by Hiscox and Israelstam (1979)
and expressed in mg g-1 fresh weight. The
total carbohydrate content of the leaf and root
samples were estimated by following the
method suggested by Fales (1951) and all
expressed in mg g-1 on dry weight basis.
Acid phosphatase activity of the seedling roots
were determined by the method of Hooley
(1984).Chlorophyll content in leaves was
estimated by using the method described by
Hiscox and Israelstam (1979) and expressed
in mg g-1 fresh weight. Adenosine
Triphosphatase activity of the rice root was
determined by the method of Umbreit et al.,
(1964) and the enzyme activity was expressed as
μg of Pi/g fresh weight/hr
Uptake of phosphorus nutrients were
calculated as the product of total dry matter
production (kg ha-1) with the corresponding
nutrient content of the plant parts at active
tillering (AT), panicle initiation (PI), flowering (F)
and grain filling (GF) stage (Hartemink et al.,
2000).
The yield and its components were recorded
at harvest (Yoshida et al., 1972). The data
collected were subjected to statistical analysis
in split plot design by Gomez and Gomez
(1984).
Results and Discussion
Total chlorophyll
Total chlorophyll content is an imperative
indicator of crop growth. There was a general
decrease in chlorophyll content observed from
flowering to grain filling stage. Hence,
measurement of chlorophyll indirectly
explains the efficiency of the photosynthesis
and
photosynthate
production.
Total
chlorophyll content was steadily increased up
to 50% flowering stage (3.03 mg g-1) and
thereafter it decreased at grain filling stage
(2.13 mg g-1) due to initiation of senescence
phase (Table 1). During senescence, the total
chlorophyll was altered due to shift in the
macro nutrient concentration. The content of
total chlorophyll content of leaf decreased due
to deficiency of phosphorus in 0% P with no
seed treatment, which is 25% low when
compared to 100% P + JumpStart 10E5 at
50% flowering stage. The increase of
chlorophyll content is due to enhanced
absorption of irons from rhizosphere and
increased translocation to the shoot without
any chelation inside the root (Wang et al.,
2009). Similar findings were reported by
Mehrvarz and Chaichi (2008) that increase in
chlorophyll content and photosynthesis rates
with inoculation of PSB in aerobic rice.
Total carbohydrate
Total carbohydrate includes all those
carbohydrates which can be used in the plant
body as a source of energy or as building
material. The determination of the total
carbohydrate content is of greater significance
than that of individual carbohydrates. In this
study, increased amount of leaf carbohydrate
was seen in P3S3 (100% P + JumpStart 10E4)
during 50% flowering stage.
The control treatment, P1S1 had only 52.04
mg g-1 of leaf carbohydrate which is 57.69%
lower than P3S3 treatment (Table 2). This
increase due to higher solubilizing ability of
Penicillium bilaii combined with 100% P
application increased the availability of
phosphorus in soil resulted in higher leaf
carbohydrate content (Prasanna, 2013).
Degroot et al., (2003) found a reduction in
starch and soluble sugars with decreasing
phosphorus application. Low phosphorus
condition largely affects the carbohydrate
1531
Int.J.Curr.Microbiol.App.Sci (2017) 6(6): 1529-1537
content in tomato (Ramezan Ali Khavari,
2008).
Adenosine
activity
Acid phosphatase enzyme activity
Light energy absorbed by chlorophyll is
converted into stable chemical energy and
drive ATP formation via ATPase in the
chloroplasts. ATPase is the metabolic enzyme
integral to ATP hydrolysis and ATP serve to
transport chemical energy in cell to drive
metabolism (Pederson and Carafoli, 1987).
Root ATPase activity was greatly influenced
by different P levels and Penicillium bilaii (a
phosphorus solubilising fungus) in our study.
The values were found to increase from active
tillering stage to 50% flowering stage.
However, the value was higher in 0% P than
at 50% and 100% P levels. At 50% flowering
stage the ATPase activity at 0% P was 57.48
and 48.9% higher in comparison with 100% P
levels (Table 4). Hong Shen et al., (2006)
found that P starvation enhanced the activity
of plasma membrane H+-ATPase in soybean
roots.
Acid phosphatase enzyme activity is
responsible for P hydrolysis from organic
compounds, favouring P mobilization and
translocation. An increase in root phosphatase
activity was often correlated with decrease in
phosphorus level in root as well as leaf
(Muthaiya, 2010). In this study, the treatment
with 0% P + No seed treatment at 50%
flowering stage recorded higher root acid
phosphatase activity, which is 84.93% higher
than 100 % P + JumpStart 10E5 (P3S3) (Table
3). Yun et al., (2001) found that the acid
phosphatase enzyme secretion from roots
enhanced protein release to acidify the
rhizophere and mobilize phosphorus which
improves the acquisition and reutilization,
thus helping the plants to grow under P deficit
conditions. Jeong Hyun Lim et al., (2003)
reported that acid phosphatases (APases) play
a role in the release of phosphate in organic
complexes in soil.
triphosphatase
(ATPase)
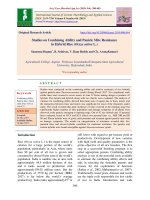
Fig.1 Effect of P levels and Penicillium bilaii inoculants on grain yield (kg/ha) of rice
1532
Int.J.Curr.Microbiol.App.Sci (2017) 6(6): 1529-1537
Table.1 Effect of P levels and Penicillium bilaii inoculants on total chlorophyll
(mg g-1) at different growth stages of rice
Treatments
P1S1
P1S2
P1S3
P1S4
P1S5
P2S1
P2S2
P2S3
P2S4
P2S5
P3S1
P3S2
P3S3
P3S4
P3S5
Mean
S at P SEd
CD (P= 0.05)
P1
P2
0% Phosphorus
50% Phosphorus
P3
S1
S2
AT
(40 DAS)
1.23
1.38
1.42
1.36
1.32
1.35
1.50
1.58
1.44
1.40
1.43
1.62
1.66
1.54
1.47
1.45
0.0466
0.0961
PI
(55 DAS)
1.75
2.06
2.25
1.91
1.84
1.87
2.18
2.39
2.05
1.94
1.95
2.31
2.57
2.27
2.16
2.10
0.0041
0.0085
F
(85 DAS)
2.42
2.64
2.76
2.58
2.46
2.51
2.76
2.87
2.65
2.58
2.63
2.85
3.03
2.72
2.66
2.67
0.0033
0.0069
100% Phosphorus
No seed treatment
JumpStart 10E4 (0.097 g/kg of seed)
S3
S4
S5
GF
(105 DAS)
1.78
1.87
1.90
1.85
1.84
1.83
1.89
1.95
1.88
1.86
1.87
2.03
2.13
1.98
1.93
1.91
0.0226
0.0466
Mean
1.80
1.99
2.08
1.93
1.87
1.89
2.08
2.20
2.01
1.95
1.97
2.20
2.35
2.13
2.06
JumpStart 10E5 (0.966 g/kg of seed)
JumpStart 10E6 (9.662 g/kg of seed)
Azophos (20 g/kg of seed)
Table.2 Effect of P levels and Penicillium bilaii inoculants on leaf carbohydrate content
(mg g-1) at different growth stages of rice
Treatments
P1S1
P1S2
P1S3
P1S4
P1S5
P2S1
P2S2
P2S3
P2S4
P2S5
P3S1
P3S2
P3S3
P3S4
P3S5
Mean
S at P SEd
CD (P= 0.05)
P1
P2
0% Phosphorus
50% Phosphorus
P3
S1
S2
AT
(40 DAS)
25.30
37.10
42.50
33.58
30.20
31.70
44.24
53.57
36.21
34.78
38.23
52.05
62.36
46.02
41.25
40.61
0.131
0.271
PI
(55 DAS)
42.01
52.34
57.19
48.03
42.25
48.43
60.12
68.46
56.26
52.32
54.05
66.45
74.65
62.06
58.40
56.20
0.123
0.254
F
(85 DAS)
52.04
60.23
67.32
58.02
56.12
61.39
71.33
78.04
65.21
63.54
68.56
78.21
82.06
73.42
70.29
67.05
0.110
0.227
100% Phosphorus
No seed treatment
JumpStart 10E4 (0.097 g/kg of seed)
1533
S3
S4
S5
GF
(105 DAS)
40.21
48.31
53.64
45.03
43.12
45.07
57.43
64.24
53.67
48.10
52.09
64.25
73.69
60.26
57.44
53.77
0.118
0.243
Mean
39.89
49.50
55.16
46.17
42.92
46.65
58.28
66.08
52.84
49.69
53.23
65.24
73.19
60.44
56.85
JumpStart 10E5 (0.966 g/kg of seed)
JumpStart 10E6 (9.662 g/kg of seed)
Azophos (20 g/kg of seed)
Int.J.Curr.Microbiol.App.Sci (2017) 6(6): 1529-1537
Table.3 Effect of P levels and Penicillium bilaii inoculants on acid phosphatase activity
(μmol of pNPP g-1 min-1) at different growth stages of rice
Treatments
P1S1
P1S2
P1S3
P1S4
P1S5
P2S1
P2S2
P2S3
P2S4
P2S5
P3S1
P3S2
P3S3
P3S4
P3S5
Mean
S at P SEd
CD (P= 0.05)
P1
P2
0% Phosphorus
50% Phosphorus
P3
S1
S2
AT
(40 DAS)
0.081
0.055
0.041
0.060
0.074
0.068
0.047
0.036
0.053
0.061
0.045
0.031
0.024
0.033
0.037
0.050
0.00975
0.02013
PI
(55 DAS)
0.131
0.064
0.052
0.097
0.104
0.114
0.051
0.042
0.063
0.082
0.091
0.046
0.028
0.051
0.055
0.071
0.00076
0.00156
F
(85 DAS)
0.146
0.084
0.070
0.096
0.125
0.132
0.063
0.048
0.089
0.103
0.115
0.058
0.022
0.074
0.095
0.088
0.00066
0.00136
100% Phosphorus
No seed treatment
JumpStart 10E4 (0.097 g/kg of seed)
S3
S4
S5
GF
(105 DAS)
0.117
0.061
0.054
0.083
0.102
0.106
0.045
0.039
0.053
0.087
0.082
0.038
0.027
0.041
0.062
0.066
0.00045
0.00092
Mean
0.119
0.066
0.054
0.084
0.101
0.105
0.052
0.041
0.065
0.083
0.083
0.043
0.025
0.050
0.062
0.069
JumpStart 10E5 (0.966 g/kg of seed)
JumpStart 10E6 (9.662 g/kg of seed)
Azophos (20 g/kg of seed)
Table.4 Effect of P levels and Penicillium bilaii inoculants on ATPase enzyme activity
(μg of Pi g-1 h-1) at different growth stages of rice
Treatments
P1S1
P1S2
P1S3
P1S4
P1S5
P2S1
P2S2
P2S3
P2S4
P2S5
P3S1
P3S2
P3S3
P3S4
P3S5
Mean
S at P SEd
CD (P= 0.05)
P1
P2
0% Phosphorus
50% Phosphorus
P3
S1
S2
AT
(40 DAS)
21.41
17.47
13.39
18.27
20.17
19.04
15.54
10.71
16.48
18.48
17.53
12.57
8.38
13.85
15.54
15.92
0.946
1.953
PI
(55 DAS)
33.22
28.16
25.62
30.73
31.27
30.92
24.80
19.44
26.46
28.52
27.49
19.66
15.63
22.15
26.44
26.03
1.116
2.302
F
(85 DAS)
57.48
52.66
49.86
54.59
56.15
54.21
43.34
37.29
48.47
53.94
49.74
35.35
29.37
40.91
46.09
47.30
1.594
3.289
100% Phosphorus
No seed treatment
JumpStart 10E4 (0.097 g/kg of seed)
1534
S3
S4
S5
GF
(105 DAS)
26.85
23.51
18.55
21.84
25.07
24.68
19.37
14.78
20.47
21.52
20.24
16.48
12.67
18.39
19.69
20.27
1.005
2.075
Mean
34.74
30.45
26.86
31.36
33.17
32.21
25.76
20.56
27.97
30.62
28.75
21.02
16.51
23.83
26.94
27.38
JumpStart 10E5 (0.966 g/kg of seed)
JumpStart 10E6 (9.662 g/kg of seed)
Azophos (20 g/kg of seed)
Int.J.Curr.Microbiol.App.Sci (2017) 6(6): 1529-1537
Table.5 Effect of P levels and Penicillium bilaii inoculants on phosphorus uptake
(kg ha-1) at different growth stages of rice
Treatments
P1S1
P1S2
P1S3
P1S4
P1S5
P2S1
P2S2
P2S3
P2S4
P2S5
P3S1
P3S2
P3S3
P3S4
P3S5
Mean
S at P SEd
CD (P= 0.05)
P1
P2
0% Phosphorus
50% Phosphorus
P3
S1
S2
AT
(40 DAS)
5.91
11.78
16.27
8.55
6.20
10.53
17.30
24.74
11.74
9.84
12.01
23.43
34.75
17.47
14.64
15.01
0.128
0.264
PI
(55 DAS)
21.67
36.16
42.50
30.27
25.46
27.71
46.68
58.88
38.75
34.17
39.61
52.40
65.85
44.67
40.45
40.35
0.162
0.334
F
(85 DAS)
38.99
68.20
75.33
58.13
46.59
49.24
78.67
84.08
65.18
58.43
65.86
86.70
92.91
77.85
68.57
67.65
0.218
0.450
100% Phosphorus
No seed treatment
JumpStart 10E4 (0.097 g/kg of seed)
The plasma membrane derived from active
proteoid roots of P-deficient plants showed a
more than two times higher ATPase activity
than P-sufficient roots. Ullrich et al., (1984)
reported that a decrease in cytoplasmic pH and
membrane depolarization stimulate a plasma
membrane H+-ATPase that pumps protons out
of the cell to maintain the intracellular pH and
thus provides the proton driving force for Pi
uptake. Organic acids are a common constituent
and are effective in releasing soil P through a
number of mechanisms. It includes reduction in
rhizosphere pH that occurs in response to
organic anion exudation, wherein H+ ions are
released
as
counter
ions
(Ryan and Angus, 2003).
Phosphorus uptake
Phosphorus is absorbed mainly during the
vegetative growth; therefore most of its
absorbed from is re-translocated in fruits and
seed during the reproductive stages. Phosphorus
S3
S4
S5
GF
(105 DAS)
25.58
40.35
48.20
36.56
32.35
38.16
47.67
53.15
41.78
38.73
45.92
54.49
67.96
48.45
43.41
44.18
0.128
0.264
Mean
23.04
39.12
45.58
33.38
27.65
31.41
47.58
55.21
39.36
35.29
40.85
54.26
65.37
47.11
41.77
JumpStart 10E5 (0.966 g/kg of seed)
JumpStart 10E6 (9.662 g/kg of seed)
Azophos (20 g/kg of seed)
uptake at active tillering stage is crucial to rice
crop for higher grain yield. In the present study,
at active tillering stage, phosphorus uptake was
increased in 100% P level combined with
Penicillium bilaii (JumpStart 10E5) seed
treatment than control treatment by more than
four times which is 71.5 % higher than control
treatments (P1S1) as shown in (Table 5). This
might be due to phosphorus solubilizing fungal
inoculation which produced significant amount
of organic acids and have enormous potential
for increasing available P to the plant vicinity,
simultaneously enhanced P uptake. The organic
acid produced by Penicillium bilaii (Phosphorus
Solubilising Fungus) complexes with the metal
cations viz., calcium, aluminium, and iron,
thereby helping in solubilization of native
phosphorus and reduction in phosphorus
sorption. Similar to the result of present study
phosphorus solubilizing bacteria (Bacillus
subtills), Phosphorus solubilizing fungus
(Aspergillus awamori) and AM fungus (Glomus
fasciculatum) increasing growth, N and P
1535
Int.J.Curr.Microbiol.App.Sci (2017) 6(6): 1529-1537
uptake in green gram (Zaidi and Khan, 2006).
The data on the performance of phosphorus
levels revealed a significant positive relation of
grain yield with the increased phosphorus
application. The highest grain yield (16.4 %)
was recorded in P3S3 (100% P + JumpStart
10E4) compared to control treatment (P1S1)
(Fig. 1). Similar to the present results, Xieet al.,
(2007) reported that application of phosphorus
fertilizer increased straw yield (9.4 t ha-1)
compared to control treatment (8.7 t ha-1) in rice
crop.
The higher levels of dry matter production and
grain yield upon fungal inoculation was mainly
due to higher enzyme activities in the
rhizosphere and better nutrient availability
besides the production of the plant growth
regulators by PSM. Increase in the grain yield
and straw yield of wheat was also observed
when inoculated with phosphorus solubilising
microorganism (PSM) (Kumar et al., 1999).
In conclusion, application of recommended P
fertilizer (50 kg ha-1) along with the seed
treatment of JumpStart 10E5 (0.966 g/ kg of
seed) under machine transplanting system is
suggested as a sustainable way for increasing
rice yield. PSFs mainly Penicillium bilaiiis very
effective for increasing plant available
Phosphorus in soil as well as the growth and
yield of rice. Therefore, the use of the
Penicillium bilaii through bio-inoculants has
enormous potential for making use of ever
increasing fixed Phosphorus in the soil and
natural reserves of phosphate rocks. There is a
need to explore Penicillium bilaii with greater
efficiency and synergy with other microbes
interacting with plants.
References
Adesemoye, A.O. and J.W. Kloepper. 2009.
Plant-microbes interactions in enhanced
fertilizer-use efficiency. Appl. Microbio.
Biotech., 85: 1-12.
Cakmakci R., F. Donmez, A. Aydın and F.
Şahin.2006. Growth promotion of plants
by plant growth-promoting rhizobacteria
under greenhouse and two different field
soil conditions. Soil Biol. Biochem.,
38:1482– 1487.
Degroot, C. C., R.V.D. Boogaard, L. F. M.
Marcelis, J. Harbinson and H.
Lambers.2003. Contrasting effects of N
and P deprivation on the regulation of
photosynthesis in tomato plants in
relation to feedback limitation. J. Exp.
Bot., 54: 1957-1967.
Dobermann, A., K.G. Cassman, C.P.
Mamariland
J.E.
Sheehy.
1998.
Management of phosphorus, potassium
and sulfur in intensive irrigated lowland
rice. Field Crop Res., 56: 113- 138
Fales, F.W. 1951. The assimilation and
degradation of carbohydrate by yeast
cells. J. Biol. Chem., 193: 113-124.
Gomez, K.A and A.A.Gomez. 1984. Statistical
procedures for Agricultural Research. An
IRRI book, Wiley Inter Science
publication, John Wile and Sons, New
York, USA.pp 680.
Hartemink, A.E., M. Johnston, J.N. Sullivan
and S. Poloma. 2000. Nitrogen use
efficiency of taro and sweet potato in the
humid lowlands of Papua New Guinea.
Agic. Ecos. Environ., 79: 271-280.
Hiscox, J.D. and G.F. Israelstam. 1979. A
method for the extraction of chlorophyll
from leaf tissue without maceration. Can.
J. Bot., 57: 1332-1334.
Hong Shen, J.Chen and Z.Wang.2006. Root
plasma membrane H+-ATPase is
involved in the adaptation of soyabean to
phosphorus starvation. J. Exp. Bot., 57:
1353-1362.
Hooley, 1984.Gibberellic acid controls the
secretion of acid phosphatase in aleurone
layers and
isolatedaleurone protoplasts of Avenafatua. J.
Exp. Bot., 35: 822-828
IRRI (International Rice Research Institute),
1997. Annual report for 1972. Los Banos,
Philippnes
Jeong, H. L., I. Chung, S. S. Ryu, M. R. Park
and S. J. Yun. 2003. Differential
responses of rice acid phosphatase
1536
Int.J.Curr.Microbiol.App.Sci (2017) 6(6): 1529-1537
activities and isoforms to phosphorus
deprivation. J. Biochem. Mol. Biol., 36:
597-602.
Kim, K.Y., D. Jordan and G.A.McDonald.1998.
Enterobacteragglomerans,
phosphate
solubilizing bacteria and microbial
activity in soil: effect of carbon sources.
Soil Biol. Biochem., 89: 995-1003
Kumar, V., S.S. Punia, K. Lakshminarayana
and N.Narula. 1999. Effect of phosphate
solubilizing analogue resistant mutants of
Azotobacter chroococcum on sorghum.
Ind. J. Agric Sci., 69: 198–200.
Mehrvarz, S. and M.R. Chaichi.2008. Effect of
Phosphate Solubilizing Microorganisms
and Phosphorus Chemical Fertilizer on
Forage and Grain Quality of Barely
(Hordeum vulgare L.). Am.-Eur. J. Agric.
Environ. Sci., 3(6):
855-860.
Muthaiya, S. 2010.Physiological effects of
phosphate inoculants (JumpStart) in
maize (Zea mays L.). M.Sc. (Agri.)
Thesis.
Tamil
Nadu
Agricultural
University, Coimbatore.
Perderson, P.L. and E. Carafoli.1987. Ion
motive ATPase. I. Ubiquity, properties
and significance to cell function. Trends
Biochem. Sci., 12: 146-150.
Prasanna. R. 2013.Physiological impact of
phosphate
solubilisinginoculants
(JumpStart) in rice. M.Sc (Agri) thesis.
Tamil Nadu Agricultural University,
Coimbatore.
Ramezan, Ali.,N.Khavari, N. Farzaneh and T.
Cobra. 2008. Diverse responses of tomato
to N and P deficiency. Inter. J. Agric.
Biol., 1560–8530
Rasipour, L. and N.A. Asgharzadeh. 2007. Then
interaction between the PSB and
Bradirhizobium
japanicum
growth
factors, tumor size and uptake of some
nutrients in soybean. Agric. Natural Res.
Sci., 11(5): 40-63.
Ryan, M.H and J.F. Angus.2003. Arbuscular
mycorrhizae in wheat and field pea crops
on a low P soil: increased Zn-uptake but
no increase in P-uptake or yield. Plant
Soil, 250:225–239.
Rychter, A.M. and D.D. Randall. 1994. The
effect of phosphate deficiency on
carbohydrate metabolism in bean roots.
Physiol. Plantarum, 91: 383-388
Ullrich, C.I., A.J. Novacky, E.Fisher and U.
Liittge. 1984. Relationship between
energy dependent phosphate uptake and
the electrical membrane-potential in
(Lemna gibba L). J. Plant Physiol., 67:
797–801.
Umbreit, W.W., R.H. Burris and J.F. Stauffer.
1964. Carbon dioxide and bicarbonate. In:
Umbreit WW, Burris RH, Stauffer JF
(Eds.). Manometric techniques. 4th edn.
Burgess Publishers. 18-27
Wang, S., H. Wu., J.Qiao, L. Ma., J. Liu.,Y. Xia
and X. Gao. 2009. Molecular mechanism
of plant growth promotion and induced
systemic resistance to tobacco mosaic
virus by Bacillus sp. Biotechnol., 19(10):
1250-1258
Xie, W., G. Weng and Q. Zhang. 2007.
Potentical production simulation and
optimal nutrient management of two
hybrid rice varieties in Jinhua, Zhejiang
Province. J. Zhejiang Univ. Sci., 8(7):
486- 492.
How to cite this article:
Geethalakshmi, M., V. Ravichandran, P. Boominathan and Jeyakumar, P. 2017. Response of
Phosphate Solubilising Inoculants (Jumpstart) on Biochemistry and Yield of Rice (Oryza sativa L.).
Int.J.Curr.Microbiol.App.Sci. 6(6): 1529-1537. doi: />
1537