Genetic variability and heritability study in F2 population of Gossypium Barbadense L. cotton for yield and its components
Bạn đang xem bản rút gọn của tài liệu. Xem và tải ngay bản đầy đủ của tài liệu tại đây (411.43 KB, 9 trang )
Int.J.Curr.Microbiol.App.Sci (2017) 6(6): 975-983
International Journal of Current Microbiology and Applied Sciences
ISSN: 2319-7706 Volume 6 Number 6 (2017) pp. 975-983
Journal homepage:
Original Research Article
/>
Genetic Variability and Heritability Study in F2 Population of
Gossypium barbadense L. Cotton for Yield and its Components
N.V. Mohan Kumar1* and I.S. Katageri2
1
Department of Genetics and Plant Breeding, College of Agriculture, UAS Dharwad, India
2
Department of Biotechnology, College of Agriculture, UAS Dharwad, India
*Corresponding author
ABSTRACT
Keywords
Heritability,
Genetic variability
PCV,
GCV and GAM.
Article Info
Accepted:
17 May 2017
Available Online:
10 June 2017
The success of most crop improvement programs depends upon the genetic variability and
heritability of desirable traits. The genetic variability and heritability study was carried out
in F2 population of Suvin X BCS 23-18-7 cross, at College of Agriculture, UAS Darwad
during Kharif 2016-17. The highest range of variation was observed in F2 population for
seed cotton yield per plant (5.5 g - 259 g) followed by plant height (30 -205 cm) and lint
yield per plant (2 - 89.5 g) while lint index (1.87 - 8.68) recorded lowest range of variation.
Respectively PCV and GCV per cent were recorded higher (> 20 %) for number of
monopodia per plant (46.08 and 26.09), number of sympodia per plant (27.86 and 21.99),
boll weight (25.69 and 22.99) and seed cotton yield (32.80 and 20.51) while moderate (10
- 20 %) for plant height (17.56 and 14.16) and lint yield (13.09 and 11.43) but high PCV
and moderate GCV observed for number of bolls per plant (25.40 and 14.19). Higher
heritability (> 60 %) was observed for plant height, number of sympodia per plant, seed
index, ginning outturn, lint index, boll weight and seed cotton yield per plant. Whereas,
days to first flowering, number of monopodia per plant, number of bolls per plant and seed
cotton yield per plant were recorded moderate (30 - 60 %) heritability. Similarly, Genetic
advance over mean high (> 20 %) for plant height, number of monopodia per plant,
number of sympodia per plant, lint yield per plant, lint index, boll weight and seed cotton
yield per plant while moderate (10 - 20%) for number of bolls per plant, seed index and
ginning outturn. But, only days to first flowering (3.35) recorded lower GAM. Traits
which showing high heritability coupled with moderate to high GAM (plant height,
number of sympodia per plant, seed index, ginning outturn, lint index, boll weight and
seed cotton yield per plant), supports for recovery of desirable lines through selection.
Introduction
Cotton, the ―king of fibre‖ known for its
desirable properties is also called ―White
Gold‖ due to its global importance in
agriculture as well as industrial economy, in
India providing direct employment to around
35 million people. Of the four cultivated
species worldwide, two diploid (2n=2x=26) A
genome species (G. arborium and G.
herbacium) and two AD genome (2n=4x=52)
species (G. hirsutum and G. barbadense),
were independently domesticated and
cultivated for their fibers (Wendel et al.,
1999). Pima cotton or Egyptian cotton,
Gossypium barbadense is known for its finest
fibre properties being cultivated in less than
2% in the world (Chen et al., 2007), it is just
because of low yielding ability, higher
susceptibility to sucking pests and boll
975
Int.J.Curr.Microbiol.App.Sci (2017) 6(6): 975-983
worms. In India, long and extra-long staple
cotton is widely grown in South Zone states
of Tamil Nadu, Andhra Pradesh and
Karnataka as the climatic requirement for
growing this cotton are more conducive and
there has been a heavy demand for this cotton
in the recent past in textile industry. To meet
industrial requirement there is urgent need to
improve yield potential in G. barbadense.
Attempts have been made to identify high
yielding extra-long staple G. barbadense
genotypes with desirable fibre property. In the
process of identification of genotypes, seed
cotton yield coupled with superior fibre
quality properties are considered as the prime
factors.
genetic variability among the populations, and
the best method for genetic variability create
in sexually (seed) propagated crop is through
wide hybridization or crossing between
genetically diverse parents. Hence, present
study was conducted to create genetic
variability by crossing diverse parents
selected within G. barbadense and analyzed
extent of genetic variability generated in their
F2 population for seed cotton yield and its
component traits.
Materials and Methods
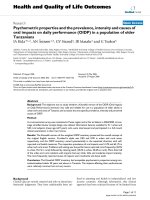
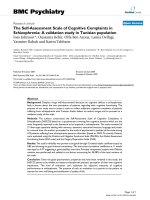
Suvin and BCS23-18-7 phenotypically
diverse (Table 1 and Fig. 1) genotypes
belongs to finest fibre quality cotton species
of Gossypium barbadense, were selected as a
parents for creating genetic variability for
fibre quality traits and seed cotton yield
during Kharif 2014-15 from Agriculture
Research Station, UAS Dharwad. Developed
F1 by crossing Suvin X BCS23-18-7 during
Summer 2014-15 and generated F2 by slfing
F1 during Kharif 2015-16. The genetic
variability and heritability for seed cotton
yield and its component traits in F2
population was carried out during Kharif
2016-17 at College of Agriculture, UAS,
Dharwad,
Karnataka.
Geographically,
experimental
field
is
located
at
15°29'46.8"North latitude and 74°59'11.3"
East longitude at an altitude of 678 m above
mean sea level with an average rainfall about
722.73 mm. The soil type of the experimental
block was vertisol with a pH in the range of 7
to 7.5 and plots were homogeneous with
respect to soil nutrient status. Before sowing,
seeds were treated with Imidacloprid to
protect the crop from the incidence of sucking
pests during early growth stage. Seeds were
hand dibbled in rows of 8 m length with
spacing of 90 cm between rows and 40 cm
between plants. Agronomic managements
were followed according to recommended
package of practices for irrigated conditions
Seed cotton yield is a complex trait governed
by several yield contributing characters such
as plant height, number of monopodia,
number of sympodia, number of bolls,
number of fruiting points per plant. In cotton,
genotypic and phenotypic variation for
different agronomic and fibre quality
characters such as plant height, number of
monopodia, number of sympodia, number of
bolls, number of fruiting points per plant, seed
index, lint index, micronaire value and seed
cotton yield has been extensively studied by
several workers (Ahuja and Tuteja, 2000;
Neelam and Potdukhe, 2002; Sakthi et al.,
2007; Dhamayanathi et al., 2010; Choudki et
al., 2012 and Raza et al., 2016). Since 1970,
several extra-long staple inter-specific (G.
hirsutum x G. barbadense) hybrids such as
Varalaxmi
(first
inter-specific
hybrid
developed by Katharki), DCH-32, NHB-12,
HB-224 and TCHB-213 developed at various
institutes were widely cultivated all over the
country. However, due to the genetic
deterioration
of
promising
released
varieties/hybrids, new genotypes with
improved fibre properties are desirable to
meet the demand in Indian textile industry.
The genetic improvement of any crop is
dependent upon the existence of initial
976
Int.J.Curr.Microbiol.App.Sci (2017) 6(6): 975-983
of the south zone. Observations were recorded
on randomly selected 19 plats in Suvin and
BCS 23-17-8 and 36 plants in F1 and all the
1329 F2 plants for seed cotton yield and its
component traits viz., days to first flowering,
plant height (cm), number of monopodia per
plant, number of sympodia per plant, number
of bolls per plant, boll weight, ginning outturn
(%), seed index (g) and lint index (g). The
mean and variance were analyzed based on
the formula given by Singh and Choudhary
(1977) and the genetic components of
variation was estimated with the help of given
formula.
Both genotypic and phenotypic coefficients of
variation were computed as per the method
suggested by Burton and Devane (1953).
Phenotypic coefficient of variation (PCV) and
genotypic coefficient of variation (GCV) were
classified as suggested by Sivasubramanian
and Menon (1973) that are, low (< 10 %),
moderate (10 - 20 %) and high (> 20 %). The
heritability percentage was classified as low
(0-30%), moderate (30–60%) and high (>
60%) by Robinson et al., (1949). Genetic
advance was computed by using the formula
given by Robinson et al., (1949) and genetic
advance over mean was calculated by given
formula. The genetic advance as per cent
mean was categorized as low up to 10 per
cent, 10 to 30 per cent consider as a moderate
and more than 20 per cent noticed as a high
(Johnson et al., 1955).
Phenotypic variance
The individual observation made for each trait
on F2 population is used for calculating the
phenotypic variance.
Genetic advance
Genetic advance over mean = ——— X 100
Mean
Phenotypic variance (σ²p) = Var F2
Where, Var F2 = variance of F2 population
Results and Discussion
Environmental variance
The genetic variability is a prerequisite for
any crop improvement program. Pedigree
methods of selection from F2 onwards from
cross between genetically diverse parents has
been known to be one of the effective means
of generates and maintaining genetic
variability. Heritability is generally ratio of
the genotypic variance to phenotypic
variance.
The average variance of parents and their
corresponding F1 is used as environmental
variance for single crosses.
Where,
The higher heritability values generally are
the reflection of closed value of respective
phenotypic and genotypic variances and also
indicate that selection of this character is
useful in improving plant type. Heritability by
itself does not provide indication of the
amount of genetic progress that would results
from selecting the best individuals, rather it
depends on the amount of genetic variance.
Therefore, genetic advance and genetic
advance over mean gain importance in
σ²p1 = Variance of parent P1
σ²p2 = Variance of parent P2
σ²F1 = Variance of cross F1
Genotypic variance
Genotypic variance
(σ²g) = σ²p - σ²e
σ²p = Phenotypic variance
σ²e = Environmental variance
977
Int.J.Curr.Microbiol.App.Sci (2017) 6(6): 975-983
providing an idea of the amount of progress
that can be achieved by selection.
(PCV and GCV) have been used to compare
the variability observed among the different
characters. The number of monopodia per
plant (46.08), number of sympodia per plant
(27.86), number of bolls per plant (25.40), lint
yield per plant (33.68), boll weight (25.69)
and seed cotton yield (32.80) recorded higher
PCV (> 20 %), whereas plant height (17.56),
seed index (10.23) and lint index (13.09) were
recorded moderate PCV (10 - 20 %), but days
to first flowering (5.14) and ginning outturn
(7.14) recorded low PCV (< 10 %).
Therefore, present study was attempted to
evaluate genetic variability, heritability and
GAM in F2 population of intraspecific cross
of G. barbadense. Statistical analysis revealed
the presence of considerable level of genetic
variability for all the characters under this
study (Table 2).
Statistically range is a difference between
highest to lowest, breeders generally used to
know the existing range of variability for
interested traits in the working population.
For seed cotton yield per plant recorded
highest range (5.5 - 259 g) followed by plant
height (30 - 205 cm), lint yield per plant (2 89.5 g), number of bolls per plant (2 - 51
bolls), ginning outturn (19.84 - 53.13 %),
days to first flowering (60 -88 days) and
number of sympodia per plant (2 - 25) while
lint index (6.81) recorded lowest range.
Similarly for GCV, number of monopodia per
plant (26.09), number of sympodia per plant
(21.99), boll weight (22.99) and seed cotton
yield (20.51) recorded higher, whereas plant
height (14.16), number of bolls per plant
(14.19) and lint index (11.43) observed
moderate GCV, and remaining two traits viz.,
seed index (8.28) and ginning outturn (6.73)
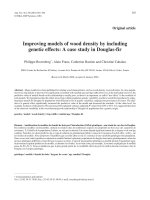
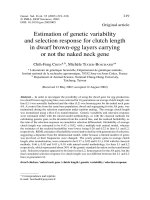
shown less GCV. The narrow difference
between genotypic coefficient of variation
and phenotypic coefficient of variation
indicates that characters were less affected by
environment, and comparison between GCV
and PCV depicted in figure 2.
Of the 1329 F2 plants 147 plants were
recorded higher yield than F1 (158 g/plant),
plant number F-692 recorded highest 259 g
(63.88 % superior over F1), followed by F463 recorded 251 g (58.82 % more than F1),
F-984 recorded 242.5 g (53.44 % more than
F1) and F-908 shown 238.5 g (50.91 %
greater than F1). These results confirmed that,
the genetic variation can be created through
hybridization between diverse parents. There
were many reports available on this aspect,
most related study of Yanal et al., (2013)
reported presence of wide range for seed
cotton yield (441.81- 2175.7 kg / ha) in 54 G
barbadense lines (53 F5 lines + suvin check).
The coefficients of variation expressed in
percentage at phenotypic and genotypic levels
Varieties
Suvin
BCS 23-18-7
Traits number of monopodia per plant,
number of sympodia per plant, boll weight
and seed cotton yield were recorded higher
PCV and GCV. Similarly in F4 populations of
upland cotton Raza et al., (2016) reported
higher GCV and PCV for seed cotton yield
per plant and number of monopodia per plant,
and moderate for plant height. Dhamayanathi
et al., (2010) reported higher GCV and PCV
for days to 50 per cent flowering, bolls per
plant, ginning outturn and seed cotton yield
per plant in 24 pima cotton genotypes.
Table.1 Characteristics of parents
Fiber length
Fiber fineness
Fiber strength
(mm)
(Mic)
(g/tex)
37-39
3.0-3.3
46-48
29-31
3.4-3.5
26-29
978
Seed cotton yield
(gm/plant)
81 - 95
135 - 148
Int.J.Curr.Microbiol.App.Sci (2017) 6(6): 975-983
Table.2 Genetic variability in F2 population
F2 mean
X1
72.91
X2
126.54
X3
2.47
X4
11.82
X5
28.57
X6
37.42
X7
9.37
X8
33.44
X9
4.72
X10
3.96
X11
111.83
Minimum
60.00
30.00
0.00
2.00
2.00
2.00
4.48
19.84
1.87
2.00
5.50
Maximum
88.00
205.00
7.00
25.00
51.00
89.50
12.11
53.13
8.68
9.83
259.00
Range
28.00
175.00
7.00
23.00
49.00
87.50
7.63
33.28
6.81
7.83
253.50
P1 mean
78.84
147.21
4.79
17.37
25.74
32.31
11.73
33.26
5.85
3.85
97.18
P2 mean
68.22
118.06
1.72
16.17
37.17
29.46
8.95
33.49
4.50
3.14
116.90
F1 mean
73.64
126.97
3.69
15.61
39.72
53.32
9.55
33.75
4.86
3.97
158.04
σ²e
9.59
172.81
0.88
4.08
36.23
87.31
0.32
0.63
0.09
0.21
819.20
σ²p
14.04
493.92
1.29
10.83
52.65
158.88
0.92
5.70
0.38
1.03
1345.13
σ²g
4.44
321.11
0.41
6.75
16.42
71.58
0.60
5.07
0.29
0.83
525.94
h2
31.66
65.01
32.05
62.31
31.19
45.05
65.54
88.90
76.22
80.10
39.10
PCV
5.14
17.56
46.08
27.86
25.40
33.68
10.23
7.14
13.09
25.69
32.80
GCV
2.89
14.16
26.09
21.99
14.19
22.61
8.28
6.73
11.43
22.99
20.51
GA
2.44
29.76
0.75
4.22
4.66
11.70
1.29
4.37
0.97
1.68
29.54
GAM
3.35
23.52
30.43
35.75
16.32
31.26
13.81
13.07
20.56
42.39
26.42
X1 - Days to first flowering
X2 - Plant height
X5 Number of bolls per plant
X6 - Lint yield per plant (g)
X9 - Lint index
X10 - Boll weight
σ²p - phenotypic variance
σ²g - Genotypic variance
GCV- Genotypic coefficient of variation
X3 - Number of monopodia per plant
X7 - Seed index
X11 - Seed cotton yield
h2 - heritability
GA- Genetic advance
979
X4 - Number of sympodia per plant
X8 - Ginning outturn (%)
σ²e - Environment variance
PCV- phenotypic coefficient of variation
GAM- Genetic advance over mean
Int.J.Curr.Microbiol.App.Sci (2017) 6(6): 975-983
Fig.1 Phenotypic appearance of parents
Suvin
BCS 23-18-7
980
Int.J.Curr.Microbiol.App.Sci (2017) 6(6): 975-983
Fig.2 Comparison between PCV and GCV
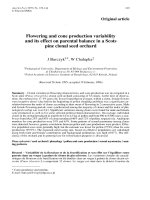
Fig.3 Comparison among heritability (h2), genetic advance (GA) and GAM
981
Int.J.Curr.Microbiol.App.Sci (2017) 6(6): 975-983
Heritability (h2) as a ratio of genotypic to
phenotypic
variance
indicates
the
effectiveness with which selection of
genotypes can be based on phenotypic
performance. Heritability of different traits
were classified in to (> 60 %), high moderate
(30 - 60 %) and low (< 30%) (Robinson et al.,
1949). Ginning outturn (88.90), boll weight
(80.10), lint index (76.22), and lint yield per
plant (71.58), seed index (65.54), plant height
(65.01) and number of sympodia per plant
(62.31),
recorded
higher
heritability.
Whereas, days to first flowering (31.66),
number of monopodia per plant (32.05),
number of bolls per plant (31.19) and seed
cotton yield per plant (39.10) showed
moderate heritability. Similar results were
reported by many researchers, more relevant
study of Dhamayanathi et al., (2010) reported
higher heritability for plant height, seed
cotton yield per plant, boll weight and number
of bolls per sympodia in 24 pima cotton
genotypes.
hirsutum X G. barbadense) and reported
higher GAM for seed cotton yield per plant,
number of monopodia per plant and bolls per
plant, and moderate GAM for boll weight and
lint index.
Because of the presence of higher heritability
with a high genetic advance over mean for
number of sympodia per plant, lint index, boll
weight and seed cotton per plant (main yield
contributing traits), chances of recovery for
transgressive segregants for seed cotton yield
is very high.
References
Ahuja, S.L. and Tuteja, O.P. 2000. Variability
and association analysis for chemical
components imparting resistance in G.
hirsutum L. cotton. J. Cotton Res Dev.,
14(10):19-22.
Burton, G.W. and Devane, E.M. 1953.
estimating heritability fall fescue
(Festuca arundanaceae) from replicated
coinal-material. Agron. J., 45: 478-481.
Choudki, V.M. Sangannavar, P Savita, S.G.,
Khadi, B.M., Vamadevaiah H.M. and
Katageri
I.S.
2012.
Genetic
improvement of fibre traits in diploid
cotton (G. herbaceum L.) through
interspecific hybridization using G.
barbadense
tetraploid
species.
Electronic J. Plant Breed., 3(1): 686691.
Dhamayanathi, K.P.M., Manickam, S. and
Rathinavel, K. 2010. Genetic variability
studies in Gossypium barbadense L.
genotypes for seed cotton yield and its
yield components. Electronic J. Plant
Breed., 1(4): 961-965.
Johnson, H.W., Robinson, H.F. and
Comstock, R.E. 1955. Estimates of
genetic and environmental variability in
soybeans. Agron. J., 47: 314-308.
Neelam, G.D. and Potdukhe, N.R. 2002.
Studies on variability and correlation in
Heritability estimates along with genetic
advance over mean will be more useful in
predicting the outcome of selecting the best
individuals. The GAM (> 20 %) for different
traits were observed viz., plant height (23.52),
number of monopodia per plant (30.43),
number of sympodia per plant (35.75), lint
index (20.56), boll weight (42.39) and seed
cotton yield (26.42). And the number of bolls
per plant (16.32) lint yield per plant (31.26)
and seed index (13.81), and moderate GAM
(10 - 20 %) observed for ginning outturn
(13.07), whereas, only days to first flowering
was recorded low GAM of 3.35. And
comparison among heritabillity, genetic
advance and genetic advance over mean is
depicted in figure 3. Choudki et al., (2012)
reported high GAM for seed cotton yield per
plant and seed index in F11 generation of
interspecific (G. herbacium X G. barbadense)
cross. Ramesh (2016) evaluated recombinant
inbred lines of inter specific hybrid (G.
982
Int.J.Curr.Microbiol.App.Sci (2017) 6(6): 975-983
upland cotton for yield and its
components. J. Indian Soc Cotton
Improv., 27(3): 148-152.
Ramesh, M. 2016. Genome mapping and
identification of molicular markers for
various agronomic and fibre quality
traits in tetraploid cotton. Ph.D thesis
UAS Dharwad.
Raza, H., Khan, N.U., Khan, S.A., Gul, S.,
Latif, A., Hussain, I., Khan, J., Raza, S.
and Baloch M. 2016. Genetic variability
and correlation studies in F4
populations of upland cotton. J. Animal
Plant Sci., 26(4): 2016
Robinson, H.F., Comstock, R.E. and Harvey,
P.H. 1949. Estimates of heritability and
degree of dominance in corn. Agron. J.,
41: 353-359.
Sakthi, A.R., Kumar, M. and Ravikesavan, R.,
2007. Variability and association
analysis Using morphological and
quality traits in cotton (Gossypium
hirsutum). J. Cotton Res Dev., 21(2):
148-152.
Singh, R.K. and Choudhary, B.D. 1977
Biometrical Methods in Quantitative
Genetic Analysis, Kalyani Publishers,
New Delhi.
Sivasubramanian, S. and Menon, M. 1973.
Heterosis and inbreeding depression in
rice. Madras Agric. J., 60: 1139-1140.
Yanal, A., Patil, S.S., Manjula, S. M., Patil,
B.C., Nadaf, H.L. and Nandihali, B.S.
2013. Genetic variability studies in
segregating Generation of Gossypium
barbadense lines in cotton. Mol. Plant
Breed., 25(4): 209-213
How to cite this article:
Mohan Kumar, N.V. and Katageri, I.S. 2017. Genetic variability and heritability study in F2
population of Gossypium barbadense L. Cotton for yield and its components.
Int.J.Curr.Microbiol.App.Sci. 6(6): 975-983. doi: />
983