Studies on genetic diversity among various genotypes of Brassica napus L. using morphological markers
Bạn đang xem bản rút gọn của tài liệu. Xem và tải ngay bản đầy đủ của tài liệu tại đây (569.59 KB, 12 trang )
Int.J.Curr.Microbiol.App.Sci (2017) 6(7): 469-480
International Journal of Current Microbiology and Applied Sciences
ISSN: 2319-7706 Volume 6 Number 7 (2017) pp. 469-480
Journal homepage:
Original Research Article
/>
Studies on Genetic Diversity among Various Genotypes of
Brassica napus L. Using Morphological Markers
Rubby Sandhu1*, S.K. Rai1, Richa Bharti1, Amardeep Kour1,
S.K. Gupta1 and Ajay verma2
1
Division of Plant Breeding and Genetics, SKUAST-Jammu, Chatha, Jammu 18009 (J&K) India
2
ICAR - Indian Institute of Wheat and Barley Research, Karnal-132 001, Haryana, India
*Corresponding author
ABSTRACT
Keywords
Genetic diversity,
Brassica napus,
Correlation
coefficients,
Path analysis,
Cluster analysis.
Article Info
Accepted:
04 June 2017
Available Online:
10 July 2017
The seed material of 18 genotypes of Brassica napus L. was procured from different
institutes. In order to check the authenticity of the work four other genotypes of different
Brassica species were also used. Genetic diversity of these genotypes was assessed using
morphological traits. The characters days to maturity, plant height, number of primary
branches/plant, number of seeds/siliqua, number of siliqua/plant and seed yield /plant
showed higher influence of environment whereas, siliqua length and 1000-seed weight
showed the least. Days to maturity and days to 50% flowering exhibited the highest
heritability. The significant positive correlation with seed yield/plant was found in plant
height, number of primary branches/plant, number of siliqua on main raceme, 1000-seed
weight, oil content, days to 50% flowering and days to maturity. Path coefficient analysis
showed that the plant height had maximum positive direct effect on seed yield followed by
1000-seed weight and siliqua length. Plant height, number of primary branches/plant and
number of siliqua on main raceme were the most important contributors to seed yield/plant
which could be taken consideration in future selection program. Significant genetic
variability was obtained among the selected 22 genotypes through dendogram analysis the
genotypes viz., AKGS-3, EC552608 were more diverse from the rest of the Brassica napus
L. sps. So, the genotypes AKGS-3 and EC55208 should be used to exploit heterosis in
hybridization programme with the other Brassica napus genotypes considered in the study.
Introduction
of intensive breeding processes Brassica
napus L. has a relatively narrow genetic
diversity in current germplasm. In order to
estimate the genetic variation among the
diverse group of important crops in Brassica
genus it have been used a variety of
morphological and molecular markers.
Rapeseed and mustard are major rabi oil seed
crops of India. Oilseed rape (Brassica napus
L.) is the most important source of vegetable
oil and the second most important oilseed
crop in the international oilseed market after
soybean (Hasan et al., 2006). Brassica napus
is an amphidiploid (AACC genome, 2n = 38)
and is believed to have arisen by inter-specific
hybridization between diploid Brassica rapa
L. (AA genome, 2n = 20) and Brassica
oleracea L. (CC genome, 2n = 18). Because
The aim of this study was to estimate the
genetic diversity among some oilseed rape
cultivars
based
on
morphological
469
Int.J.Curr.Microbiol.App.Sci (2017) 6(7): 469-480
characterization. For this purpose, 22 oilseed
cultivars were analyzed and the results of
genetic distances were estimated.
respectively.
Materials and Methods
This was calculated by the formula suggested
by Burton and De Vane (1953).
Components of variance
Plant material
Phenotypic variance
The plant material for this study comprised 22
genotypes of Brassica (Fig. 1). The plants
were sown in the field in the year 2013-2014
in order to obtain the morphological data.
=
+
Where,
error variances= E.M.S.
Each treatment was sown in 3 rows of 5 m
length. The recommended dose of fertilizer
was given and also the recommended Plant
Protection measures were adapted for raising
a good crop. Genotypes with their pedigree
are shown in table 1.
Genotypic variance (
)
=
Where,
Mv = treatment mean squares
Me = error mean squares
r = no. of replications
Experimental observations
Five plants were randomly selected from each
treatment in each replication for recording the
observations. These plants were tagged and
detailed observations were recorded on all the
selected traits:
Coefficients of variability
This was calculated by the formula suggested
by Burton and De Vane (1953).
Data analysis
Phenotypic coefficient of variability (P.C.V):
Statistical analysis such as correlation,
coefficients of variability, heritability, genetic
advance and path analysis was done using
viva Statistical Analysis System (SAS)
Software version 9.3.
P.C.V (%) =
×100
Genotypic coefficients of variability (G.C.V):
Analysis of variance
G.C.V (%) =
×100
The analysis of variance for various
characters studied in experiments was carried
out according to the analysis of variance for
R.B.D.
Where,
Where,
and
are environmental and
genotypic variances of ith character,
Heritability was calculated according to Singh
and Ceccarelli (1996).
is the general mean of the character.
Heritability
470
Int.J.Curr.Microbiol.App.Sci (2017) 6(7): 469-480
of varieties on which the observations were
recorded.
Genetic advance
Path coefficient analysis
Genetic advance was also estimated according
to Allard (1960).
The path coefficient was done following the
procedure outlined by Dewey and Lu (1959)
using genotypic correlation of ‘cause’ with
‘effects’ was calculated by following
simultaneous equations:
GA = (K) (h2) (√σp2)
Where, ‘k’ is selection differential and at 5%
the K value was 2.06.
rmp = pmp + rmn pnp + rmo pop
rnp = rnm pmp + pnp + rno pop
rop = romp mp+ ron pnp + pop
Genetic advance as per cent of mean
(G.A.%):
…1
…2
…3
Where, Pmp, Pnp, Pop are direct affects of m,
n and o on cause P, and rmp, pnp, rmo, Pop…
are indirect affects on cause. These
simultaneous equations are solved by using
matrix method expressed below:
Correlation coefficients
rmp = rmp
rnp = rnm
rop = rom
The simple correlation coefficients between
different characters at genotypic and
phenotypic level were worked out between
characters as suggested by al- Jibouri et al.,
(1958).
rmn
rnn
ron
rmo
rno
roo
Pmp
Pnp
Pop
Or A = B.C. Here, A and B vectors are
known. For calculation of C vectors the
formula used is:
Phenotypic correlation coefficients (rp)
C = B-1, A
Here, B-1 is the inverse matrix of B vector.
Pivotal condensation method was used for
matrix inversion.
Genotypic correlation coefficients(rg)
Results and Discussion
Genetic variability
Where, Cor. XY(p) and cov. XY (g) denote
phenotypic and genotypic covariances
between character X and Y, respectively. Var.
X (p) and var. X(g) denote variance for
characters X and Y, at phenotypic and
genotypic
levels,
respectively.
The
significance
of
different
correlation
coefficients was tested against (v-2) degrees
of freedom at 5% and 1%, where v is the no.
Generally
phenotypic
coefficients
of
variability were higher than genotypic
coefficient of variability which indicates that
environment plays a considerable role in the
expression of these traits. The maximum
phenotypic and genotypic coefficient of
variability was observed for number of seeds
per siliqua. The minimum phenotypic and
471
Int.J.Curr.Microbiol.App.Sci (2017) 6(7): 469-480
genotypic coefficient of variability was
observed for oil content followed by 1000seed weight and plant height. Number of
primary branches, number of secondary
branches, seed yield per plant, days to 50%
flowering, number of siliqua on main raceme,
siliqua length and days to maturity also
showed higher estimates of phenotypic and
genotypic coefficient of variability.
advance in percentage of mean (22.90)
provided opportunity for selecting high
valued genotypes for 1000-seed weight. Singh
et al., (2002) reported the high heritability and
genetic advance for 1000 seed weight. Seed
yield exhibited moderate (63.4%) heritability
with a high genetic advance in percentage of
mean (31.52) indicating that phenotypic
selection for seed yield per plant would be
effective. Sharafi et al., (2015) found similar
result while Aytaç and Kinaci (2009)
mentioned the high heritability and genetic
advance for seed yield.
Analysis of variance for the design used
indicated highly significant differences for all
the traits viz., plant height, days to 50%
flowering, days to maturity, number of siliqua
on main raceme, number of primary branches,
no. of secondary branches, 1000-seed weight,
siliqua length, number of seeds per siliqua, oil
content, seed yield per plant (Table 2). This
indicates the presence of large amount of
variability for all the characters. Generally
these results are similar to those reported by
Asghari et al., (2011) and Sabaghnia et al.,
(2010).
Correlation coefficient
Days to 50% flowering showed significant
positive association with days to maturity and
seed yield per plant at both genotypic and
phenotypic level. These results suggested that
if days to 50% flowering increased, then days
to maturity and seed yield per plant also
increased. Similar result was found by Ghosh
and Gulati (2001). While days to maturity
also showed significant positive correlation
with plant seed yield per plant at both
genotypic and phenotypic level. Plant height
showed highly significant positive correlation
with seed yield. Significant positive
correlation between plant height and seed
yield per plant was also found by Khayat et
al., (2012). Number of siliqua on main
raceme
showed
significant
positive
correlation with seed yield per plant at both
genotypic and phenotypic level. Thousand
seed weight showed significant positive
correlation with seed yield per plant at both
genotypic and phenotypic level as reported by
Tuncturk et al., (2007). Seed yield per plant
had highest significant positive correlation
with plant height followed by days to maturity
at both genotypic and phenotypic level
suggesting, if the plant height and days to
maturity increase then seed yield per plant
also increases. Jeromel et al., (2007) found
complete positive correlation between plant
height and yield (Table 4 and 5).
Heritability and genetic advance
The heritability value ranged from 30.6% (no.
of secondary branches) to 98.8% (days to
maturity). In general higher estimates of
broad sense heritability were observed for all
the traits. Moreover, the number of primary
branches per plant, siliqua length, number of
seeds per siliqua and seed yield per plant
showed moderate broad base heritability
while days to maturity exhibited the highest
heritability. The genetic advance in percent of
mean ranged from 5.27 % (oil content) to
42.54 % (days to 50% flowering) (Table 3).
Plant height exhibited high heritability
(79.6%) with high genetic advance in
percentage of mean (21.48) for this trait might
be taken into consideration while selecting a
suitable line. High heritability was also
calculated for this trait by Hasan et al., 2014
and Yadava et al., 2011. The high heritability
(90.5%) along with considerable genetic
472
Int.J.Curr.Microbiol.App.Sci (2017) 6(7): xx-xx
Table.1 Genotypes with their pedigree used for diversity analysis
S.
No
1
2
3
CNH-11-7
HNS0901
CNH-11-1
Brassica napus
Brassica napus
Brassica napus
4
5
6
7
8
9
10
11
12
13
14
15
16
17
18
19
20
CNH-11-13
HNS1001
GSL-1
GSC-101
CNH-11-2
GSC-6
NUDB2611QC
EC552608
RSPN-29
RSPN-25
AKGS-3
DGS-1
RSPN-28
CNH-55
CNH-13-1
PusaTarak
PTC-2009-3
21
RSPT-2
Brassica napus
Brassica napus
Brassica napus
Brassica napus
Brassica napus
Brassica napus
Brassica napus
Brassica napus
Brassica napus
Brassica napus
Brassica napus
Brassica napus
Brassica napus
Brassica napus
Brassica napus
Brassica juncea
Brassica
campestris
Brassica
campestris
Brassica juncea
22
Genotypes
Varuna
Species
Pedigree
Source
OCN8NA X China 1006BCR
Selection from exotic selection
Ag Outback NA X China 6 1006
NAR
RT108NA X China 1006BCR
HNS0004 X EC552585
Selection from farmer’s field
Rivette X RR001
ECN 3 NA X China 6- 1006 NAR
An exotic line of Gobhi sarson
DGS-1 X GSL 1
B. napus x B. hirta
HPN-1-36-16-9
Selection from exotic collection
DGS-1 X RSPN 25
BCN61 X China 6A.
BCN3575NA X China 6-1006-2
SEJ-8 X Pusa Jagannath
Composite(IGT-1+TS-29+TS36+TS-38+TS-46+TS-50+Bhawani)
Mass selection from local
germplasm
Selection from Varanasi Local
786,02.021976
PAU Ludhiana
CCS HAU, Hisar
PAU Ludhiana
PAU Ludhiana
CCS HAU, Hisar
PAU Ludhiana
PAU Ludhiana
PAU Ludhiana
PAU Ludhiana
Faizabad.
CSKHPKV
SKUAST-J
SKUAST-J
CSKHPKV
SKUAST-J
SKUAST-J
PAU Ludhiana
PAU Ludhiana.
IARI New Delhi
GB PUA & T,
Pantnagar.
SKUAST-J
Kanpur
Table.2 Analysis of variance for different characters in Brassica genotypes
Characters
Plant height (cm)
No of primary branches/plant
No of secondary branches/plant
No of siliqua on main raceme
Siliqualength(cm)
No. of seeds /siliqua
1000-seed weight(g)
Oil content(%)
Days to 50% flowering
Days to maturity
Seed yield per plant(g)
Mean squares
Replication
d.f.
2
22.10
0.195
0.195
10.65
1.205
6.695
0.11*
0.065
12.41
128.225**
4.57
*=Significant at 5 per cent**= Significant at 1 per cent
473
Treatment
21
1551.12**
9.80**
9.57**
929.78**
2.41**
63.16**
0.51**
3.27**
937.52**
1203.37**
24.73**
Error
42
121.95
2.64
4.12
76.19
0.59
14.67
0.02
0.03
5.55
4.78
3.99
Int.J.Curr.Microbiol.App.Sci (2017) 6(7): xx-xx
Table.3 Mean and range for different characters of Brassica genotypes
Characters
Grand mean
Range
Plant height (cm)
No of primary branches
No of secondary branches
No of siliqua on main
raceme
Siliqua length (cm)
No. of seeds per siliqua
1000-seedweight (g)
Oil content (%)
Days to 50% flowering
Days to maturity
Seed yield per plant (g)
186.71 9.02
9.21 1.32
15.11 1.65
84.92 7.12
105-226
04-13
10-20
44-122
5.55 0.63
20.61 3.13
3.49 0.14
40.0 0.14
84.59 1.92
151.00 1.78
13.67 1.6
3.0-8.0
10-29
2.9-5.0
38-42
37-101
90-16
3.48-20.8
Table.4 Coefficient of variability, heritability and genetic advance in per cent of mean for different
characters in Brassica
Coefficients of variability
Pcv
GCV
Plant height (cm)
No of primary branches
No of secondary branches
No of siliqua on main raceme
Siliqua length (cm)
No. of seeds per siliqua
1000-seed weight (g)
Oil content (%)
Days to 50% flowering
Days to maturity
Seed yield per plant (g)
13.10
24.34
16.13
22.36
19.72
26.95
12.24
2.63
20.02
13.32
24.14
11.69
16.79
8.92
19.86
14.06
19.51
11.65
2.60
20.84
13.24
19.22
Heritability (h2bs)
in % age
79.6
47.4
30.6
78.9
50.8
52.4
90.5
97.4
98.2
98.8
63.4
Genetic Advance
in % of Mean
21.48
23.77
10.19
36.33
20.73
29.12
22.90
5.27
42.54
27.10
31.52
Analysis of variance
Sources of variations
d.f
Mean squares variances
Observed
Replications
Treatments
Error
(r-1)
(t-1)
(r-1)(t-1)
Mr
Mv
Me
474
Expected
Int.J.Curr.Microbiol.App.Sci (2017) 6(7): xx-xx
Table.5 Genotypic and phenotypic correlations coefficients for different characters of Brassica genotypes
Characters
X1-Plant height(cm)
rp
rg
X2-No. of pri. branches
X3-No. of Sec. branches
X2
X3
X4
0.093
-0.030
0.014*
0.004*
0.283*
0.291*
0.266*
0.538**
X6
X7
X8
0.256*
0.394*
0.277*
0.438*
-0.195
-0.236
-0.270*
-0.306
0.712**
0.802*
0.817**
0.916**
0.294*
0.379*
-0.010
-0.254
0.190*
0.321*
0.057*
0.055*
0.049*
0.099*
-0.006
-0.009
0.155*
0.238*
0.160*
0.238*
0.036*
0.146
0.010*
0.045*
0.161*
-0.212
-0.073
-0.578
-0.163
-0.355
-0.063
-0.136
0.018*
0.033*
0.114*
0.174*
0.020
0.172
0.245*
0.312*
0.112*
0.034*
-0.362
-0.415
0.012*
-0.003
0.299*
0.342*
0.289*
0.337*
0.280*
0.360*
0.532*
0.713**
0.485*
0.684**
-0.086
-0.236
X4-No. of siliqua on m.r.
X5
X5-Siliqua length(cm)
0.597**
0.873**
X6-No. of seeds per siliqua
-0.287
-0.424
-0.129
-0.181
0.035* -0.190
0.066* -0.276
0.144*
0.161*
X7-1000 seed weight (g)
X8- oil content (%)
X9-days to50%flowering
X10-days to maturity
X9
X10
X11
0.570**
0.767**
-0.213
-0.219
0.497*
0.711**
-0.225
-0.249
0.012
0.056
0.077*
0.099*
-0.276
-0.281
-0.408
-0.421
0.093*
0.112*
0.933**
0.949**
0.153*
0.193*
0.148*
0.206*
X11 = Seed yield per plant (g)
*=Significant at 5 per cent, **= Significant at 1 per cent
475
Int.J.Curr.Microbiol.App.Sci (2017) 6(7): xx-xx
Table.6 Direct (diagonal) and indirect (off diagonal) effects of different characters on seed yield per plant at genotypic level
characters
X1
X2
X3
X4
X5
Plant height (cm)
1.219
0.000
-0.001
0.086
0.232
No. of primary
Branches/plant
-0.036
0.012
-0.091
-0.076
No. of secondary
Branches/plant
0.005
-0.007
0.169
No. of siliqua on
main raceme
0.355
0.003
Siliqua length (cm)
0.480
X7
X8
X9
X10
-0.432
-0.148
0.061
0.951
-1.590
0.189
-0.054
0.062
0.002
0.282
0.412
0.013
-0.125
0.569
-0.222
0.027
0.039
-0.302
-0.008
0.297
0.184
-0.033
-0.260
0.001
0.406
-0.585
-0.004
0.036
0.093
-0.860
-0.265
0.036
0.845
-1.186
No. of seeds per
siliqua
0.534
-0.001
0.098
0.010
0.515
0.984
0.041
0.055
0.910
-1.233
1000-seed weight (g)
-0.288
-0.001
0.060
-0.123
-0.250
-0.065
Oil content(%)
-0.373
0.000
0.023
-0.001
-0.107
Days to 50% flowering
0.997
-0.003
-0.006
0.102
Days to maturity
1.117
-0.003
0.100
-0.029
0.590
X6
0.626
-0.03
-0.272
0.111
-0.199
0.420
-0.755
-0.137
0.403
-0.700
-0.156
Residual = 0.329; Underline values denotes direct path effects.
476
-0.260
0.432
-0.334
0.730
0.056
1.186
-1.647
0.084
1.126
-1.735
Int.J.Curr.Microbiol.App.Sci (2017) 6(7): xx-xx
Table.7 Direct (diagonal) and indirect (off diagonal) effects of different characters on seed yield per plant at phenotypic level
characters
X1
Plant height (cm)
0.471
No. of primary
branches/plant
X2
X3
X4
0.002
0.001
0.085
0.044
0.024
0.020
-0.003
-0.031
No. of secondary
Branches/plant
0.007
0.006
0.076
0.003
-0.026
No. of siliqua on
main raceme
0.133
0.000
0.001
0.299
Siliqua length (cm)
0.121
0.005
X5
X6
X7
X8
X9
X10
-0.042
-0.005
-0.038
-0.016
0.249
-0.414
-0.001
0.009
0.000
0.054
- 0.081
0.001
-0.032
-0.004
0.006
0.058
-0.002
0.070
0.001
0.105
-0.146
-0.040
0.012
0.073
-0.163
-0.008
0.186
- 0.246
0.007
-0.011
0.200
-0.252
0.130
0.001
-0.006
0.033
1000-seed weight (g)
-0.092
0.001
-0.012
-0.108
0.047
-0.001
0.195
Oil content (%)
-0.127
0.000
-0.005
0.004
0.021
0.003
0.028
0.059
-0.097
0.207
Days to 50% flowering
0.335
0.004
0.090
-0.087
-0.010
-0.042
-0.016
0.350
-0.473
Days to maturity
0.385
0.086
-0.079
0.004
0.009
Residual effect = 0.585; Underline values denotes direct path effects.
477
0.017
-0.056
No. of seeds per
siliqua
0.001
-0.098
-0.010
-0.008
-0.044
0.008
-0.024
-0.075
0.327
0.144
-0.507
Int.J.Curr.Microbiol.App.Sci (2017) 6(7): xx-xx
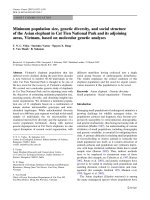
Fig.1 Dendrogram constructed for 22 oilseed rape cultivars based on morphological traits
0.18
0.14
0.09
478
0.05
0.00
Int.J.Curr.Microbiol.App.Sci (2017) 6(7): xx-xx
for this trait which had longer siliqua in order
to improve seed yield. Number of seeds per
siliqua had negative direct effect on seed yield
per plant. This indicated that selection for
greater number of seeds per siliqua would
give better response in the improvement of
seed yield per plant. Afrin et al., 2011 found
similar results for these traits.
Path coefficient
Days to 50% flowering had positive direct
effect on seed yield per plant (1.186) at
genotypic level. The highest indirect positive
effect was found via plant height (1.17)
followed by siliqua length (0.420). Days to
maturity had negative direct effect on seed
yield per plant (-1.735) and it also had
positive correlation with seed yield per plant.
Days to maturity had positive direct effect on
seed yield through plant height (1.117),
number of siliqua on main raceme (0.100),
siliqua length (0.403), and oil content (0.084)
and days to 50% flowering (1.126).
Dendogram analysis
A dendogram was constructed by hierarchical
clustering using ward’s method. Dendogram
showed that the genotypes were divided into
3-groups. First group contains three
genotypes viz. Pusa tarak, RSPT-2, PTC2009-3; second group contained three
genotypes viz. EC552608, AKGS-3 and
Varuna; while the third group contained 16
genotypes.
Plant height had direct positive effect (1.219)
on seed yield per plant. These results
indicated if plant height increased then seed
yield also increased mostly through the direct
positive effect of plant height and positive
indirect effect of other characters. Aytac et
al., (2008) reported plant height showed a
considerable direct positive effect on seed
yield per plant. Number of primary branches
per plant had positive direct effect on seed
yield per plant and also positive highly
significant correlation with seed yield per
plant at genotypic level. Mahak et al., (2003)
reported that number of primary branches per
plant had direct positive effect on seed yield.
So, selection for this trait will be judicious
and more effective in future breeding
program.
Acknowledgement
Special thanks to Dr. S. K. Rai, member of
advisory committee and university for
providing all the necessary facilities regarding
research work.
References
Afrin, K.S., Bhuiyan, S.R. and Rahim, A. 2011.
Assessment of genetic variation among
advanced lines of Brassica napus L.
Department of Plant Breeding Sher-eBangla Agricultural University Dhaka. P
201-205.
Al – Jibouri, H.A.; Miller, P.A. and Robinson,
H.F. 1958. Genotypic and environmental
variances and covariances in an upland
cotton cross of inter – specific origin.
Agronomy Journal, 50: 633-637.
Allard, R.W. 1960. Principles of Plant
Breeding. John Wiley & Sons, Inc., New
York.
Asghari, A., Shokrpour, M., Chamanabad, H.M.
and Sofalian, O. 2011. Evaluating genetic
diversity of canola cultivars using
Number of secondary branches per plant
showed negative direct effect (-0.169) on seed
yield per plant. The genotypic correlation
with seed yield was positive mainly due to
negative direct effect of number of secondary
branches per plant plus positive indirect effect
of other characters. Siliqua length had
positive direct effect (0.590) on seed yield per
plant (Tables 6 and 7). The genotypic
correlation with seed yield was positive
(0.236). Hence, selection should be practiced
479
Int.J.Curr.Microbiol.App.Sci (2017) 6(7): xx-xx
morphological traits and molecular
markers. Romanian Biotechnological
Letters, 16(4).
Aytaç, Z. and Kinaci, G. (2009). Genetic
variability and association studies of some
quantitative characters in winter rapeseed
(Brassica napus L.). African Journal of
Biotechnology, 8(15): 3547-3554
Aytac, Z., Kinaci, G. and Kinaci, E. (2008).
Genetic Variation, Heritability and Path
Analysis of Summer Rapeseed Cultivars.
Journal of Applied Biological Sciences,
2(3): 35-39.
Burton, G.W. and De Vane, E.H. 1953.
Estimating heritability in tall fescue
(Festuca arundinacea) from replicated
clonal material. Agronomy Journal, 45:
478-481
Gosh S.K., S.C. Gulati, 2001.Genetic variability
and association of yield components in
Indian mustard (Brassica juncea L.).
Crop Res. Hisar, 21:345-349.
Hasan, E.U., Mustafa, H.S.B, Bibi, T.
Mahmood, T. 2014.Genetic variability,
correlation and path analysis in advanced
lines of rapeseed (Brassica napusl.) For
yield
components.
Cercetări
Agronomiceîn Moldova Vol. XLVII, No.
1 (157).
Hasan, M., Seyis, F., Badani, A.G., PonsKuhnemann, J., Friedt, W., Luhs, W. and
Snowdon, R.J. (2006). Analysis of
genetic diversity in the Brassica napus L.
gene pool using SSR markers. Genetic
Resources and Crop Evolution 53: 793802.
Jeromel, A.M., Marinkovi, R. Miji, A.,
Jankulovsk, M. and Zduni, Z. (2007).
Interrelationship between oil yield and
How to cite this article:
other quantitative traits in Rapeseed
(Brassica napus L.). Journal of Central
European Agriculture. 8(2): 165-170.
Khayat M., Sh. Lack, H. Karami, 2012 Correlation and path analysis of traits
affecting grain yield of canola (Brassica
napus L.) varieties. J.Basic. Appl. Sci.
Res., 2 (6): 5555-5562.
Sabaghnia, N., Dehghani, H., Alizadeh, B. and
Mohghaddam, M. 2010. Heterosis and
combining ability analysis for oil yield
and its components in rapeseed.
Australian Journal of Crop Sciences,
4(6): 390-397.
Sharafi Y., Majidi M.M. Jafarzadeh, M. and
Mirlohi, A.2015.Multivariate Analysis of
Genetic Variation in Winter Rapeseed
(Brassica napus L.) Cultivars Journal of
Agricultural Sciences and Technology
Vol. 17: 1319-1331.
Singh, M. and S. Ceccarelli. 1996. Estimation
of heritability of crop traits from variety
trial data. Technical Manual, International
Center for Agricultural Research in the
Dry Areas, Aleppo, Syria.
Tuncturk, M., Yilmaz,İ., Erman, M. and
Tuncturk, R. 2007. Comparison of
Summer Rapeseed (Brassica napuss sp.
Oleifera L.) cultivars for yield and yield
traits under Van ecological conditions.
Pakistan Journal of Botany, 39(1): 81-84.
Yadava D.K., S.C. Giri, M. Vignesh, S.
Vasudev, A.K. Yadav, B. Dass, R. Singh,
N. Singh, T. Mohapatra, K.V. Prabhu,
2011. Genetic variability and trait
association studies in Indian mustard
(Brassica juncea). Indian J. Agri. Sci., 81
(8): 712–716.
Rubby Sandhu, S.K. Rai, Richa Bharti, Amardeep Kour, S.K. Gupta and Ajay Verma. 2017.
Studies on Genetic Diversity among Various Genotypes of Brassica napus L. Using
Morphological Markers. Int.J.Curr.Microbiol.App.Sci. 6(7): 469-480.
doi: />
480