Differences in microRNA expression during tumor development in the transition and peripheral zones of the prostate
Bạn đang xem bản rút gọn của tài liệu. Xem và tải ngay bản đầy đủ của tài liệu tại đây (1019.2 KB, 11 trang )
Carlsson et al. BMC Cancer 2013, 13:362
/>
RESEARCH ARTICLE
Open Access
Differences in microRNA expression during tumor
development in the transition and peripheral
zones of the prostate
Jessica Carlsson4,5,6*, Gisela Helenius3,5, Mats G Karlsson3,5, Ove Andrén4,5,6, Karin Klinga-Levan1 and Björn Olsson2
Abstract
Background: The prostate is divided into three glandular zones, the peripheral zone (PZ), the transition zone
(TZ), and the central zone. Most prostate tumors arise in the peripheral zone (70-75%) and in the transition zone
(20-25%) while only 10% arise in the central zone. The aim of this study was to investigate if differences in miRNA
expression could be a possible explanation for the difference in propensity of tumors in the zones of the prostate.
Methods: Patients with prostate cancer were included in the study if they had a tumor with Gleason grade 3 in
the PZ, the TZ, or both (n=16). Normal prostate tissue was collected from men undergoing cystoprostatectomy
(n=20). The expression of 667 unique miRNAs was investigated using TaqMan low density arrays for miRNAs.
Student’s t-test was used in order to identify differentially expressed miRNAs, followed by hierarchical clustering and
principal component analysis (PCA) to study the separation of the tissues. The ADtree algorithm was used to
identify markers for classification of tissues and a cross-validation procedure was used to test the generality of the
identified miRNA-based classifiers.
Results: The t-tests revealed that the major differences in miRNA expression are found between normal and
malignant tissues. Hierarchical clustering and PCA based on differentially expressed miRNAs between normal and
malignant tissues showed perfect separation between samples, while the corresponding analyses based on
differentially expressed miRNAs between the two zones showed several misplaced samples. A classification and
cross-validation procedure confirmed these results and several potential miRNA markers were identified.
Conclusions: The results of this study indicate that the major differences in the transcription program are those
arising during tumor development, rather than during normal tissue development. In addition, tumors arising in the
TZ have more unique differentially expressed miRNAs compared to the PZ. The results also indicate that separate
miRNA expression signatures for diagnosis might be needed for tumors arising in the different zones. MicroRNA
signatures that are specific for PZ and TZ tumors could also lead to more accurate prognoses, since tumors arising
in the PZ tend to be more aggressive than tumors arising in the TZ.
Keywords: Prostate zones, Prostate cancer, MiRNA expression
* Correspondence:
4
Department of Urology, Örebro University Hospital, Örebro, Sweden
5
School of Health and Medical Sciences, Örebro University, Örebro, Sweden
Full list of author information is available at the end of the article
© 2013 Carlsson et al.; licensee BioMed Central Ltd. This is an Open Access article distributed under the terms of the Creative
Commons Attribution License ( which permits unrestricted use, distribution, and
reproduction in any medium, provided the original work is properly cited.
Carlsson et al. BMC Cancer 2013, 13:362
/>
Background
Prostate cancer is the most common cancer in men in
Western countries and is the second leading cause of
cancer death in this part of the world [1]. The prostate
is divided into three glandular zones, the peripheral zone
(PZ), the transition zone (TZ), and the central zone. It
also has a non-glandular zone called the anterior
fibromuscular stroma. The rates of cancer occurrence
differ markedly between the zones, with most cancers
arising in the PZ (70-75%) and in the TZ (20-25%), while
only about 10% arise in the central zone. It has also been
suggested that cancers in the TZ are less aggressive
and have a lower biochemical recurrence rate than
cancers that develop in the PZ [2,3]. Finding specific
molecular signatures for tumors arising in the PZ or the
TZ could potentially lead to more accurate prognoses
for patients with prostate cancer.
During the last decade microRNAs (miRNAs) have
been shown to be involved in cancer development, with
differential miRNA expression between normal and
malignant samples observed in all human cancers
investigated to date [4].The diagnostic possibilities with
miRNAs have increased since the discovery that miRNA
expression can be measured not only in tissues but also
in serum, plasma and urine [5-9]. The possibility to
measure the expression of miRNAs in body fluids makes
them ideal candidates for diagnostic tests and also for
monitoring disease progression, such as in active surveillance. Several attempts to find miRNA expression profiles for diagnosis and prognosis of prostate cancer have
been made during the last years, but the results have
been inconclusive since different miRNAs have been implicated in each profile suggested to date. The results
nevertheless indicate that it is possible to find a set of
miRNA markers for diagnosis and prognosis of prostate
cancer, since all studies resulted in sets of miRNAs
which could separate between normal and malignant
prostate tissues [10-17]. However, a caveat is that none
of these studies reported from which prostatic zone the
samples were taken. Therefore, one limiting factor for
the diagnostic/prognostic value of the candidate miRNA
biomarkers may be the differences in miRNA expression
patterns between the zones, both in normal and malignant prostate tissues. This could further partly explain
the lack of agreement between the miRNA sets identified in the different studies.
Currently, little is known about the differences in gene
and protein expression between the prostate zones, but
it seems reasonable to assume that the preference for
cancer development in a specific zone is caused by preexisting transcriptome differences between the three
zones in normal tissue. These assumed pre-existing differences could in part be due to developmental differences of the zones, since the peripheral and transition
Page 2 of 11
zones develop from the endoderm of urogenital sinus
while the central zone develops from the wolffian duct
[18,19]. Two large-scale studies have elucidated the
differences in mRNA expression between the zones in
normal prostate tissue. Noel et al. analysed 24,325 genes
and reported that 43 of these were differentially
expressed between PZ and TZ in normal tissues [20].
Heul-Nieuwenhuijsen et al. investigated 15,000 genes
and found 346 of these to be differentially expressed between PZ and TZ [21], with only five genes overlapping
with the results of the study by Noel et al. This large difference in the number of differentially expressed genes,
as well as the small overlap, could be due to differences
between the materials used in the two studies as well as
between the analysis methods.
The results of the two above mentioned studies
[20,21] indicate that there are differences in gene expression between the two zones, and the precise nature of
these differences needs to be investigated further. It is
also noteworthy that no studies have been performed regarding miRNA expression in normal prostate tissue.
Furthermore, neither mRNA nor miRNA expression has
been compared between malignant tissues from the different zones. The aim of the present study was to explore the miRNA expression patterns in different zones
of the prostate, both in normal and malignant tissue,
and to investigate the relationship between miRNA expression and incidence of cancer in the PZ and TZ.
Methods
Patient material
The COSM cohort (Cohort of Swedish Men) was
established in the Västmanland and Örebro counties of
Sweden in 1997. It includes 48,850 men born between
1918 and 1952. Until December 2009, 3232 men in the
cohort had been diagnosed with prostate cancer, 300 of
which had subsequently been subjected to radical prostatectomy. Complete follow up is available for all men with
prostate cancer until January 2011. In order to get a
homogenous study material where potential differentially
expressed miRNAs reflect differences in zone expression, rather than differences in tumor aggressiveness,
patients were only included in the study if they had a
Gleason grade 3 tumor in the PZ, the TZ, or both. From
the 300 men subjected to radical prostatectomy, 13 patients having a tumor with Gleason grade 3 in the TZ
(n=5), in the PZ (n=5) or in both (n=3) were included in
the study. From the latter three patients, one sample of
malignant tissue was taken from each zone. We also included normal prostate tissue from 10 patients diagnosed with bladder cancer, who had been subjected to
radical cystoprostatectomy (sample 1N-10N in Table 1).
The included normal prostate tissue was examined by a
pathologist after radical cystoprostatectomy with the
Carlsson et al. BMC Cancer 2013, 13:362
/>
Page 3 of 11
Table 1 Description of patient material included in the
study
Patient
Age
PZ (GS)
TZ (GS)
Death*
PSA (ng/mL)
1N
80
-
-
0
-
2N
79
-
-
0
-
3N
76
-
-
0
-
4N
66
-
-
0
-
5N
66
-
-
0
-
6N
53
-
-
0
-
7N
52
-
-
0
-
8N
45
-
-
0
-
isolation kit optimized for FFPE tissues (Ambion) before
reverse transcription using the TaqMan® MicroRNA
reverse transcription kit and Megaplex™ RT primers, human pool v2.0 (Applied Biosystems). The cDNA samples
were pre-amplified using Megaplex™ PreAmp primers
and TaqMan® Preamp master mix (Applied Biosystems)
and then diluted in a 0.1X TE Buffer (pH 8.0) before use
in the qPCR reaction. The diluted pre-amplified cDNA
was mixed with TaqMan® PCR master mix II (No
AmpErase UNG, Applied Biosystems) and run in a 40
cycle qPCR reaction on the TaqMan® MicroRNA A and B
Cards version 2.0, thus measuring the expression of 667
unique miRNAs (Applied Biosystems). All reactions were
performed on the Applied Biosystems 7900 HT system.
9N
70
-
-
0
-
10N
71
-
-
0
-
11M
67
3
NT
0
-
Data analysis
12M
71
3
NT
-
8
13M
79
3
NT
0
26
14M
73
3
3
0
-
15M
57
3
NT
0
-
16M
77
3
3
0
-
17M
76
3
NT
0
-
18M
63
NT
3
0
8
19M
65
3
3
0
-
20M
74
NT
3
1
5
21M
91
NT
3
1
8
22M
78
NT
3
1
32
23M
79
NT
3
1
7
Raw CT-values were calculated using the SDS software
(Applied Biosystems), applying manually selected thresholds for each miRNA. Normalization and computation
of statistical tests was performed in the programming
software R [22]. The data were normalized using
qPCRNorm quantile normalization [23]. A paired Student’s t-test (p<0.05) was used to identify miRNAs that
were differentially expressed between the TZ and PZ in
normal tissues, whereas the corresponding unpaired
t-test was used for identifying miRNAs that were
differentially expressed between normal and malignant
tissues in each zone, as well as for the comparison
between malignant tissues from the different zones
(Additional file 1). Results are reported both with and
without correction of the p-values for multiple testing,
using the Benjamini-Hochberg method.
Hierarchical clustering was performed on all samples
and miRNAs investigated using the PermutMatrix clustering tool [24], using Euclidean distance when comparing expression profiles and the average linkage rule
when comparing clusters. Expression values were normalized using the mean center columns method in the
clustering software. Differentially expressed miRNAs
were also clustered using the same method as well as
used in a principal component analysis using Omics
Explorer, version 2.3 (Qlucore AB, Lund, Sweden).
For the 15 miRNAs with lowest p-values for differential expression between normal PZ and TZ, experimentally validated target genes were extracted from TarBase
[25] and miRecords [26] while predicted target genes for
the same miRNAs were extracted from MicroCosm targets [27]. These target genes were then compared to genes
previously identified as differentially expressed between
normal TZ and PZ in the prostate, to investigate if there
was an overlap [20,21]. Experimentally validated target
genes were also extracted for miRNAs identified as differentially expressed between normal and malignant TZ and
PZ tissues using the same databases [25,26] and pathway
N = Normal prostate sample from cystoprostatectomy.
M = Malignant prostate sample from radical prostatectomy.
PZ (GS) = Gleason score in peripheral zone.
TZ (GS) = Gleason score in transition zone.
NT = No tumor in this zone.
* 1= Dead, 0 = Alive.
- Data not available.
same procedure as after a radical prostatectomy and
assessed for prostate cancer without any findings. From
each bladder cancer patient, two samples of normal
prostate tissue were collected, one from the TZ and one
from the PZ (Table 1). The study was approved by The
regional ethical review board in Uppsala, Sweden (2009/
016, Written informed consent for participation in the
study was obtained from the participants as well as consent to publish the data in Table 1).
miRNA profiling
A pathologist marked the PZ and TZ in both normal
and tumor areas on formalin fixed paraffin embedded
(FFPE) prostate tissues, and three cores (Ø0.6 mm) were
collected from each tissue for usage in subsequent total
RNA extraction. The expression profiling was performed
as previously described [10]. In short, total RNA was
extracted using the RecoverAll total nucleic acid
Carlsson et al. BMC Cancer 2013, 13:362
/>
analysis was performed on the validated target genes using
the DAVID functional annotation tool [28].
The ADTree algorithm in the WEKA data mining tool
was used to identify zone-specific signatures, in the form
of alternating decision trees [29,30], for classification of
tissues. The generality of the identified signatures for
classification of unseen tissues was estimated using the
leave-one-out cross-validation procedure [31].
Results
In this study we included 13 patients from the Cohort of
Swedish men (COSM), which had been diagnosed with
prostate cancer and subjected to a radical prostatectomy.
The patients had tumors with Gleason grade 3 in the TZ
(n=5), in the PZ (n=5) or in both (n=3), from the latter
three patients, one sample of malignant tissue was taken
from each zone. Normal prostate tissue from ten patients diagnosed with bladder cancer and subjected to a
radical cystoprostatectomy was also included in the
study (Table 1). The expression of 667 unique miRNAs
was analyzed using the TaqMan® MicroRNA array set
v2.0 from Applied Biosystems.
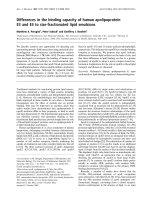
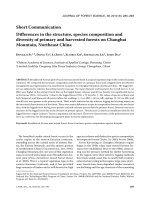
Hierarchical clustering was performed on all samples
and all miRNAs investigated in the study (Figure 1). All
samples except for two normal samples could be separated between normal and malignant tissues indicating
Page 4 of 11
that the expression profiles of all 667 miRNAs investigated can be used to separate between these two types
of tissues. There is also a tendency for the tissues of the
peripheral zone to cluster together and the tissues from
the transition zone to cluster together, regardless of malignancy state. One of the clusters, which include five
malignant and two normal samples from the transition
zone, had very specific expression profiles of four
miRNAs (hsa-miR-639, hsa-miR-601, hsa-miR-520c-3p
and hsa-miR-573), separating them from the rest of the
samples (Figure 1).
Student’s t-tests were performed, with and without
correction for multiple testing, on all combinations of
sample groupings, i.e. normal TZ tissue vs. normal PZ
tissue, malignant TZ tissue vs. malignant PZ tissue, normal TZ tissue vs. malignant TZ tissue, and normal PZ
tissue vs. malignant PZ tissue (for complete results see
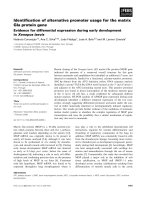
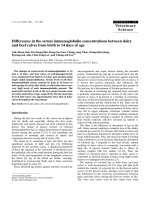
Additional files 2 and 3). The largest sets of differentially
expressed genes were found in the comparisons between
normal and malignant tissues (Figure 2). Between normal and malignant tissues from the TZ 149 miRNAs
were found to be significantly differentially expressed
(231 before applying correction for multiple testing).
The same comparison in the PZ identified 65 significantly differentially expressed miRNAs (150 before
correction). In contrast, only a single miRNA was
Figure 1 Clustering of all miRNAs and all samples investigated. Clustering of all 667 miRNAs and all 36 samples investigated and the specific
expression of five miRNAs in seven of the samples from the TZ. Normal samples are labeled N and malignant samples are labeled M. Samples
from the TZ are labeled T and samples from the PZ are labeled P. Green colors are high expression values while red colors are low expression
values.
Carlsson et al. BMC Cancer 2013, 13:362
/>
Figure 2 The number of differentially expressed miRNAs found
between all combinations of sample groupings.
significantly differentially expressed between the TZ and
PZ in normal tissue (51 before correction) and none between the TZ and PZ in malignant tissue (50 before correction). Overall, these numbers clearly indicate that the
main differences in miRNA expression occur between
normal and malignant tissues, rather than between the
prostate zones, and that these differences arise during
tumor development. However, the particular miRNAs that
are differentially expressed in tumor tissues vs. normal tissues may very well be different for the different zones.
Page 5 of 11
The miRNAs identified as differentially expressed before multiple testing adjustments in the comparison between normal TZ vs. normal PZ and malignant TZ vs.
malignant PZ were used in the subsequent analyses. For
the comparison between normal vs. malignant TZ and
normal vs. malignant PZ, only miRNAs identified as differentially expressed after adjustment were used. The
differentially expressed miRNAs were used in hierarchical clustering and principal component analyses (PCA).
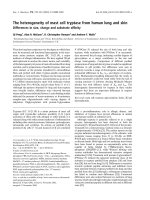
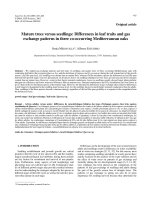
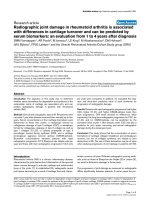
Overall, the clusterings based on miRNAs differentially
expressed between TZ and PZ showed several misplaced
samples, whereas the clusterings based on miRNAs
differentially expressed between normal and malignant
samples showed perfect separations of the sample
groups into two major clusters (Figures 3 and 4). Similarly, the PCA results showed unclear separation between TZ and PZ tissues (Additional file 4) and a much
clearer separation between normal and malignant tissues
(Additional file 5).
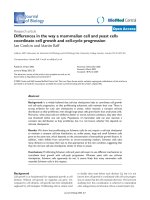
The 65 miRNAs that were differentially expressed
between normal and malignant PZ tissues were subsequently compared to the 149 miRNAs that were differentially expressed between normal and malignant TZ
tissues. The comparison revealed that 111 (75%) of the
miRNAs differentially expressed in the TZ were unique
for TZ but only 27 (42%) of the miRNAs differentially
expressed in the PZ were unique for the PZ (Figure 5A).
Figure 3 Clustering’s on differentially expressed miRNAs between TZ and PZ tissues. Clustering’s are based on miRNAs found to be
differentially expressed (before multiple testing adjustment) between TZ and PZ samples from normal tissue (A) and malignant tissue (B). The
clustering of normal samples resulted in three major clusters, one with seven TZ samples, one with eight PZ samples, and one mixed cluster
containing three TZ and two PZ samples (marked with red box). The clustering of malignant samples resulted in two major clusters, of which
one was mixed (i.e. contained three misplaced TZ samples, red boxes) and one was a small homogeneous TZ cluster. Green colors are high
expression values while red colors are low expression values.
Carlsson et al. BMC Cancer 2013, 13:362
/>
Page 6 of 11
Figure 4 Clustering’s on differentially expressed miRNAs between normal and malignant tissues. Clustering’s are based on miRNAs found
to be differentially expressed (after multiple testing adjustment) between normal and malignant tissue in the PZ (A) and in the TZ (B). Each
clustering resulted in two major clusters, which were both homogeneous with respect to normal and malignant tissues. Green colors are high
expression values while red colors are low expression values.
To further investigate the similarities between these
miRNA sets, validated target genes for the miRNAs were
extracted from miRecords and TarBase [25,26]. A comparison of the target genes for miRNAs differentially
expressed in PZ and TZ showed that TZ and PZ tumors
had 124 target genes in common (59%), while only 61
(29%) and 24 (12%) target genes where specific for the
TZ and PZ tumors, respectively (Figure 5B).Additionally,
a pathway analysis was performed on the validated target
genes, using the DAVID functional annotation tool. This
resulted in 100 different pathways of which 75 (75%)
were common for the TZ and PZ, 17 (17%) were specific
for the TZ target genes and 8 (8%) were specific for the
PZ target genes (Figure 5C and Additional files 6 and 7).
Specific pathways for the TZ included pathways for
infection and inflammation responses and PTENdependent cell cycle arrest, while specific pathways for
the PZ included cell cycle control, Dicer pathway, TGFbeta signaling pathway and Wnt signaling pathway.
The 15 miRNAs with lowest p-values for differential expression between TZ and PZ in normal tissue were chosen
for a more detailed target gene analysis. Validated and
Figure 5 Venn diagram showing the results of target gene and pathway analyses. Venn diagram showing the overlap between A)
Differentially expressed miRNAs in normal and malignant tissues in TZ and PZ, B) Overlap of validated target genes for miRNAs found to be
differentially expressed between normal and malignant TZ vs. PZ and C) Overlap of pathways for the validated target genes. The overlaps were
22%, 59% and 75%, respectively.
Carlsson et al. BMC Cancer 2013, 13:362
/>
Page 7 of 11
predicted target genes for these 15 miRNAs were
extracted from TarBase, miRecords and MicroCosm and
subsequently compared to mRNA genes previously identified as differentially expressed between PZ and TZ in normal prostate tissues [20,21]. The results show that all
these miRNAs have predicted target genes which have
previously been identified as differentially expressed between the two zones, while only two of the miRNAs (miR181c and miR-127-3p) have validated target genes that
have been described as differentially expressed in previous
studies (Table 2). Of the differentially expressed genes between normal TZ and PZ found by Noel et al. and Van
der Heul-Nieuwnhuijsen et al, 21% and 29%, respectively,
were in this study found to be target genes for the 15
miRNAs with lowest p-values for differential expression
between TZ and PZ in normal prostate tissue.
To evaluate potential markers for PZ and TZ tissues
a classification procedure was performed using the
ADTree algorithm, which generates trees where each
decision node specifies a miRNA and a threshold expression value, while the prediction nodes contain numbers, which are summed up when the classification is
done. AD trees were repeatedly generated and tested
using the leave-one-out cross validation procedure and
the classification accuracy was defined as the percentage
of correctly classified test samples. The results from the
cross-validation correspond with the results from the
clustering, PCA and Student’s t-test, showing that the
major differences lie between normal and malignant tissues rather than between the two zones. For classification of normal and malignant tissues, an accuracy of
100% (PZ) and 94% (TZ) was reached and the AD trees
contained only two miRNAs (Table 3). For classification
of normal TZ and PZ tissues, an accuracy of 70% was
reached and the AD tree contained six miRNAs, while
for malignant TZ and PZ tissues, only 56% accuracy
was reached and the AD tree contained eight miRNAs
(Table 3).
Table 2 The 15 miRNAs with lowest p-values for differential expression between TZ and PZ in normal prostate tissue
and their previously identified differentially expressed target genes
miRNA
+/−
Predicted
(validated) target
Noel et al.
[20]
Van der Heul-Nieuwenhuijsen et al. [21]
genes
miR-433
+
880 (2)
*
miR-494
+
707 (1)
DHX9, SYTL2
NAT1, SRPX, KLK3, EDN3, KIAA1324
miR-22*
+
696 (0)
*
BAMBI, PFKFB3, RAB10, NEXN, ATF3, FOLH1, CEBPD, SNX25, MED28, LRRC28
miR-15a*
-
664 (0)
*
PFKFB3, EGR2, EGR1, BIK, KLK3,
miR-15b*
-
669 (0)
*
miR-379
+
799 (1)
S100A4
miR-216b
-
862 (0)
HSD11B1
PCOLCE, LUM, SRPX, RAB27A, MED28, PCP4, CCL2
PBEF1, TRPM4, DDX5
NEXN, SRPX, EGR1, HAT1, PBEF1,
UAP1
C6orf115, GMNN, RBP1, CALD1, ASPA, DBI, ATP2C1, SERPINI1, SRPX,
DUSP1, ECM1, RABGGTB, GRP58, TM4SF1, CCL2
EAF2, C6orf115, IFNGR1, TFPI2,
HAT1, PENK, PBEF1, LPHN2, SFRS9
miR-181c
-
990 (5)
HSD11B1
GATA6, SFRS5, KCNMA1, FKBP1A, ZFYVE26, KLF6, PRKAG2, THBS4, LPHN2,
SPOCK3, EIF4A2, TACSTD2, MYBPC1, TGBR3, RAB3IP, TUBB
miR-543
+
875 (0)
*
KCNMA1, C6orf115, DACH1, FKBP1A. PRKAG2, SERPINI1, RABGGTB, THBS4,
PTGS2, TM4SF1, EIF4A2,SFRS9, KIAA1324, RAB3IP, CCL2
miR-27b*
+
722 (0)
HSD11B1
miR-154
+
738 (0)
EFEMP1
ASPA, MLPH, FBXO2, BRI3, PRRX2, PENK, UAP1, SGCE, TRIM36, EIF4A2, TBCA
EAF2, TNFSF10, GMNN, CSRP2,
GCAT, SRPX, FEZ1, SGCE, DDX5
miR-424*
+
535 (1)
DHX9, HOXD13
miR-495
+
896 (0)
*
miR-337-3p
+
888 (0)
SPON1
miR-127-3p
+
741 (0)
C6orf32, NELL2
HEPH, C6orf115, FKBP1A, PRKAG2, HPN, ECM1, THBS4, COL16A1, CCL2
SFRS5, TACSTD1, C6orf115, JUNB, SERPINI1, MCM2, NANS, DUSP1, CITED2,
LIMS2, NIPA2, NDN, PBEF1, TFF1, UAP1, RPRM, CYP1B1, RAB3IP, CCL2
NRG2, TRIT1, ATF3, SPON1, CSRP2,
C15orf5, COL16A1, NDN, LHFP
XBP1, KCNMA1, FKBP1A, GCAT, GPR30, KCNJ8, TUBGCP2, TFF1, PTGDS, GADD45G
+/− Up/down-regulated in the transition zone compared to the peripheral zone.
* No target gene (validated or predicted) overlap.
Genes marked in bold are validated target genes.
Italicized genes have been found to be differentially expressed between PZ and TZ in both reference papers [20,21].
Carlsson et al. BMC Cancer 2013, 13:362
/>
Page 8 of 11
Table 3 Results from the cross-validation procedure for evaluation of potential markers
Comparison
Accuracy
No. of miRNAs
Normal PZ vs. Malignant PZ
100%
2
miRNA names
miR-187 and miR-19a
Normal TZ vs. Malignant TZ
94%
2
miR-143 and miR-25
Normal TZ vs. Normal PZ
70%
6
miR-93, miR-95, miR-154, miR
Malignant TZ vs. Malignant PZ
56%
8
541, miR-539, miR-28-3p
Discussion
To our knowledge, this is the first time that miRNA expression patterns have been analysed and compared between the PZ and the TZ of both normal and malignant
prostate tissues. Unique miRNA signatures for tumors
arising in the PZ and TZ could be beneficial in the diagnosis of prostate cancer if they reflect significant differences between tumors of different origin. Signatures for
tumors of different origin could also help in making
more accurate prognoses, since tumors arising in the PZ
are suggested to be more aggressive and associated with
worse outcome. Today, there are no specific expression
signatures (neither mRNA- or miRNA-based) for the
different prostatic zones. Prostate tumors often consist
of several independent foci and it is difficult to identify
the original focus and where it arose, since a tumor can
arise in one zone and grow into the adjacent zone.
When performing a hierarchical clustering of all samples and miRNAs investigated in this study, we found a
cluster of seven TZ samples, with an expression profile
specific for four miRNAs. There is no obvious reason for
this phenomenon regarding clinical data since the cluster includes both normal and malignant tissues (two
normal and five malignant). To our knowledge, only one
of these five miRNAs (miR-520c) has been implicated in
prostate cancer before [32,33]. In these studies, miR520c was down regulated in prostate cancer tissues and
it was suggested that it is involved in tumor migration
and invasion, thus constituting a metastasis-promoting
miRNA [33]. This does not agree with our results since
miR-520c is upregulated in malignant tissues compared
to normal tissues, regardless of zonal origin. Included in
this study are four patients who died from their prostate
cancer and two of the samples from these patients are
found within this specific cluster. Since miR-520c is considered to be a metastasis-promoting miRNA this leads
to the hypothesis that the set of four miRNAs somehow
could be related to a more aggressive disease. However,
this does not explain why two normal samples were included in the cluster or why the other two samples with
a bad outcome of their prostate cancer were not included. Further studies need to be performed to investigate the expression of these four miRNAs in a larger
miR-145-3p, miR-19b-1-5p, miR-493-5p, miR-195,
miR-548b-5p, miR-182-3p, miR-95, miR-187
cohort to be able to explain the reason for this differential expression between TZ tissues.
One miRNA, miR-433, was significantly differentially
expressed between normal PZ and TZ tissues in this
study. This miRNA has two validated target genes,
HDAC6 and FGF20, which have both been implicated in
tumor development [34-36]. High levels of HDACs
results in increased proliferation, decreased apoptosis,
increased angiogenesis and induction of different oncogenes [37]. FGF20 is normally only expressed in the
adult central nervous system but is expressed in malignant tissues [38], and therefore it seems reasonable to
think that FGF20 is under strong control of miR-433 in
normal prostate tissues and that this control is lost during tumor progression. Since miR-433 is over-expressed
in normal TZ tissue compared to normal PZ tissue, it
could be hypothesized that the up-regulated miR-433
suppresses its target genes, HDAC6 and FGF20, and results in extra protection against tumor development in
the TZ, and that this function is not found in the normal
PZ. This hypothesis could be a possible explanation for
the difference in tumor occurrence between the zones.
Van der Heul-Nieuwenhuijsen et al., has a similar hypothesis for the PZ. They found that genes that are
over-expressed in normal PZ tissue also tend to be overexpressed in PZ tumors. They suggested that this high
expression of genes in normal PZ could support malignant growth, thus making the PZ more prone to tumor
development [21].
Since only one miRNA was found to be significantly
differentially expressed between normal PZ and TZ tissues, the 15 miRNAs that were closest to a statistically
significant differential expression were chosen for target
gene analysis. This analysis showed that two of the validated target genes (XBP1 and GATA6) and 107 predicted target genes (see Table 2) have been found to be
differentially expressed in previous studies [20,21]. This
result indicates that a substantial proportion of the
deregulated mRNA expression is due to deregulated
miRNA expression, since 21% of the mRNA genes identified in (15) and 29% of the mRNA genes identified in
(16) are target genes of the 15 miRNAs included in this
analysis.
Carlsson et al. BMC Cancer 2013, 13:362
/>
A central issue in this work is to discern where the
major differences in miRNA expression occur, between
the zones of the prostate, or between normal and
malignant tissues. Many more differentially expressed
miRNAs were found when comparing normal with
malignant tissue (149 for TZ tissues, and 65 for PZ tissues) than when comparing tissues from the different
zones (only one miRNA for normal TZ vs. normal PZ,
and none for malignant TZ vs. malignant PZ). This
strongly indicates that the major differences in the transcription program are those arising during tumor development, rather than during normal tissue development.
At the same time, the clustering and principal component analysis indicate that also the non-significant
changes in miRNA expression between tissues from the
two zones are large enough for detection of zonal origin
(TZ or PZ). It is important to keep in mind that many
small, but coordinated, changes in expression can be significant when considered in combination, even if the
changes in expression of the individual miRNAs are statistically non-significant.
The results from the AD tree classification procedure
showed that normal and malignant tissues could be classified with an accuracy of 100% (PZ) and 94% (TZ) with
only two miRNAs used in the tree. One miRNA, miR187, appears in the ADtree for classification of normal
vs. malignant PZ tissues as well as for malignant TZ vs.
malignant PZ tissues. This indicates that miR-187 can
generally be used to classify tumors arising in the PZ.
The same scenario is seen for miR-95, which appears in
the ADtree for normal TZ vs. normal PZ and malignant
TZ vs. malignant PZ, indicating that miR-95 can be used
to classify TZ vs. PZ tissues in different scenarios. None
of these miRNAs have validated target genes although
they have been found to be deregulated in cancer in previous studies. MiR-187 has been found to be upregulated
in ovarian cancers and was also associated with
recurrence-free survival and could be used as an independent prognostic factor for ovarian cancer [39]. MiR95 has been shown to promote cell growth in colorectal
cancer cells [40]. The hypothesis that these two miRNAs
can be used to classify between normal and malignant
PZ tissues (miR-187) and between TZ and PZ tissues
(miR-95) needs to be validated in a new, larger material.
When comparing the lists of differentially expressed
miRNAs between normal and malignant TZ and PZ it
was found that the TZ had more unique differentially
expressed miRNAs (111) compared to the PZ (27)
(Figure 5). This indicates that the changes during tumor
development are more extensive in the TZ compared to
the PZ since the changes in the TZ involve more
miRNAs of which many are unique for the TZ. These
results show that there may be a need for zone-specific
marker sets for diagnosis and prognosis. In the target
Page 9 of 11
gene and pathway analysis we could see that even
though there is a large overlap between target genes and
pathways in TZ and PZ, there are still unique genes and
pathways for each zone. This further strengthens the indication that there are differences in how tumor development occurs in the different zones. It should be noted
that the target gene and pathway analysis was only
performed on validated target genes. Different results
could be found if predicted target genes were also included in the analysis.
One limitation of this study is its size, since only 10
normal samples from each zone and eight malignant
samples from each zone were included. This could in
part explain the lack of statistically significant differentially expressed miRNAs between normal TZ and PZ
samples and malignant TZ and PZ samples. It is also
possible that there is no difference between normal TZ
and PZ and that the difference is found in how the
tumor develops, although one would expect to find a
difference between malignant TZ and PZ samples since
we have shown that different miRNAs are differentially
expressed between normal and malignant tissues in TZ
and PZ. A second limitation of this study is the limited
histo-pathological data. This study could be seen as an
initial attempt, indicating on which miRNAs the focus
should lie in future studies to further elucidate the differences in miRNA and/or mRNA expression between
TZ and PZ zones, both in normal and malignant tissues.
Conclusions
The results of this study indicate that the major differences in the transcription program are those arising
during tumor development, rather than during normal
tissue development. In addition, tumors arising in the
TZ have more unique differentially expressed miRNAs
compared to the PZ. The results also indicate that separate miRNA expression signatures for diagnosis might be
needed for tumors arising in the different zones.
Additional files
Additional file 1: Overview of the sample sets and comparisons of
expression levels. PZ normal and TZ normal samples are paired (two
samples from the same patient), whereas normal and malignant samples
from each zone are unpaired, as well as the malignant samples from
different zones (which were taken from different prostate cancer patients).
Additional file 2: Differentially expressed miRNAs (p<0.05) between
normal and malignant TZ tissues before multiple testing
adjustments.
Additional file 3: Differentially expressed miRNAs (p<0.05) between
normal and malignant PZ tissues before multiple testing adjustments.
Additional file 4: Principal component analysis on differentially
expressed miRNAs between PZ and TZ tissues. The principal
component analysis is based on the miRNAs found to be differentially
expressed (before multiple testing adjustment) between PZ and TZ in
Carlsson et al. BMC Cancer 2013, 13:362
/>
normal prostate samples (A) and malignant tissue samples (B).
Green = PZ, Red = TZ.
Additional file 5: Principal component analysis on differentially
expressed miRNAs between normal and malignant tissues. The
principal component analysis is based on the miRNAs found to be
differentially expressed (after multiple testing) between normal and
malignant PZ tissues (A) and normal and malignant TZ tissues (B).
Green = Malignant, Red = Normal.
Additional file 6: Results from pathway analysis of target genes for
the differentially expressed miRNAs between normal and malignant
TZ tissues.
Additional file 7: Results from pathway analysis of target genes for
the differentially expressed miRNAs between normal and malignant
PZ tissues.
Page 10 of 11
6.
7.
8.
9.
10.
Abbreviations
CT: Cycle threshold; CZ: Central zone; FFPE: Formalin fixed paraffin
embedded; miRNA: MicroRNA; nt: nucleotide; PZ: Peripheral zone;
qPCR: Quantitative polymerase chain reaction; TE: Tris EDTA; TZ: Transition
zone.
Competing interests
The authors declare that they have no competing interests.
Authors’ contributions
All authors participated in the design of the study. JC carried out all
laboratory work, performed all data analyses and wrote the initial draft of the
manuscript. GH, OA, KKL and BO supervised the project. MK carried out the
pathological marking of the tissues. JC, BO and KKL jointly improved the
manuscript from the initial draft. JC and BO analysed the clusterings, PCA
and AD tree results. All authors read and approved the final manuscript.
Acknowledgements
This work has been supported by the Swedish Knowledge Foundation
through the Industrial PhD program in Medical Bioinformatics at Corporate
Alliances, Karolinska Institute, Lions cancer research foundation,
Nyckelfonden, Örebro county council research committee and Wilhelm and
Martina Lundgrens research foundation.
Author details
1
Systems Biology Research Centre – Tumor Biology, School of Life Sciences,
University of Skövde, Skövde, Sweden. 2Systems Biology Research Centre –
Bioinformatics, School of Life Sciences, University of Skövde, Skövde, Sweden.
3
Department of Laboratory Medicine, Örebro University Hospital, Örebro,
Sweden. 4Department of Urology, Örebro University Hospital, Örebro,
Sweden. 5School of Health and Medical Sciences, Örebro University, Örebro,
Sweden. 6Transdisciplinary Prostate Cancer Partnership (ToPCaP), Örebro
University hospital, Clinical research centre (KFC) M-building 1st floor, Örebro
701 85, Sweden.
Received: 4 October 2012 Accepted: 9 July 2013
Published: 29 July 2013
References
1. Garcia M, Jemal A, Ward EM, Center MM, Hao Y, Siegel RL, Thun MJ: Global
Cancer Facts & Figures. Atlanta, GA: American Cancer Society; 2007.
2. McNeal JE, Redwine EA, Freiha FS, Stamey TA: Zonal distribution of
prostatic adenocarcinoma. Correlation with histologic pattern and
direction of spread. Am J Surg Pathol 1988, 12:897–906.
3. Noguchi M, Stamey TA, Neal JE, Yemoto CE: An analysis of 148
consecutive transition zone cancers: clinical and histological
characteristics. J Urol 2000, 163:1751–1755.
4. Visone R, Pallante P, Vecchione A, Cirombella R, Ferracin M, Ferraro A,
Volinia S, Coluzzi S, Leone V, Borbone E, et al: Specific microRNAs are
downregulated in human thyroid anaplastic carcinomas. Oncogene 2007,
26:7590–7595.
5. Chen X, Ba Y, Ma L, Cai X, Yin Y, Wang K, Guo J, Zhang Y, Chen J, Guo X,
et al: Characterization of microRNAs in serum: a novel class of
11.
12.
13.
14.
15.
16.
17.
18.
19.
20.
21.
22.
23.
24.
25.
26.
27.
biomarkers for diagnosis of cancer and other diseases. Cell Res 2008,
18:997–1006.
Gilad S, Meiri E, Yogev Y, Benjamin S, Lebanony D, Yerushalmi N, Benjamin
H, Kushnir M, Cholakh H, Melamed N, et al: Serum microRNAs are
promising novel biomarkers. PLoS One 2008, 3:e3148.
Ng EK, Chong WW, Jin H, Lam EK, Shin VY, Yu J, Poon TC, Ng SS, Sung JJ:
Differential expression of microRNAs in plasma of patients with
colorectal cancer: a potential marker for colorectal cancer screening.
Gut 2009, 58:1375–1381.
Hanke M, Hoefig K, Merz H, Feller AC, Kausch I, Jocham D, Warnecke JM,
Sczakiel G: A robust methodology to study urine microRNA as tumor
marker: microRNA-126 and microRNA-182 are related to urinary bladder
cancer. Urol Oncol 2010, 28:655–661.
Yun SJ, Jeong P, Kim WT, Kim TH, Lee YS, Song PH, Choi YH, Kim IY, Moon
SK, Kim WJ: Cell-free microRNAs in urine as diagnostic and prognostic
biomarkers of bladder cancer. Int J Oncol 2012, 41:1871–1878.
Carlsson J, Davidsson S, Helenius G, Karlsson M, Lubovac Z, Andren O, Olsson B,
Klinga-Levan K: A miRNA expression signature that separates between
normal and malignant prostate tissues. Cancer Cell Int 2011, 11:14.
Volinia S, Calin GA, Liu CG, Ambs S, Cimmino A, Petrocca F, Visone R, Iorio
M, Roldo C, Ferracin M, et al: A microRNA expression signature of human
solid tumors defines cancer gene targets. Proc Natl Acad Sci USA 2006,
103:2257–2261.
Tong AW, Fulgham P, Jay C, Chen P, Khalil I, Liu S, Senzer N, Eklund AC, Han
J, Nemunaitis J: MicroRNA profile analysis of human prostate cancers.
Cancer Gene Ther 2009, 16:206–216.
Porkka KP, Pfeiffer MJ, Waltering KK, Vessella RL, Tammela TL, Visakorpi T:
MicroRNA expression profiling in prostate cancer. Cancer Res 2007,
67:6130–6135.
Mattie MD, Benz CC, Bowers J, Sensinger K, Wong L, Scott GK, Fedele V,
Ginzinger D, Getts R, Haqq C: Optimized high-throughput microRNA
expression profiling provides novel biomarker assessment of clinical
prostate and breast cancer biopsies. Mol Cancer 2006, 5:24.
Ozen M, Creighton CJ, Ozdemir M, Ittmann M: Widespread deregulation of
microRNA expression in human prostate cancer. Oncogene 2008, 27:1788–1793.
Ambs S, Prueitt RL, Yi M, Hudson RS, Howe TM, Petrocca F, Wallace TA, Liu
CG, Volinia S, Calin GA, et al: Genomic profiling of microRNA and
messenger RNA reveals deregulated microRNA expression in prostate
cancer. Cancer Res 2008, 68:6162–6170.
Schaefer A, Jung M, Mollenkopf HJ, Wagner I, Stephan C, Jentzmik F, Miller K,
Lein M, Kristiansen G, Jung K: Diagnostic and prognostic implications of
microRNA profiling in prostate carcinoma. Int J Cancer 2010, 126:1166–1176.
McNeal JE: Development and comparative anatomy of the prostate. In
Benign prostatic hyperplasia. Washington DC: DHEW (NIH); 1976.
McNeal JE, Leav I, Alroy J, Skutelsky E: Differential lectin staining of central
and peripheral zones of the prostate and alterations in dysplasia.
Am J Clin Pathol 1988, 89:41–48.
Noel EE, Ragavan N, Walsh MJ, James SY, Matanhelia SS, Nicholson CM, Lu
YJ, Martin FL: Differential gene expression in the peripheral zone
compared to the transition zone of the human prostate gland. Prostate
Cancer Prostatic Dis 2008, 11:173–180.
van der Heul-Nieuwenhuijsen L, Hendriksen PJ, van der Kwast TH, Jenster G:
Gene expression profiling of the human prostate zones. BJU Int 2006,
98:886–897.
Gentleman RC, Carey VJ, Bates DM, Bolstad B, Dettling M, Dudoit S, Ellis B,
Gautier L, Ge Y, Gentry J, et al: Bioconductor: open software development
for computational biology and bioinformatics. Genome Biol 2004, 5:R80.
Mar JC, Kimura Y, Schroder K, Irvine KM, Hayashizaki Y, Suzuki H, Hume D,
Quackenbush J: Data-driven normalization strategies for high-throughput
quantitative RT-PCR. BMC Bioinforma 2009, 10:110.
Caraux G, Pinloche S: PermutMatrix: a graphical environment to arrange
gene expression profiles in optimal linear order. Bioinformatics 2005,
21:1280–1281.
Sethupathy P, Corda B, Hatzigeorgiou AG: TarBase: A comprehensive
database of experimentally supported animal microRNA targets.
RNA 2006, 12:192–197.
Xiao F, Zuo Z, Cai G, Kang S, Gao X: Li T: miRecords: an integrated resource
for microRNA-target interactions. Nucleic Acids Res 2009, 37:D105–110.
Griffiths-Jones S, Grocock RJ, van Dongen S, Bateman A: Enright AJ:
miRBase: microRNA sequences, targets and gene nomenclature.
Nucleic Acids Res 2006, 34:D140–144.
Carlsson et al. BMC Cancer 2013, 13:362
/>
Page 11 of 11
28. da Huang W, Sherman BT, Lempicki RA: Systematic and integrative
analysis of large gene lists using DAVID bioinformatics resources.
Nat Protoc 2009, 4:44–57.
29. Freund YM L: The Alternating Decision Tree Algorithm. In Proceedings of
the 16th International Conference on Machine Learning. Morgan Kaufmann
Publishers Inc; 1999:124–133.
30. Pfahringer B, Holmes G, Kirkby R: Optimizing the Induction of Alternating
Decision Trees. In Proceedings of the Fifth Pacific-Asia Conference on
Advances in Knowledge Discovery and Data Mining. Lecture Notes in
Computer Science; 2001:477–487.
31. Hall M, Frank E, Holmes G, Pfahringer B, Reutemann P, Witten I: The WEKA
Data Mining Software: An Update. SIGKDD Explorations 2009, 11:10–18.
32. Yang K, Handorean AM, Iczkowski KA: MicroRNAs 373 and 520c Are
Downregulated in Prostate Cancer, Suppress CD44 Translation and
Enhance Invasion of Prostate Cancer Cells in vitro. Int J Clin Exp Pathol
2009, 2:361–369.
33. Huang Q, Gumireddy K, Schrier M, le Sage C, Nagel R, Nair S, Egan DA, Li A,
Huang G, Klein-Szanto AJ, et al: The microRNAs miR-373 and miR-520c
promote tumour invasion and metastasis. Nat Cell Biol 2008, 10:202–210.
34. Aldana-Masangkay GI, Sakamoto KM: The role of HDAC6 in cancer.
J Biomed Biotechnol 2011, 2011:875824.
35. Lee YS, Lim KH, Guo X, Kawaguchi Y, Gao Y, Barrientos T, Ordentlich P, Wang
XF, Counter CM, Yao TP: The cytoplasmic deacetylase HDAC6 is required for
efficient oncogenic tumorigenesis. Cancer Res 2008, 68:7561–7569.
36. Chamorro MN, Schwartz DR, Vonica A, Brivanlou AH, Cho KR, Varmus HE:
FGF-20 and DKK1 are transcriptional targets of beta-catenin and FGF-20
is implicated in cancer and development. EMBO J 2005, 24:73–84.
37. Abbas A, Gupta S: The role of histone deacetylases in prostate cancer.
Epigenetics 2008, 3:300–309.
38. Jeffers M, Shimkets R, Prayaga S, Boldog F, Yang M, Burgess C, Fernandes E,
Rittman B, Shimkets J, LaRochelle WJ, Lichenstein HS: Identification of a
novel human fibroblast growth factor and characterization of its role in
oncogenesis. Cancer Res 2001, 61:3131–3138.
39. Chao A, Lin CY, Lee YS, Tsai CL, Wei PC, Hsueh S, Wu TI, Tsai CN, Wang CJ,
Chao AS, et al: Regulation of ovarian cancer progression by microRNA187 through targeting Disabled homolog-2. Oncogene 2012, 31:764–775.
40. Huang Z, Huang S, Wang Q, Liang L, Ni S, Wang L, Sheng W, He X, Du X:
MicroRNA-95 promotes cell proliferation and targets sorting Nexin 1 in
human colorectal carcinoma. Cancer Res 2011, 71:2582–2589.
doi:10.1186/1471-2407-13-362
Cite this article as: Carlsson et al.: Differences in microRNA expression
during tumor development in the transition and peripheral zones of
the prostate. BMC Cancer 2013 13:362.
Submit your next manuscript to BioMed Central
and take full advantage of:
• Convenient online submission
• Thorough peer review
• No space constraints or color figure charges
• Immediate publication on acceptance
• Inclusion in PubMed, CAS, Scopus and Google Scholar
• Research which is freely available for redistribution
Submit your manuscript at
www.biomedcentral.com/submit