Status of kinases in Epstein-Barr virus and Helicobacter pylori Coinfection in gastric Cancer cells
Bạn đang xem bản rút gọn của tài liệu. Xem và tải ngay bản đầy đủ của tài liệu tại đây (4.08 MB, 14 trang )
Sonkar et al. BMC Cancer
(2020) 20:925
/>
RESEARCH ARTICLE
Open Access
Status of kinases in Epstein-Barr virus and
Helicobacter pylori Coinfection in gastric
Cancer cells
Charu Sonkar1, Tarun Verma1, Debi Chatterji2, Ajay Kumar Jain2 and Hem Chandra Jha1*
Abstract
Background: Helicobacter pylori (H. pylori) and Epstein - Barr virus (EBV) plays a significant role in aggressive gastric
cancer (GC). The investigation of genes associated with these pathogens and host kinases may be essential to
understand the early and dynamic progression of GC.
Aim: The study aimed to demonstrate the coinfection of EBV and H. pylori in the AGS cells through morphological
changes, expression of the kinase and the probable apoptotic pathways.
Methods: Genomic DNA isolation of H. pylori and its characterization from clinical samples were performed. RTqPCR of kinases was applied to scrutinize the gene expression of kinases in co-infected GC in a direct and indirect
(separated through insert size 0.45 μm) H. pylori infection set up. Morphological changes in co-infected GC were
quantified by measuring the tapering ends of gastric epithelial cells. Gene expression profiling of apoptotic genes
was assessed through RT-qPCR.
Results: An interleukin-2-inducible T-cell kinase (ITK) showed significant upregulation with indirect H. pylori
infection. Moreover, Ephrin type-B receptor six precursors (EPHB6) and Tyrosine-protein kinase Fyn (FYN) showed
significant upregulation with direct coinfection. The tapering ends in AGS cells were found to be extended after 12
h. A total of 24 kinase genes were selected, out of which EPHB6, ITK, FYN, and TYK2 showed high expression as
early as 12 h. These kinases may lead to rapid morphological changes in co-infected gastric cells. Likewise,
apoptotic gene expression such as APAF-1 and Bcl2 family genes such as BAD, BID, BIK, BIM, BAX, AND BAK were
significantly down-regulated in co-infected AGS cells.
Conclusion: All the experiments were performed with novel isolates of H. pylori isolated from central India, for the
functional assessment of GC. The effect of coinfection with EBV was more profoundly observed on morphological
changes in AGS cells at 12 h as quantified by measuring the tapering of ends. This study also identifies the kinase
and apoptotic genes modulated in co-infected cells, through direct and indirect approaches. We report that ITK,
EPHB6, TYK2, FYN kinase are enhanced, whereas apoptotic genes such as APAF-1, BIK, FASL, BAX are significantly
down-regulated in AGS cells coinfected with EBV and H. pylori.
Keywords: Gastric cancer, Helicobacter pylori, Epstein Barr virus, Interleukin-2-inducible T-cell kinase, Tyrosine-protein
kinase Fyn, Adenocarcinoma gastric cell
* Correspondence:
1
The Discipline of Biosciences and Biomedical Engineering, Indian Institute of
Technology Indore, Room no. 302, School Building, IIT Indore, Khandwa
Road, Simrol, Indore 453552, India
Full list of author information is available at the end of the article
© The Author(s). 2020 Open Access This article is licensed under a Creative Commons Attribution 4.0 International License,
which permits use, sharing, adaptation, distribution and reproduction in any medium or format, as long as you give
appropriate credit to the original author(s) and the source, provide a link to the Creative Commons licence, and indicate if
changes were made. The images or other third party material in this article are included in the article's Creative Commons
licence, unless indicated otherwise in a credit line to the material. If material is not included in the article's Creative Commons
licence and your intended use is not permitted by statutory regulation or exceeds the permitted use, you will need to obtain
permission directly from the copyright holder. To view a copy of this licence, visit />The Creative Commons Public Domain Dedication waiver ( applies to the
data made available in this article, unless otherwise stated in a credit line to the data.
Sonkar et al. BMC Cancer
(2020) 20:925
Background
Cancer is the second leading cause of death globally and
was responsible for an estimated 960,000 deaths in 2018.
Globally, about 1 in 6 deaths occur due to cancer with
gastric cancer (GC) being the third leading cause of
cancer-related deaths. Despite primary management
which consists of surgical resection followed by radiation
therapy and chemotherapy, it is poorly prognosticated
[1]. The delay in the detection of GC leads to frequent
relapse and metastasis. Hence, it is imperative to find
the serendipitous prognostic markers, which may be
helpful in early diagnosis of GC.
The crucial link between GC and H. pylori is well
established [2]. The H. pylori are considered a type I carcinogen in GC [3]. H. pylori is prevalent across the globe
with significantly higher incidence seen in the eastern
part of Asia, such as Japan and Korea [4]. H. pylori
shows a high level of intra-species genetic diversity
where strain-specific features are critical for progression
of GC [4]. If H. pylori infection remains untreated, it colonizes the stomach and can persevere lifelong. The driving factors which turn H. pylori into pathogenic bacteria
are poorly known. Kinases play a role as pivotal regulators in epigenetic modulation in various diseases, including cancer [5]. Recent studies suggested that H. pylori
infection leads to the up-regulation of tyrosine kinase,
MAPK cascade, PDK1, AKT3, SRC, FYN, YES, and
mTOR, and dysregulation of non-receptor tyrosine kinase in cancer progression [6–9].
The viral coded protein can also cause tumorigenesis,
which is derived from the transformation of the
temperature-sensitive mutation of the virus [10]. Limited
reports are available related to the molecular mechanism
of virus mediated tumorigenesis [11]. The involvement
of kinases, bacteria, and viruses in different types of cancers has been sequentially investigated for the development of cancer therapy. The protein kinase association
with v-Src in-vitro was a breakthrough in the field of
cancer biology [11]. Several reports suggest the association of Rous sarcoma virus with protein kinase activity
related to the cancer disease [12]. Interestingly, kinases
are considered as a potential target in cancer therapy.
Finally, the discovery of EBV, the first human virus associated with cancer, clearly showed the oncogenic potential of microorganisms [13]. Most of the human
cancers (15–20%) are associated with a viral infection,
and EBV is recognized as one of the contributors in GC
(9% of all GC) [14]. The exact mechanism of EBV as an
oncogenic agent in GC is poorly understood. The EBV is
associated with several lymphoid and epithelial cancers
and is considered as an active oncogenic agent in GC
progression [15]. In the EBV associated GC, host genes
such as JAK2, MET, FGFR2, BRAF, RAF, EPHA4, PAK1,
PAK2, EPHB6, ERBB4, ERBB2, and ITK are up-
Page 2 of 14
regulated [16–22]. In contrast, FGFR4 and ROR2 genes
are down-regulated in GC [23, 24]. In Asian countries,
the incidence of EBV positive person developing GC are
rapidly increasing (6–10% approximately). Moreover,
western and central Asian countries have a considerably
higher frequency of EBV positive cases [25]. Another
challenging aspect is the coinfection of EBV with H. pylori that has been reported to cause aggressive GC [26].
Thereby, it is imperative to develop a coinfection model
for investigating the progression of GC, which can be
used to test the potential role of protein kinases, which
is one of the hallmarks in all cancers.
To the best of our knowledge, this is the first report
that shows the association of EBV and H. pylori (coinfection model) in GC through kinase protein. In view of
above, the present study was conducted with following
objectives: (1) To demonstrate the coinfection of EBV
and H. pylori in AGS cell line for GC progression, (2)
To determine the morphological changes after coinfection, (3) To evaluate the expression of the kinases in coinfection and; (4) To study the probable apoptotic
pathway involved in the co-infected GC.
Methods
Animal cell cultures and H. pylori cultures
Adenocarcinoma gastric (AGS) cell line was procured
from National Centre for Cell Science (NCCS), Pune,
India. The cells were grown in Dulbecco’s modified Eagle’s medium (DMEM; Himedia, Mumbai, India) supplemented with 10% fetal bovine serum (FBS; BIOWEST,
South America origin), 1% penicillin-streptomycin
(Himedia, Mumbai, India). Infectious EBV was produced
by transfection of BAC-EBV-GFPWT into HEK-293 T
(human embryonic kidney cell) cells, selection followed
by chemical induction. We received the transfected
HEK293T EBV BAC as gift from University of Pennsylvania, USA, which were further cultured in the lab. Cultured HEK 293 T EBV BAC were induced for 5 days
with 20 ng/ml tetradecanoyl phorbol acetate (TPA) and
3 mM butyric acid (Sigma-Aldrich Corp., St. Louis,
MO). The supernatant from cell culture was collected
and treated with DNAse. The viruses were concentrated
by ultracentrifugation 23,500×g at 4 °C for 1 h 30 min
and quantified through qRT-PCR [27–29]. The infective
dose of EBV was determined by infecting 25 × 104 AGS
cells seeded in 6 well plates with 0, 25, 50, 75, 100, and
125 μl of the isolated virus. It was followed by isolation
of mRNA, preparation of cDNA, and RT-qPCR for detection of EBNA-1. EBNA1 oncoprotein is the only viral
protein expressed in all forms of latency during EBV infection [30]. We confirmed the presence of EBV in the
AGS cells through RT-qPCR. RT-qPCR is a recognized
method for determining multiplicity of infection which
has been used in other studies as well, and thus we used
Sonkar et al. BMC Cancer
(2020) 20:925
this method to determine the titer value [31, 32]. We
found that the infective dose resulting in high expression
of EBNA-1 was 100 μl which corresponds to 20 MOI
[33, 34]. The H. pylori strain I10 was kindly provided by
Dr. Asish Kumar Mukhopadhyay (National Institute of
Cholera and Enteric Diseases, ICMR, Kolkata, India).
The reference strain I10 has also been used and reported
in one of our previous studies [35]. The biopsy sample
and gastric juice were provided by Dr. Ajay Kumar Jain
(gastroenterologist), Choithram Hospital and Research
Centre, Madhya Pradesh, India. Cell culture experiments
were performed at 37 °C in a humidified environment
supplemented with 5% CO2. The H. pylori strains were
grown in Whitley DG250 Anaerobic Workstation at
37 °C with micro-aerophilic conditions (85% N2, 10%
CO2, and 5% O2).
Isolation and identification of H. pylori
The rapid urease test kit (CLO Test Ballard Medical
Products, Draper, UT, USA) was used on gastric biopsy
samples to check the presence of H. pylori. Gastric juices
were also obtained from RUT positive patients. The tissue homogenate was prepared by crushing the biopsy
samples. A loop-full of tissue homogenate was cultured
on a non-selective medium such as Brain Heart Infusion
media (BD-DIFCO, USA). This media was supplemented
with H. pylori selective antibiotics such as vancomycin,
cefsulodin, amphotericin, and trimethoprim with 10, 5,
5, and 5 mg/L, respectively (Sigma Aldrich, St Louis,
MO, USA). These plates were incubated in a microaerophilic environment for 3–5 days. A point sized colony was identified and used for the Gram staining. The
colony was screened through morphological similarities
with H. pylori. The samples were human gastric biopsy
and gastric juice; thus, they were named HB and HJ, respectively, followed by a numeral that denotes the patient number according to the sequence of sample
collection.
Further, H. pylori were confirmed by polymerase chain
reaction (PCR) for 16S rRNA gene. For the present
study, two clinically isolated bacterial strains were considered; HB1 (human biopsy sample#1), HJ9 (Human
gastric juice sample#9), and one reference strain I10.
The H. pylori bacteria were grown in selective media in
a 14 ml round bottom snap cap tube (14 ml round bottom snap cap tube (BD Biosciences, Franklin Lakes, NJ,
USA - Catalogue No. 352001). They were then incubated in the microaerophilic chamber for 72 h. Subsequently, 150 μl of grown culture was placed in duplicate
in 96 well flat-bottom plates, and optical density (OD)
was recorded at 600 nm (Synergy H1 Hybrid MultiMode Reader, BioTek). An optical density of 0.3 at 600
nm represents 500 million CFU/ mL [36]. The final OD
value was normalized with media as a negative control
Page 3 of 14
[35, 37]. The number of bacterial cells per ml (CFU/mL)
of culture was evaluated according to the final OD, and
the required volume of the bacterial culture for infection
was then calculated.
Cell proliferation measurement
25 × 104 AGS cells were infected with H. pylori isolate
I10, HB1, and HJ9 at MOI 100 and incubated at 37 °C
for 6–8 h, subsequently further infected with EBV at an
infective dose of 100 μL. The AGS cells were infected
with EBV, EBV-I10, EBV-HB1, and EBV-HJ9, respectively. Uninfected AGS cells were used as control. The
cells were trypsinized and diluted with trypan blue (1:1).
The cells were counted through hemocytometer at 6, 12,
24, and 36 h, respectively, with white cells being viable
and blue depicting non-viable cells [26]. The morphological changes in the cells were evaluated by DAPI
staining. The confocal laser scanning microscopy
(CLSM) was performed using Multi-photon laser
(FV1200MPE, IX83 Model, Olympus). The ImageJ software was used for the cell length measurements. All the
statistical data was analyzed by GraphPad Prism
software.
Coinfection of EBV and H. pylori
AGS cells (25 × 104) were seeded in 6 well plates
followed by H. pylori infection through transwell inserts
of 0.45 μm at MOI of 100. After 6–8 h, transwell were
removed, and the cells were infected with EBV at an infective dose of 100 μl. This was followed by centrifugation at 2000 rpm for 20 min followed by re-insertion of
transwell insert. This setup was then incubated for various time intervals. For the direct infection approach, the
rest of the protocol remained the same without the use
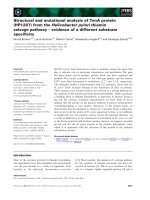
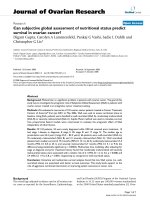
of a transwell. The graphical representation of the experiments performed in the project is shown in Fig. 1,
which depicts the procedure of direct and indirect coinfection in the cells, which were followed by other experiments like RT-qPCR. After 12, 24, and 36 h, cells were
scrapped through cell lifter and centrifuged at 3000 rpm
for 5 min to get the pellet. This pellet was washed with
phosphate buffer saline (PBS; pH 7.4; 10 mM) twice and
stored at − 20°c till further use.
Quantitative RT-PCR
The cells were infected with the bacteria followed by
virus incubation for 12 and 24 h, respectively. The Trizol
reagent was used for RNA extraction from co-infected
cells. The isolated RNA (0.5 μg) was used to synthesize
the cDNA with the help of the Takara cDNA synthesis
kit. The primers for kinase genes are listed in (Table 1),
subsequently primers for apoptotic genes and for H. pylori are mentioned in (Table 2). The thermocycler conditions used for the real-time PCR (RT-qPCR) were for 40
Sonkar et al. BMC Cancer
(2020) 20:925
Page 4 of 14
Fig. 1 Schematic representation of the experimental setup performed in the report. Two approaches used for an experiment wherein Direct
approach H. pylori was added to cells at MOI 100 without an insert. After 6–8 h, these cells were infected with EBV. Whereas in the Indirect
approach, H. pylori-infected the cultured cells through an insert. Again after 6–8 h insert was removed, cells were infected with EBV, and again,
the insert containing bacteria resumed in its original position
cycles and set at 94 °C for 15 s, 54 °C for 20 s, and 72 °C
for 20 s, respectively, using SYBR green. The expression
analysis was carried out using 2-ΔΔt method.
Statistical analysis
The analysis and quantification of the experimental
setup were done through Image J and Graph Pad Prism
software version 6, respectively. Biological triplicate was
required for each experiment. Quantitative data were
shown as mean ± SD. The difference comparison between groups was analyzed with independent t-test or
ANOVA. In all analyses, p < 0.05 was seen as a significant level.
Results
Isolation and characterization of H. pylori isolates
We have successfully extracted five isolates of H. pylori
from gastric biopsy and gastric juices, namely, HB1,
HB10, HJ1, HJ9, and HB14, which was followed by
Gram staining, where I10 was used as reference strain
(Fig. S1). Genomic DNA isolation was performed and
16sRNA primer was used for the screening of the bacteria along with reference strain (Fig. S2). Among the
five isolates, two isolates were selected for further experiments. The reference strain I10, along with two isolated
strains of the H. pylori isolates HB1 and HJ9, were used
for further experiments. The PCR was performed using
H. pylori strains’ genomic DNA as template to amplify
16 s rRNA genes, with a product size of 110 bp (Fig. S3).
H. pylori and EBV coinfection leads to morphological
changes
Previous studies have shown that morphological and
phenotypic changes can be detected in virus-infected
cells [38]. These cells acquire a characteristic elongated
cell shape with an invasive phenotype that contributes to
tumor invasion and metastasis [39]. Our data shows that
similar morphological changes such as elongated tapering ends were observed in AGS infected H. pylori at 24 h
[40]. Our results show that tapering ends of co-infected
cells were found to be more elongated as compared to
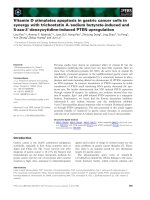
those seen in uninfected cells (Fig. 2a, S4). Interestingly,
the co-infected AGS showed morphological changes
even after 12 h of incubation, which may reflect the positive synergistic effect of EBV and H. pylori in cell
proliferation.
The elongations in tapering ends were quantified by
confocal laser scanning microscopy using DAPI stain at
various time intervals such as 12, 24, 36, and 48 h, respectively (Fig. S5). The analysis and quantification of
the experimental setup were done through Image J and
Graph Pad Prism software, respectively (Fig. 2b). Our results asseverate that the maximum length projection appears at 12 h post-infection (Fig. S6). The lengths of the
sharp end of co-infected cells were measured to estimate
the effect of EBV on AGS cells at 12 h incubation. Our
data shows that approximately 10 fold increase in the tapering end length was observed in comparison with the
control, which suggests that EBV has a positive effect on
cell growth and migration (Fig. 2b).
Sonkar et al. BMC Cancer
(2020) 20:925
Page 5 of 14
Table 1 list of primers used with their primer sequences
S.No.
Gene name
Forward primer
Reverse primer
1.
EPHB6
ATGAAGTGCCCTCTGCTGTC
CTGCCTGGTCATAGTAGCGG
2.
MAPK1
AACAGGCCCATCTTTCCAGG
CCAGAGCTTTGGAGTCAGCA
3.
SRC
ACATCCCCAGCAACTACGTG
CAGTAGGCACCTTTCGTGGT
4.
AKT3
ACCGCACACGTTTCTATGGT
TTCATGGTGGCTGCATCTGT
5.
JAK2
TGGGGTTTTCTGGTGCCTTT
TAGAGGGTCATACCGGCACA
6.
PAK1
ACAGGAGGTGGCCATTAAGC
CACAGCTGCAATTTGGCCTT
7.
PAK2
ATTGGACAAGGGGCTTCTGG
CCACATCAGTGAGTGACCCC
8.
ERBB2
CGCTGAACAATACCACCCCT
GCCAGCTGGTTGTTCTTGTG
9.
FGFR2
CCAACTGCACCAACGAACTG
ACTGTTCGAGAGGTTGGCTG
10.
METMET
GTCCTGCAGTCAATGCCTCT
GTCAGCCTTGTCCCTCCTTC
11.
PDK1
AAGTTCATGTCACGCTGGGT
GCATCTGTCCCGTAACCCTC
12.
ROR2
ACGTACGCATGGAACTGTGT
CGGCACATGCAAACCAAGAA
13.
ERBB4
ACAGGGGGCAAACAGTTTCA
AGCCCACCAATTACTCCAGC
14.
FYN
CTCAGCACTACCCCAGCTTC
AGGTCCCCGTATGAGACGAA
15.
ITK
ATTATCTACGCACCCAGCGG
ATGCCCTCACACACATCCAG
16.
TYK2
CCCATGGCTTGGAAGATGGT
ACTCAGCTTGATGAAGGGGC
17.
YES 1
GCTCCTGAAGCTGCACTGTA
GCATCCTGTATCCTCGCTCC
18.
EPHA4
AAGGCTATCGGTTACCCCCT
CTTCAAGCTGTTGGGGTTGC
19.
MERTK
GCCCCATCAGTAGCACCTTT
TGCACGTAGCATTGTGGACT
20.
TYRO3
CAAACTGCCTGTCAAGTGGC
CCCGCCAATGAGGTAGTTGT
21.
BRAF
AGAGGCGTCCTTAGCAGAGA
ATCGGTCTCGTTGCCCAAAT
22.
MTOR
TCGCTGAAGTCACACAGACC
CTTTGGCATATGCTCGGCAC
23.
RAF1
AATCAGCCTCACCTTCAGCC
AAAGAGCCTGACCCAATCCG
24.
FGFR4
GAGTCTCGTGATGGAGAGCG
AGTTATAGCGGATGCTGCCC
Effect of coinfection on cell proliferation
Previous studies have suggested that EBV and H. pylori both may promote cell proliferation through inducing morphological changes [41, 42]. At 12 h the cell
proliferation assay shows a decrease in cell number
when cells were infected with EBV alone. However,
an increase in cell proliferation is observed when EBV
infection is followed by a bacterial infection (Fig. 3).
Hence, our finding suggests that bacteria may provide
positive thrust for cell proliferation. In comparison
with control, the cells co-infected with HJ9 showed
an approximately 2 fold increase in cell proliferation
at 12 h. However, in HB1 co-infected cells, no significant change in proliferation was observed till 24 h.
The positive effect of bacterial co-infection on the
growth of cells is strain dependent, and it can affect
the proliferation in a time-dependent manner. Interestingly, the cell number increases significantly when
AGS cells infected with EBV alone or co-infected with
H. pylori and EBV, when compared to un-infected
AGS cells.
Assessment of kinase expression through a secretory and
adhesive mechanism of bacteria
To evaluate differential expressions of several kinases,
both direct and indirect infection methods were used
[27]. In the indirect approach, the effect of proteins
secreted from bacteria was assessed; and in the direct
approach the kinases that are mostly affected by adherence were evaluated. Here, we tried to investigate
the kinases of secretory and adherence pathways of
H. pylori to get an insight into the underlying strategy
which involves the cooperation of H. pylori in EBVdriven proliferation of gastric epithelial cells. Hence,
already developed H. pylori and EBV coinfection
model was used for AGS human gastric epithelial
cells. This model would give us access to investigate
the effect of molecules secreted by H. pylori. Hence
we used the 0.45 μm insert, which has been used for
a similar purpose in the previous reports [27, 43]. As
the effect of adherence of H. pylori to gastric mucosa
through CagA is linked to the severity of gastritis, it
was intriguing to compare the effect of secretory
Sonkar et al. BMC Cancer
(2020) 20:925
Page 6 of 14
Table 2 List of primers for apoptotic genes
S.No.
Gene name
Forward Primer
1.
PARP1
GGCGATCTTGGACCGAGTAG
AGCTTCCCGAGAGTCAGGAT
2.
APAF1
CTTGCTGCCCTTCTCCATGA
TTGCGAAGCATCAGAATGCG
3.
FASR
CCTGCCAAGAAGGGAAGGAG
TTTGGTGCAAGGGTCACAGT
4.
BID
CTGCAGGCCTACCCTAGAGA
GTGTGACTGGCCACCTTCTT
5.
BIK
ACCTGGACCCTATGGAGGAC
CTGAGGCTCACGTCCATCTC
6.
BIM
CTTCCATGAGGCAGGATGAA
TCCAATACGCCGCAACYCYY
7.
BAX
CATGGGCTGGACATTGGACT
AAAGATGGTCACGGTCTGCC
8.
NOXA
CAAGAACGCTCAACCGAGCC
GCCGGAAGTTCAGTTTGTCTC
9.
FAS
GGACCCTCCTACCTCTGGTT
GCCACCCCAAGTTAGATCTGG
10.
FADD
CACCAAGATCGACAGCATCG
AGATTCTCAGTGACTCCCGC
11.
BAK
GGTTTTCCGCAGCTACGTTT
TAGCGTCGGTTGATGTCGTC
12.
CASPAS9
TGCTCAGACCAGAGATTCGC
TCTTTCTGCTCGACATCACCAA
13.
16s RNA (H.pylori)
CTGGAGAGACTAAGCCCTCC
ATTACTGACGCTGATTGCGC
proteins and adherence of bacteria in gastric cells infected with EBV [44–46].
All 24 kinases were screened based on their presence
in GC either infected with H. pylori or EBV alone. Their
gene expressions were evaluated at a time interval of 12,
24, and 36 h, respectively. Out of 24 genes, eight genes
showed considerable changes in gene expression, which
are BRAF1, ITK, TYK2, FYN, PAK1, PAK2, PDK1, and
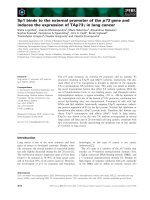
EPHB6. Among the eight genes, four genes showed significant changes in expression, which were ITK, FYN,
TYK2, and EPHB6. Reports suggest a high expression of
ITK, FYN, and TYK2 in GC, whereas EPHB6 showed reduced expression in GC [47, 48]. According to our experimental data, TYK2 and EPHB6 transcripts were
enhanced by the indirect coinfection approach, whereas
the other two genes, like FYN and ITK, were observed
to be up-regulated in the direct coinfection approach
(Fig. 4).
In the direct approach at 12 h incubation, ITK was
found to be significantly down-regulated in AGS cells
co-infected with EBV-I10, EBV-HB1, and EBV-HJ9 compared to controls at 12 h time point. Interestingly, ITK
was slightly down-regulated in AGS-EBV compared to
control AGS cells. However, there is a slight downregulation of the ITK gene in AGS-EBV infected cells in
comparison with AGS (Fig. 4A.1). Additionally, the FYN
gene transcript showed non-significant changes in AGSEBV and EBV-I10. However, FYN levels were considerably up-regulated in EBV-HB1 and EBV-HJ9 (Fig. 4A.2).
Noticeably, FYN expression was 2.5-fold higher. Hence,
in comparison to AGS within EBV-I10, EBV-HB1 and
EBV-HJ9 showed about 2.5-fold increases in expression
in FYN when compared to controls. Further, the TYK2
gene transcript showed down-regulation in AGS-EBV
and EBV-HB1 while showed enhanced up-regulation in
Reverse Primer
EBV-I10 and EBV-HJ9 (Fig. 4A.3). The EPHB6 gene
transcript showed more than 6-fold was up-regulated by
AGS-EBV and EBV-HB1, while, coinfection group such
as EBV-I10 and EBV-HJ9 showed more than 2.5-fold
and 10-fold enhanced expression, respectively (Fig.
4A.4). Therefore, based on the gene expression profiling,
it is clear that TYK2 and EPHB6 may have a pivotal role
in early prognosis and pathway determination.
Furthermore, at 24 h time point, ITK expression does
not vary significantly in AGS-EBV and EBV-HB1, while
considerable down-regulation was observed showing a
mild and significant decrease in expression in EBV-I10
and EBV-HJ9, respectively (Fig. S7.1). However, FYN expression showed a 2.5 to a 60,000-fold increase in expression of AGS-EBV and EBV-HJ9, respectively.
Additionally, EBV-HB1 showed a slight increase in expression, whereas EBV-I10 showed no remarkable
changes in gene expression in comparison to AGS (Fig.
S7.2). The TYK2 expression was significantly reduced in
both EBV-I10 and EBV-HJ9 while showing no noticeable
changes in AGS-EBV and EBV-HB1 (Fig. S7.3). The
EPHB6 expression level was found to be detected mildly
and significantly less in EBV-HB1 and EBV-HJ9, respectively, while no changes were observed in the expression
of EPHB6 in AGS-EBV and EBV-I10 respectively (Fig.
S7.4). Importantly, there were no significant changes observed at 36 h in these cells (Fig. S8).
In the indirect approach at 12 h, ITK and FYN expression were significantly increased from about 6–10
fold and 10–50 folds in EBV-I10 and EBV-HJ9, respectively (Fig. 4B.1, B.2). In comparison, these genes
showed no significant changes in AGS-EBV and EBVI10. However, the TYK2 gene showed a significant
decrease in the expression of EBV-HJ9 and EBV-HB1,
while no considerable changes were observed in AGS-
Sonkar et al. BMC Cancer
(2020) 20:925
Page 7 of 14
Fig. 2 H. pylori and EBV coinfection lead to morphological changes. a AGS cells were infected with EBV, and then AGS cells were infected with
EBV and H. pylori I10, HB1, HJ9, respectively. Changes in the number of cells and morphological changes were observed at 2 h, 12 h, and 24 h
where insert image shows the enlarged image of morphological changes. b Quantification of extended length was done for all experiments
through Graph Pad Prism software. The single-cell DAPI stained picture of the cell determines the way the cell length is measured through the
software. The arrow depicts the measurement of the cell length
Sonkar et al. BMC Cancer
(2020) 20:925
Page 8 of 14
Investigation of apoptotic markers in co-infected gastric
epithelial cell lines
It is well reported that apoptotic genes are altered with
H. pylori and EBV infection in gastric epithelial cell lines
individually; however, studies on effect of coinfection on
apoptotic genes have been modest [49]. Therefore, to
identify the apoptotic genes crucial during coinfection,
twelve apoptotic genes were studied that were specific
for GC, whose primers have been listed in (Table 2)
[50]. Their expression levels were evaluated at a time
interval of 12 and 24 h of incubation. However, to determine the early apoptotic marker, 12 h was chosen as a
time point to proceed with the further investigation of
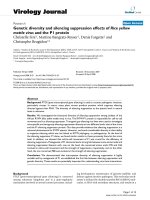
gene expression. The apoptotic genes such as APAF,
BIK, FASL, and BAX were found to be significantly
down-regulated at 24 h, which implies their potential
role in cell proliferation (Fig. 5).
Fig. 3 Effect of coinfection in cell proliferation. Cell proliferation of
AGS when treated with EBV and AGS-EBV with different strains of
bacteria I10, HB1, and HJ9, respectively, at different time points of 6,
12, and 24 h
EBV and EBV-I10 (Fig. 4B.3). The EPHB6 gene transcript showed a more than 10fold increase in AGSEBV and EBV-HJ9, and more than 6 fold increases in
EBV-I10 and EBV-HB1 (Fig. 4B.4). ITK gene expression at 24 h showed more than 10,000 to 50,000 fold
increase in EBV-HB1 and AGS-EBV, respectively,
whereas 20 fold increase is observed in EBV-HJ9 (Fig.
S9.1). In the FYN gene, no significant changes were
observed in AGS-EBV, while more than 2.5, 10, and
20 fold increase in expression were observed in EBVHJ9, EBV-I10, and EBV–HJ9, respectively (Fig. S9.2).
The TYK2 gene expression decreased mildly, in AGSEBV, and no changes were found in EBV-I10, while a
significant increase is observed in EBV-HB1 and EBVHJ9 (Fig. S9.3). EPHB6 gene showed approx. 20 fold
increase in the expression in of AGS-EBV and
approx. 2.5 fold increase in EBV- HJ9, EBV-I10, and
EBV-HB1, respectively (Fig. S9.4). In 36 h, the ITK
gene showed more than 6, 10, 250 fold increase in
AGS-EBV, EBV-I10, EBV-HB1, respectively, and a significant decrease in EBV-HJ9 (Fig. S10.1). The FYN
gene transcript showed 17,000, 20, 250, 4 fold increased expression in AGS-EBV, EBV-I10, EBV-HB1,
and EBV-HJ9, respectively (Fig. S10.2). The TYK2
gene showed no significant changes in any sample
(Fig. S10.3). EPHB6 gene showed an increase in expression of the transcript, with 6, 17, 28, and 30 fold
in AGS-EBV, EBV-10, EBV-HB1, and EBV-HJ9, respectively (Fig. S10.4). Hence, our findings suggest
that two or more mechanisms may be involved in
these experiments.
Discussion
H. pylori usually infect during childhood, where its site
of residence is the stomach for decades, causing GC,
peptic ulcer, and gastritis. This bacteria is known to infect half of the world population [51].
This study includes H. pylori isolates from central
India for the detection of the early development of GC.
Consistent with previous reports, morphological changes
were observed due to bacterial infection, which supports
aggressive cell proliferation [52]. CagA + H. pylori infection in AGS cells causes a hummingbird phenotype by
dephosphorylation of vinculin. Hence, vinculin may be
one of the reasons for the morphological changes [53].
But as the coinfection resulted in a different morphology, there might be other gene involvement as well.
This study demonstrates morphological changes in AGS
cells infected with bacteria followed by EBV coinfection. In the co-infected cells, the invasive form was
observed at 12 h compared to a previous study in which
they were observed at 24 h [54]. These morphological
changes may be associated with the possible role of EBV
and H. pylori co-infection in early cell transformation in
the gastric epithelial cell line.
Further, we were able to quantify the tapering ends by
infecting the cells with bacteria at different time intervals. After 12 h incubation of co-infected cells, a remarkable elongation of tapering ends of cells was observed.
In this study, 12 h seems to be a potential time interval
to evaluate the effect of EBV on the cells infected with
bacteria. These co-cultured AGS cells with H. pylori
strains and EBV showed an increased number of
hummingbird-like cells. This phenotype is considered to
promote scattering and spreading of cells, which may be
important in carcinogenesis [50, 55]. But to the best of
our knowledge, no such study for length quantification
has been done previously for this purpose.
Sonkar et al. BMC Cancer
(2020) 20:925
Page 9 of 14
Fig. 4 Assessment of kinase expression through the secretory and adhesive mechanism of bacteria. Gene’s expression was shown with a direct
and indirect approach at different time points. a, b at 12 h. Where “+” indicated experiment performed with insert, i.e., indirect approach and “-”
indicates experiment performed without an insert, i.e., direct approach
Sonkar et al. BMC Cancer
(2020) 20:925
Page 10 of 14
Fig. 5 Investigation of apoptotic markers in co-infected gastric epithelial cell lines: Gene expression expressions of apoptotic genes were assessed
at 12 and 24 h apoptosis after coinfection of AGS with bacteria and virus. The results are shown as the mean SD of three independent
experiments where *p < 0.05, **p < 0.001, ****p < 0.0001 analyzed through two-way ANOVA
As per our knowledge, this is the first report to demonstrate the differential expression of kinase in coinfected cells using two different approaches, i.e., with
transwell inserts (indirect approach) and without transwell (direct approach). With indirect and direct approaches, we aimed to identify the most affected kinase
at various time intervals of 12, 24, and 36 h, respectively.
The TYK2 and EPHB6 gene were found to be upregulated by adherence of bacteria to the cells in the
presence of EBV, whereas secretory proteins of bacteria
up-regulate ITK and FYN expression in the presence of
EBV. Though, the expression of genes varies with infection of AGS with EBV, EBV-I10, EBV-HB1, and EBVHJ9, respectively. Moreover, in the direct approach, the
ITK gene showed similar down-regulation in the coinfection of AGS with EBV- I10, EBV-HB1, and EBV-HJ9.
In contrast, the TYK2 gene showed significant upregulation in comparison to I10 and HJ9 co-infected cells than
in infection with EBV or EBV-HB1 only. In 12 h, EPHB6
gene transcript also showed a significant increase in the
expression in all co-infected cells. However, the EPHB6
gene showed the highest expression in EBV-HJ9 co-
Sonkar et al. BMC Cancer
(2020) 20:925
infected cells. Similar results were observed with the
FYN gene at 24 h. Hence, our findings suggest that
TYK2, EPHB6, and FYN can be used for an early prognosis for GC. With the Indirect approach, the ITK gene
showed a remarkably significant increase in all infection.
In contrast, cells infected with EBV alone showed the
highest expression, in comparison to EBV-I10, EBVHB1, and EBV-HJ9 whose expression were significantly
increased. An earlier study conducted on breast cancer
cells (MCF-7) found that FYN gene expression was
higher at 24 h [56]. Moreover, the expression of TYK2
and ITK was increased in gastric tissue samples [57].
EphB6, an Eph receptor that doesn’t have tyrosine kinase
activity, was reported to be expressed in some human
cancers. Ephb6 with APC mutation is found to be overexpressed in colorectal cancer [16]. Also, reports have
suggested that these kinases may have a role in gastric
cancer progression [58].
A similar trend was observed in the FYN gene with
the exception of expression in EBV-HJ9, which was reduced in comparison with EBV-I10. Contrarily, in
EPHB6, considerable up-regulation was observed in all
cases. Hence, when the secretory pathway of H. pylori is
concerned, ITK, FYN, and EPHB6 can be investigated
thoroughly for further studies.
Moreover, H. pylori consist of various genes that contribute to enhancing its infection, such as T4SS-pilus localized protein CagA, vacuolation causing secretory
protein VacA and outer membrane protein BabA.
CagA+ H. pylori strain increases the risk of distal GC as
it uses the integrin receptor present on the host’s cells
for its entry in the cells [59]. CagA bridges the T4SS to
integrin α5 β1 on host cells, which activates the SRC
and focal adhesion kinase, which ensures that CagA is
phosphorylated at the site of infection [40]. VacA is a
secretory protein that causes vacuolation in cultured epithelial cells. VacA binds to integrin β2 and blocks
interleukin-2 mediated signaling, which causes downregulation of the Ca2 + −dependent phosphatase calcineurin
and inhibits antigen-dependent proliferation of transformed T cells [60]. Eventually, H. pylori interfere with
tyrosine kinase, Crk, GTPase, and MAP kinase signaling
leading to peptic ulcer, gastritis, and GC [61]. Although
the site of the residence of H. pylori remains to be within
the semi-permeable mucous gel layer of stomach facing
towards the apical surface of gastric epithelial cells,
about 20% of the bacteria is known to bind with the epithelium [62]. When genome analysis of H. pylori strains
was done, a very high proportion of protein-encoding
for the open reading frame was identified in the outer
and inner membrane of bacterium which is known as
outer membrane proteins (omPs) such as BabA which
has a role in increased mucosal inflammation, atrophy
and severe gastric injury [63, 64].
Page 11 of 14
Fig. 6 Graphical abstract of the experimental outcome in the report.
H. pylori secretory molecule activates two kinases FYN and ITK, which
may activate the effector molecule leading to the nucleus for cell
proliferation, morphological changes, and cytoskeleton
rearrangement. H. pylori adherence activates TYK2 kinase and inhibits
apoptotic genes like FASL, FASR, and APAF-1, which contribute to
cell proliferation
Importantly, apoptosis is a regulatory action taken by
the cell for cell replacement and damaged cell removal,
which can be characterized by chromatin condensation,
cell shrinkage, and formation of apoptotic bodies [65].
This process is the result of the extrinsic pathway (extracellular stress) and the intrinsic pathway (intracellular
stress) [66]. The death receptor is located at the cell surface, such as Fas/Fas ligand, and is induced by extracellular stress. In comparison, the intrinsic pathway is induced
mainly through intracellular stress, which is associated
with mitochondria, for example, APAF-1 and Bcl2 family
[67]. To explore the expression of apoptotic genes through
the direct approach, we selected nine apoptotic genes that
have been associated with GC. Our experiment found that
apoptotic genes, namely APAF-1, BIK, FASL, and BAX,
were significantly down-regulated at 24 h (Fig. 6). Earlier
reports suggested that apoptotic genes like APAF-1, Bcl-2,
BAX, and Bcl-2 family were found to be up-regulated in
gastric cancer tissues [50, 67]. Experiments performed
with H. pylori in epithelial cell background also demonstrated the expressional differences for APAF-1, Fas-Fas
ligand, and Bcl-2 related genes (Bcl-2, BAX, and BAK)
genes at 48 h [68]. Furthermore, based on the experiments
performed in the report, a comprehensive representation
of the outcome of experiments is diagrammatically illustrated in Fig. 6, where the effect of direct and indirect
coinfection in kinase and apoptosis-related signaling pathway is diagrammatically represented.
Conclusion
Our study uses clinical H. pylori isolates along with reference strain to find its phenomenal changes in gastric
epithelial cells along with EBV. The remarkable effect of
coinfection on morphological changes found to be in 12
h intervals on implementing quantification of tapering
Sonkar et al. BMC Cancer
(2020) 20:925
ends. This study also demonstrated the kinase and apoptotic genes that might be affected in co-infected cells
through direct and indirect approaches. Where ITK,
EPHB6, TYK2, and FYN kinase are highly expressed
kinase genes and APAF, BIK, FASL, and BAX are the
significantly down-regulated apoptotic genes. ITK and
TYK2 are receptor tyrosine kinase, which is specifically
involved in cellular differentiation, survival, and proliferation and contains the conserved domain of Ig-domains.
In stark contrast, non-receptor tyrosine kinase-like FYN,
essential for enzyme regulation and substrate identification, was found to be up-regulated by direct dual infection. Hence, their downstream interlinked pathway can
provide a potential strategy to understand the progression of GC. However, we do consider the fact that
the number of strains used that were isolated from
the patients is limited, and further investigation is required for drawing a more consequential conclusion.
Supplementary information
Supplementary information accompanies this paper at />1186/s12885-020-07377-0.
Page 12 of 14
DST-EMR: EMR/2017/001637. The authors declare that they have no conflict
of interest. The funding bodies had no role in study design, collection, analysis, interpretation of data, writing the manuscript, or decision to publish.
Availability of data and materials
All-important data are presented in the manuscript or supplementary figures.
Some other supporting information that may not be crucial or affecting
result interpretation is not included. Moreover, these data can be available
from the corresponding author on a reasonable request.
Ethics approval and consent to participate
The protocol for the present study was approved by the ethics committee of
the Indian Institute of Technology Indore, as well as Choithram Hospital and
Research Centre, Indore (approval number FD090), and all procedures were
performed by following the revised declaration of Helsinki 2000.
Consent for publication
Not applicable.
Competing interests
The authors declare that they have no competing interests.
Author details
The Discipline of Biosciences and Biomedical Engineering, Indian Institute of
Technology Indore, Room no. 302, School Building, IIT Indore, Khandwa
Road, Simrol, Indore 453552, India. 2Choithram Hospital and Research Centre
Indore, Indore, Madhya Pradesh, India.
1
Received: 6 May 2020 Accepted: 3 September 2020
Additional file 1.
Abbreviations
GC: Gastric cancer; H. pylori: Helicobacter pylori; EBV: Epstein barr virus;
BRAF1: B-Raf proto-oncogene, serine/threonine kinase; ITK: Interleukin-2inducible T-cell kinase; TYK2: Tyrosine kinase 2; FYN: Tyrosine-protein kinase
Fyn; PAK1: P21 protein (Cdc42/Rac)-activated kinase 1; PAK2: P21 protein
(Cdc42/Rac)-activated kinase 2; PDK1: Pyruvate dehydrogenase kinase1;
EPHA4: Ephrin type-A receptor 4 precursor; EPHB6: Ephrin type-B receptor 6
precursor; AKT3: AKT Serine/Threonine Kinase 3; SRC: Proto-oncogene
tyrosine-protein kinase Sarcoma; YES: Cellular homolog of the Yamaguchi
sarcoma virus oncogene; mTOR: The mechanistic target of rapamycin;
JAK2: Janus kinase 2; MET: Hepatocyte growth factor receptor;
FGFR2: Fibroblast Growth Factor Receptor 4; Raf: Raf-1 proto-oncogene,
serine/threonine kinase; FGFR4: Fibroblast Growth Factor Receptor 4;
ROR2: Receptor Tyrosine Kinase Like Orphan Receptor 2; ERBB4: Erb-B2
Receptor Tyrosine Kinase 4; ERBB2: Erb-B2 Receptor Tyrosine Kinase 2
Acknowledgments
We appreciate Dr. Asish Kumar Mukhopadhyay (National Institute of Cholera
and Enteric Diseases, Kolkata) for providing the Helicobacter pylori strain I10.
Ms. Charu Sonkar would like to express her sincere gratitude to CSIR, India,
for her doctoral fellowship (09/1022(0035)/2017-EMR-I. We also appreciate
the Sophisticated Instrumentation Centre, IIT Indore for Confocal microscopy,
and LC-MS facility. We also appreciate Dr. Erle S Robertson (University of
Pennsylvania, USA) for providing us with HEK 293 T EBV BAC cell, which consistently expressed Epstein Barr Virus (EBV) genome. We would like to thank
Dr. Rajeev Kaul for proof read of the manuscript.
Authors’ contributions
HCJ coordinated the project and designed experiments. CS carried out
experiments, and TV performed Gram’s staining experiments for the H. pylori
strains. HCJ and CS analyzed data and wrote the manuscript. Samples of
human gastric biopsy and gastric juice were provided by DC and AJ. All
authors revised, approved and proof read the manuscript.
Funding
This project was supported by the Council of Scientific and Industrial
Research grant no, (09/1022(0035)/2017-EMR-I) for financially supporting this
project. This project is financially supported by the Department of Science
and Technology as Ramanujan fellowship grant no. SB/S2/RJN-132/20/5 &
References
1. Van Cutsem E, Sagaert X, Topal B, Haustermans K, Prenen H. Gastric cancer.
Lancet. 2016;388:2654–64.
2.
Wang F, Meng W, Wang B, Qiao L. Helicobacter pylori-induced gastric
inflammation and gastric cancer. Cancer Letters. 2014;345:196–202.
3. Prabhu SR, Amrapurkar AD, Amrapurkar DN. Role of Helicobacter pylori in
gastric carcinoma. Natl Med J India. 1995;8:3.
4. Cover TL. Helicobacter pylori diversity and gastric Cancer risk. Gastric
Cancer. 2016;7:1–9.
5. Dong Z, Cui H. Epigenetic modulation of metabolism in glioblastoma.
Semin Cancer Biol. 2019;57:45–51.
6. Biology C, Sokolova O, Vieth M, Gnad T, Bozko PM, Naumann M. The
international journal of biochemistry helicobacter pylori promotes
eukaryotic protein translation by activating phosphatidylinositol 3 kinase /
mTOR. Int J Biochem Cell Biol. 2014;55:157–63.
7. Xie YG, Yu Y, Hou LK, Wang X, Zhang B, Cao XC. FYN promotes breast
cancer progression through epithelial-mesenchymal transition. Oncol Rep.
2016;36:1000–6.
8. Chen Y-C, Wang Y, Li J-Y, Xu W-R, Zhang Y-L. H pylori stimulates
proliferation of gastric cancer cells through activating mitogen-activated
protein kinase cascade. World J Gastroenterol. 2006;12:5972–7.
9. Hatakeyama M. Helicobacter pylori and gastric carcinogenesis. J
Gastroenterol. 2009;44:239–48.
10. Hunter T. Discovering the first tyrosine kinase. Proc Natl Acad Sci U S A.
2015;112:7877–82.
11. McDuffie NG. Protein kinase Collett MS, Erikson RL. Protein kinase activity
associated with the avian sarcoma virus src gene product. Proc Natl Acad
Sci USA. 1978;75:2021–4.
12. Jacobs C, Rübsamen H. Expression of pp60c-src Protein Kinase in Adult and
Fetal Human Tissue: High Activities in Some Sarcomas and Mammary
Carcinomas. Cancer Res. 1983;43:1696.
13. Esau D. Viral Causes of Lymphoma: The History of Epstein-Barr Virus and
Human T-Lymphotropic Virus 1. Virology: Research and Treatment. 2017;8:
1178122X1773177.
14. Morales-Sanchez A, Fuentes-Panana EM. Epstein-Barr virus-associated gastric
Cancer and potential mechanisms of Oncogenesis. Curr Cancer Drug
Targets. 2016;17:534–54.
15. Matsusaka K, Kaneda A, Nagae G, Ushiku T, Kikuchi Y, Hino R, et al.
Classification of Epstein-Barr virus-positive gastric cancers by definition of
DNA methylation epigenotypes. Cancer Res. 2011;71:7187–97.
Sonkar et al. BMC Cancer
(2020) 20:925
16. Liu J, Xu B, Xu G, Zhang X, Yang X, Wang J. Reduced EphB6 protein in
gastric carcinoma and associated lymph nodes suggests EphB6 as a gastric
tumor and metastasis inhibitor. Cancer biomarkers : section A of Disease
markers. 2017;19:241–248.
17. Khetpal N, Ali S, Kumar R, Rashid MU, Ahmad S. The Clinical and Biological
Significance of Tyrosine Kinases in Gastric Cancer. In: Nagaraju GP, editor.
Role of Tyrosine Kinases in Gastrointestinal Malignancies. Singapore:
Springer; 2018;29–56.
18. Miyazaki K, Inokuchi M, Takagi Y, Kato K, Kojima K, Sugihara K. EphA4 is a
prognostic factor in gastric cancer. BMC Clin Pathol. 2013;13:19.
19. Gao C, Ma T, Pang L, Xie R. Activation of P21-activated protein kinase 2 is an
independent prognostic predictor for patients with gastric cancer. Diagn
Pathol. 2014;9:1–6.
20. Raimondi C, Falasca M. Targeting PDK1 in Cancer. CMC. 2011;18:2763–9.
21. Xu J, Gong L, Qian Z, Song G, Liu J. ERBB4 promotes the proliferation of gastric
cancer cells via the PI3K/Akt signaling pathway. Oncol Rep. 2018;39:2892–8.
22. Lin W, Kao H-W, Robinson D, Kung H-J, Wu C-W, Chen H-C. Tyrosine kinases
and gastric cancer. Oncogene. 2000;19:5680–9.
23. Ye Y, Jiang D, Li J, Wang M, Han C, Zhang X, et al. Silencing of FGFR4 could
influence the biological features of gastric cancer cells and its therapeutic
value in gastric cancer. Tumor Biol. 2016;37:3185–95.
24. Yan L, Du Q, Yao J, Liu R. ROR2 inhibits the proliferation of gastric carcinoma cells
via activation of non-canonical Wnt signaling. Exp Ther Med. 2016;12:4128–34.
25. Sousa H, Pinto-Correia AL, Medeiros R, Dinis-Ribeiro M. Epstein-Barr virus is
associated with gastric carcinoma: the question is what is the significance?
World J Gastroenterol. 2008;14:4347–51.
26. Cárdenas-Mondragón MG, Carreón-Talavera R, Camorlinga-Ponce M,
Gomez-Delgado A, Torres J, Fuentes-Pananá EM. Epstein Barr Virus and
Helicobacter pylori Co-Infection Are Positively Associated with Severe
Gastritis in Pediatric Patients. PLoS ONE. 2013;8:e62850.
27. Pandey S, Jha HC, Shukla SK, Shirley MK, Robertson ES. Epigenetic
Regulation of Tumor Suppressors by Helicobacter pylori Enhances EBVInduced Proliferation of Gastric Epithelial Cells. mBio. 2018;9:e00649–18.
28. Shukla SK, Jha HC, El-Naccache DW, Robertson ES. An EBV recombinant
deleted for residues 130-159 in EBNA3C can deregulate p53/Mdm2 and
Cyclin D1/CDK6 which results in apoptosis and reduced cell proliferation.
Oncotarget. 2016;7:18116–34.
29. Halder S, Murakami M, Verma SC, Kumar P, Yi F, Robertson ES. Early events
associated with infection of Epstein-Barr virus infection of primary B-cells.
PLoS One. 2009;4:e7214.
30. Boudreault S, Armero VES, Scott MS, Perreault J-P, Bisaillon M. The EpsteinBarr virus EBNA1 protein modulates the alternative splicing of cellular
genes. Virol J. 2019;16:29.
31. Coleman CB, Wohlford EM, Smith NA, King CA, Ritchie JA, Baresel PC, et al.
Epstein-Barr virus type 2 latently infects T cells, inducing an atypical
activation characterized by expression of Lymphotactic cytokines. J Virol.
2015;89:2301–12.
32. Shannon-Lowe C, Adland E, Bell AI, Delecluse H-J, Rickinson AB, Rowe M.
Features distinguishing Epstein-Barr virus infections of epithelial cells and B
cells: viral genome expression, genome maintenance, and genome
amplification. J Virol. 2009;83:7749–60.
33. Lay M-LJ, Lucas RM, Ratnamohan M, Taylor J, Ponsonby A-L, Dwyer DE, et al.
Measurement of Epstein-Barr virus DNA load using a novel quantification standard
containing two EBV DNA targets and SYBR green I dye. Virol J. 2010;7:252.
34. Heawchaiyaphum C, Iizasa H, Ekalaksananan T, Burassakarn A, Kiyono T,
Kanehiro Y, et al. Epstein-Barr virus infection of Oral squamous cells.
Microorganisms. 2020;8:419.
35. Kashyap D, Baral B, Verma TP, Sonkar C, Chatterji D, Jain AK, et al. Oral rinses
in growth inhibition and treatment of helicobacter pylori infection. BMC
Microbiol. 2020;20:45.
36. Kim G, Kim T-H, Kang M-J, Choi J-A, Pack D-Y, Lee I-R, et al. Inhibitory effect
of withaferin a on helicobacter pylori-induced IL-8 production and NF-κB
activation in gastric epithelial cells. Mol Med Rep. 2016;13:967–72.
37. Gryko M, Pryczynicz A, Zareba K, Kędra B, Kemona A, Guzińska-Ustymowicz
K. The Expression of Bcl-2 and BID in Gastric Cancer Cells. Journal of
Immunology Research. 2014;2014:1–5.
38. Foglieni C, Scabini S, Belloni D, Broccolo F, Lusso P, Malnati MS, et al.
Productive infection of HUVEC by HHV-8 is associated with changes
compatible with angiogenic transformations. Eur J Histochem. 2005;49:273–84.
Page 13 of 14
39. Safari F, Jodeiry Zaer S. Evaluation of cell- morphological changes by
helicobacter pylori CagA and Pragmin in AGS human gastric carcinoma
cells. Gene Cell Tissue. 2017;4:0–3.
40. Selbach M, Moese S, Hurwitz R, Hauck CR, Meyer TF, Backert S. The
helicobacter pylori CagA protein induces cortactin dephosphorylation and
actin rearrangement by c-Src inactivation. EMBO J. 2003;22:515–28.
41. Roose J, Polevoy GA, Clevers H, Embo J. Letters To Nature. Nature. 1998;395:
521–5.
42. Selbach M, Moese S, Backert S, Jungblut PR, Meyer TF. The helicobacter
pylori CagA protein induces tyrosine dephosphorylation of ezrin.
Proteomics. 2004;4:2961–8.
43. Basque J-R, Chénard M, Chailler P, Ménard D. Gastric cancer cell lines as
models to study human digestive functions. J Cell Biochem. 2001;81:241–51.
44. Oleastro M, Ménard A. The role of helicobacter pylori outer membrane
proteins in adherence and pathogenesis. Biology. 2013;2:1110–34.
45. Bodger K, Crabtree JE. Helicobacter pylori and gastric inflammation. Br Med
Bull. 1998;54:139–50.
46. Kim N, Weeks DL, Shin JM, Scott DR, Young MK, Sachs G. Proteins released
by helicobacter pylori in vitro. J Bacteriol. 2002;184:6155–62.
47. Liersch-Löhn B, Slavova N, Buhr HJ, Bennani-Baiti IM. Differential protein
expression and oncogenic gene network link tyrosine kinase ephrin B4
receptor to aggressive gastric and gastroesophageal junction cancers:
EPHB4 associates to aggressive gastroesophageal cancers. Int J Cancer.
2016;138:1220–31.
48. Kwok T, Backert S, Schwarz H, Berger J, Meyer TF. Specific entry of
helicobacter pylori into cultured gastric epithelial cells via a zipper-like
mechanism. Infect Immun. 2002;70:2108–20.
49. Shinozaki-Ushiku A, Kunita A, Fukayama M. Update on epstein-barr virus
and gastric cancer (review). Int J Oncol. 2015;46:1421–34.
50. Guo J Qiang, Li S jie, Guo G xiao. Long noncoding RNA AFAP1-AS1
promotes cell proliferation and apoptosis of gastric Cancer cells via PTEN/pAKT pathway. Dig Dis Sci. 2017;62:2004–10.
51. Montecucco C, Rappuoli R. Living dangerously: how helicobacter pylori
survives in the human stomach. Nat Rev Mol Cell Biol. 2001;2:457–66.
52. Ciufo DM, Cannon JS, Poole LJ, Wu FY, Murray P, Ambinder RF, et al.
Spindle cell conversion by Kaposi’s sarcoma-associated Herpesvirus:
formation of colonies and plaques with mixed lytic and latent gene
expression in infected primary dermal microvascular endothelial cell
cultures. J Virol. 2001;75:5614–26.
53. Moese S, Selbach M, Brinkmann V, Karlas A, Haimovich B, Backert S, et al. The
helicobacter pylori CagA protein disrupts matrix adhesion of gastric epithelial
cells by dephosphorylation of vinculin. Cell Microbiol. 2007;9:1148–61.
54. Stein M, Bagnoli F, Halenbeck R, Rappuoli R, Fantl WJ, Covacci A. C-Src/Lyn
kinases activate helicobacter pylori CagA through tyrosine phosphorylation
of the EPIYA motifs. Mol Microbiol. 2002;43:971–80.
55. Argent RH, Kidd M, Owen RJ, Thomas RJ, Limb MC, Atherton JC.
Determinants and consequences of different levels of CagA
phosphorylation for clinical isolates of helicobacter pylori. Gastroenterology.
2004;127:514–23.
56. Lee GH, Yoo KC, An Y, Lee HJ, Lee M, Uddin N, et al. FYN promotes
mesenchymal phenotypes of basal type breast cancer cells through STAT5/
NOTCH2 signaling node. Oncogene. 2018;37:1857–68.
57. Wu C, Li AF, Chi C, Huang CL, Shen K, Liu W, et al. Human gastric Cancer
kinase profile and prognostic Significance of MKK4 kinase. Am J Pathol.
2007;156:2007–15.
58. Morishita A, Gong J, Masaki T. Targeting receptor tyrosine kinases in gastric
cancer. World J Gastroenterol. 2014;20:4536–45.
59. Peek RM, Blaser MJ. Helicobacter pylori and gastrointestinal tract
adenocarcinomas. Nat Rev Cancer. 2002;2:28–37.
60. Gebert B, Fischer W, Weiss E, Hoffmann R, Haas R. Helicobacter pylori
vacuolating cytotoxin inhibits T lymphocyte activation. Science. 2003;301:
1099–102.
61. Brandt S, Shafikhani S, Balachandran P, Jin S, Hartig R, König W, et al. Use of
a novel coinfection system reveals a role for Rac1, H-Ras, and CrkII
phosphorylation in helicobacter pylori-induced host cell actin cytoskeletal
rearrangements. FEMS Immunol Med Microbiol. 2007;50:190–205.
62. Tomb JF, White O, Kerlavage AR, Clayton RA, Sutton GG, Flelschmann RD,
et al. Erratum: the complete genome sequence of the gastric pathogen
helicobacter pylori. Nature. 1997;389:412.
Sonkar et al. BMC Cancer
(2020) 20:925
63. Alm RA, Ling LSL, Moir DT, King BL, Brown ED, Doig PC, et al. Genomicsequence comparison of two unrelated isolates of the human gastric
pathogen helicobacter pylori. Nature. 1999;397:176–80.
64. Yamaoka Y. Roles of helicobacter pylori BabA in gastroduodenal
pathogenesis. World J Gastroenterol. 2008;14:4265–72.
65. Chandra J, Samali A, Orrenius S. Triggering and modulation of apoptosis by
oxidative stress. Free Radic Biol Med. 2000;29:323–33.
66. Wang S-Q, Wang C, Chang L-M, Zhou K-R, Wang J-W, Ke Y, et al. Geridonin
and paclitaxel act synergistically to inhibit the proliferation of gastric cancer
cells through ROS-mediated regulation of the PTEN/PI3K/Akt pathway.
Oncotarget. 2016;7:72990–3002.
67. Kale J, Osterlund EJ, Andrews DW. BCL-2 family proteins: changing partners
in the dance towards death. Cell Death Differ. 2018;25:65–80.
68. Choi IJ, Kim JS, Kim JM, Jung HC, Song IS. Effect of inhibition of extracellular
signal-regulated kinase 1 and 2 pathway on apoptosis and bcl-2 expression
in helicobacter pylori-infected AGS cells. Infect Immun. 2003;71:830–7.
Publisher’s Note
Springer Nature remains neutral with regard to jurisdictional claims in
published maps and institutional affiliations.
Page 14 of 14