AUCTSP: An improved biomarker gene pair class predictor
Bạn đang xem bản rút gọn của tài liệu. Xem và tải ngay bản đầy đủ của tài liệu tại đây (1.14 MB, 13 trang )
Kagaris et al. BMC Bioinformatics (2018) 19:244
/>
RESEARCH ARTICLE
Open Access
AUCTSP: an improved biomarker gene
pair class predictor
Dimitri Kagaris1*
, Alireza Khamesipour1 and Constantin T. Yiannoutsos2
Abstract
Background: The Top Scoring Pair (TSP) classifier, based on the concept of relative ranking reversals in the
expressions of pairs of genes, has been proposed as a simple, accurate, and easily interpretable decision rule for
classification and class prediction of gene expression profiles. The idea that differences in gene expression ranking are
associated with presence or absence of disease is compelling and has strong biological plausibility. Nevertheless, the
TSP formulation ignores significant available information which can improve classification accuracy and is vulnerable
to selecting genes which do not have differential expression in the two conditions (“pivot" genes).
Results: We introduce the AUCTSP classifier as an alternative rank-based estimator of the magnitude of the ranking
reversals involved in the original TSP. The proposed estimator is based on the Area Under the Receiver Operating
Characteristic (ROC) Curve (AUC) and as such, takes into account the separation of the entire distribution of gene
expression levels in gene pairs under the conditions considered, as opposed to comparing gene rankings within
individual subjects as in the original TSP formulation. Through extensive simulations and case studies involving
classification in ovarian, leukemia, colon, breast and prostate cancers and diffuse large b-cell lymphoma, we show the
superiority of the proposed approach in terms of improving classification accuracy, avoiding overfitting and being less
prone to selecting non-informative (pivot) genes.
Conclusions: The proposed AUCTSP is a simple yet reliable and robust rank-based classifier for gene expression
classification. While the AUCTSP works by the same principle as TSP, its ability to determine the top scoring gene pair
based on the relative rankings of two marker genes across all subjects as opposed to each individual subject results in
significant performance gains in classification accuracy. In addition, the proposed method tends to avoid selection of
non-informative (pivot) genes as members of the top-scoring pair.
Keywords: Microarray data analysis, Gene expression, Gene selection, Receiver operating characteristic (ROC) curve,
AUC, Leukemia, Breast cancer, Ovarian cancer, Colon cancer, Prostate cancer, Diffuse large B-Cell lymphoma
Background
Microarray data analysis is a high throughput method
used to gain information about gene functions inside cells.
This information is in turn used to detect the presence or
absence of disease [1–3], and gain a better understanding
of a disease mechanism [4].
A particularly useful application of microarray technology uses microarray data to detect the presence of
disease by combining gene expression levels from a number of genes, to provide information on whether disease
*Correspondence:
Department of Electrical and Computer Engineering, Southern Illinois
University, 1230 Lincoln Drive, 62901 Carbondale, IL, USA
Full list of author information is available at the end of the article
1
is present (classification) or the risk for the occurrence
of disease in the future (prediction). While very complex
classifiers can be constructed, a number of authors have
expressed concern with the “black box” nature of these
approaches [5] preferring simpler more interpretable classifiers in clinical applications [6, 7]. It is noted that the
preference for the latter kind of classifiers should not be at
the expense of their performance.
Classification involves, at its most fundamental level,
a comparison between expression levels in one or more
genes between two or more conditions (e.g., disease versus no disease). This comparison can be based on a fairly
heuristic criterion (e.g., fold-change in gene expression
[8]), or by using parametric or non-parametric statistical
© The Author(s). 2018 Open Access This article is distributed under the terms of the Creative Commons Attribution 4.0
International License ( which permits unrestricted use, distribution, and
reproduction in any medium, provided you give appropriate credit to the original author(s) and the source, provide a link to the
Creative Commons license, and indicate if changes were made. The Creative Commons Public Domain Dedication waiver
( applies to the data made available in this article, unless otherwise stated.
Kagaris et al. BMC Bioinformatics (2018) 19:244
methods [9–12]. There are several advantages and disadvantages with each of these methods. For example, it
is biologically plausible that genes with large differential
expression levels should be part of a classification criterion. However, the fold-change criterion does not take
gene expression variability into account and determining
a cutoff is an arbitrary exercise [13]. On the other hand,
parametric statistical methods, which are based on some
variant of the t-test, provide some sense of one’s confidence on the gene expression difference, but frequently
lose the intuitive appeal of heuristic methods like foldchange (e.g., when even small differences are statistically
significant). In addition, parametric methods make strong
and frequently untenable assumptions regarding the distribution of gene expression levels [13]. Non-parametric
methods, which are based on ranking gene expression
levels, are expected to lose some information because of
the use of ranks instead of actual gene-expression data.
However, such methods are robust to deviations from
parametric assumptions [13], and are less vulnerable to
biases arising from data normalization and other preprocessing steps [14], which are plausibly assumed to be
rank-preserving [6, 7].
The fact that the TSP provides classifiers based on only
two genes is also an attractive compromise in the so-called
“bias-variance” tradeoff [15]. As a classifier’s performance
is a combination of variance (random error) and bias (systematic error), in many cases, high-dimensional classifiers
with low bias (due to good performance in the current
sample) have large variances (i.e., poor precision) in new
samples. By contrast, simpler (and thus more rigid) classifiers, while possibly having higher levels of bias, are less
influenced by a specific sample and may have better overall performance (smaller variance) in multiple samples.
The simple TSP classifiers, it was hoped, would perform
sufficiently well both in the current sample as well as in
new samples. The TSP is a rank-based classifier in the
sense that it uses the rankings of gene expression levels
within a gene profile rather than the levels themselves, an
approach with significant advantages due to the nonparametric nature of the classification technique. The central
idea behind the TSP classifier is that it identifies two genes
whose gene expression ranking changes between the two
conditions under consideration. This change lends itself
to a simple biological interpretation as an inversion of
mRNA abundance of the two genes in the two conditions
under consideration. The pair of genes selected by the
TSP [6], referred to as the top scoring pair (TSP), is found
by the following approach: Consider G genes which have
been profiled by microarray analysis. Let n1 be the number of experiments from the first class with expression
levels Yi = {Yi,1 , Yi,2 , · · · , Yi,n1 }, and let n2 be the number
of experiments from the second class with expression levels Yi = {Yi,n1 +1 , Yi,n1 +2 , · · · , Yi,n }, where n = n1 + n2 .
Page 2 of 13
Given a pair of genes (i, j), 1 ≤ i = j ≤ G, the reversal
score of the pair was defined in [6] as
ij
= P(Yi > Yj |C = 1) − P(Yi > Yj |C = 2)
(1)
where P(Yi > Yj |C = m) denotes the probability that the
expression level of gene i is larger than the expression level
of gene j in samples from class C, with C being equal to
m = 1, 2. The score ij can be empirically approximated
by the expression [6]
Dij =
n1
=1 I1 (Yi,
> Yj, )
n1
−
n
=n1 +1 I2 (Yi,
> Yj, )
n2
(2)
where index indicates the th subject, 1 ≤ ≤ n and
Im (Yi, > Yj, ) = 1 if Yi, > Yj, in class m = 1, 2, and 0
otherwise.
Obviously, the larger the ij , the higher the probability that the expression levels of genes i and j have reverse
relative rankings in the two groups, and it is exactly this
property that is used for classification by the TSP. More
specifically, let (α, β) be the pair of genes that yields the
maximum score αβ = max{ ij } (referred to as the
Top Scoring Pair (TSP) [6]). Then the classification is
performed as follows:
Assume that
P(Yα > Yβ |C = 1) > P(Yα > Yβ |C = 2)
(3)
i.e.,
n1
=1 I1 (Yα,
n1
> Yβ, )
>
n
=n1 +1 I2 (Yα,
n2
> Yβ, )
(4)
Then a new subject s whose measured expression levels
for genes a and b are Yα,s and Yβ,s respectively, will be classified as belonging to the first class if Yα,s > Yβ,s , and to
the second class otherwise.
The genes in the top scoring pair as selected by the TSP
method may have a problem, as Lin et al. [5] also point
out: the selected genes may not be a pair of genuinely
up-regulated and down-regulated genes, but one of the
selected genes in the pair happens to serve only as a reference or “pivot” gene that may lead to a high TSP score
but a rather non-informative gene pair. Most researchers
have used more complicated methods or selected more
features in order to overcome the mentioned problems.
In the proposed method we employ a simple statistic
associated with the Receiver Operating Characteristic
(ROC) curve that is commonly known as the Area Under
the ROC curve (AUROC) or the Area Under the Curve
(AUC), for short. The ROC curve and the AUC in particular have been widely used as a measure for microarray classification and other medical diagnostic tests
(see, e.g., [16–23].
Kagaris et al. BMC Bioinformatics (2018) 19:244
Page 3 of 13
The proposed method, referred to as AUCTSP (AUCbased TSP), uses similar ideas as the TSP, thus benefiting
from the simplicity of the TSP approach, but enhances
TSP by making the resulting classifier less prone to overfitting, achieving higher classification accuracy and avoiding the selection of pivot genes as members of the top
scoring pair of genes.
Methods
In this manuscript we propose the AUCTSP, a classifier
that works according to the same principle as TSP but
differs from the latter in that the probabilities that determine the top scoring pair are computed based on the
relative rankings of the two marker genes across all subjects instead of within each individual subject. Although
the classification is still done on an individual-subject
basis, consideration of all subject data in the estimation
of the ranking reversals results in a classifier with higher
accuracy. This performance superiority of AUCTSP over
TSP is demonstrated through simulations and case studies
(see “Results” section) involving classification in ovarian,
leukemia, colon, prostate and breast cancers and diffuse
large b-cell lymphoma.
The proposed AUCTSP classifier
The score that TSP computes is based on the probability
P(Yi > Yj |C = m) that the expression level of gene i is
larger than the expression level of gene j in samples from
the m-th class, m = 1, 2. This probability was approximated in [6] by the proportion of individuals of class m
with higher expression level in gene i than in gene j out of
all individuals in class m, i.e., by the probability
PTSP (Yi > Yj |C = m) =
nm
=1 Im (Yi,
nm
> Yj, )
(5)
We propose to approximate the original probability
P(Yi > Yj |C = m) by the probability that a randomly chosen individual from class m has an expression level for gene i that is larger than that of a randomly chosen individual from class m (m = 1, 2) for
gene j.
The estimate of the original probability P(Yi > Yj |C =
m) in the proposed AUCTSP method is given by
PAUCTSP (Yi > Yj |C = m) =
nm
k=1
nm
=1 I(Yi,k
n2m
> Yj, )
The probability PAUCTSP can be calculated by the Area
Under the ROC Curve (AUC) [23]. The AUC statistic
has been used extensively in diagnostic test validation
[18–20, 22, 23] and gene feature selection [21] in twogroup settings. In our case here, group 1 is taken to be
the set of expression levels of gene i in class m, and group
2 is taken to be the set of expression levels of gene j in
the same class m. It is well established that, for independent samples, the AUC statistic is the minimum-variance
unbiased estimate of P(X > Y ) [24]. In correlated samples (as we have here, since the gene expression levels
are measured on the same individual i = 1, 2, · · · , nm for
m = 1, 2), it is expected that PAUCTSP is still an unbiased
estimate of P(X > Y ) and should generate more precise
estimates of the probability P(Yi > Yj |C = m) compared
to PTSP , unless the correlation of gene expression levels
between genes i and j in the same individual is too high
(thus leading to an inflated variance of the AUC-based
estimator). In addition, the AUCTSP classifier, which is
based on a summary measure derived from all subjects
(compared to the single-subject approach in the TSP), has
the potential to yield a top scoring pair that is less susceptible to the specific training data, thus further avoiding
overfitting compared to the TSP. The better performance of AUCTSP is corroborated by our experimental
results.
We highlight the following two points about our use of
the AUC statistic in the proposed method: (i) the AUC
statistic is traditionally applied on two groups one of
which is the “healthy” and the other one the “diseased,”
whereas in our method we apply it on gene expression
profiles from the same (“healthy” or “diseased”) group; (ii)
although the PAUCTSP is obtained from all subjects, the
classification rule that we obtain in the AUCTSP classifier is still applied on the expression levels of the marker
genes from the same single subject, exactly as in the TSP
classifier.
To elucidate the intuition behind the AUCTSP classifier,
consider the following example. Assume that the expression levels of a gene A for 5 healthy subjects are as given
in Table 1. The probability that the expression level of A
is less than the level of B in the healthy subjects is 5/5 =
1 while the probability that the level of A is less than the
level of B in the diseased subjects is 0, yielding an overall
Table 1 Gene expression levels in two genes
Healthy
(6)
The numerator in Eq. 6 denotes the sum over all samples
k, 1 ≤ k ≤ nm , of the number of times that the expression
level of gene i in sample k is larger than the expression
level of gene j in some other sample = k, 1 ≤ ≤ nm ,
from the same class m (m = 1 or 2).
Diseased
Healthy
Diseased
Gene A Gene B Gene A Gene B Gene C Gene D Gene C Gene D
11
12
32
31
10
20
42
31
21
22
34
33
12
23
43
33
23
24
36
35
15
25
45
35
25
26
38
37
17
27
47
37
27
28
40
39
19
18
39
41
Kagaris et al. BMC Bioinformatics (2018) 19:244
Page 4 of 13
TSP score DTSP
AB = 1. Contrast the above with the situation
involving two other genes, C and D (Table 1). The probability that the expression level of C is less than the level of
D in the healthy subjects is 4/5 = 0.8, while the probability that the expression level of C is less than the level of D
in the diseased subjects is 1/5 = 0.2. This yields an overall TSP score DTSP
CD = 0.6, which is less than the score of
pair A and B, and consequently the pair C and D would
be discarded by the TSP. However, the distributions of the
expression levels of C and D in the healthy (and the diseased) subjects exhibit greater separation than those for A
and B and thus, using genes C and D for classification is
arguably preferable.
The above intuitive preference for pair (C, D) is supported by the score derived for these two genes according
to the proposed AUCTSP approach. The non-parametric
estimate of the AUC for pair (C, D) on the healthy subjects is 24/25 = 0.96, and on the diseased subjects it
is 1/25 = 0.04. This yields an overall AUCTSP score of
DAUCTSP
= 0.92, while the corresponding AUCTSP score
CD
= 15/25 − 10/25 = 0.2
for the (A, B) gene pair is DAUCTSP
AB
and, therefore, the (C, D) pair is preferred over(A, B) by
the proposed approach. We note here that the claim about
the greater separation of the gene expression distributions
is not based in any way on the actual values of the data,
only on their ranking. This in turn means that the proposed method will be robust in selecting the top scoring
pair and will not be affected by outliers in the gene expression data and will also be invariable to any rank-preserving
normalization technique.
σX , and μY , σY denote the mean and standard deviation of the assumed normal distributions for X and Y,
respectively.
The cases chosen for comparison are two normal distributions with:
(i) small means (μX = 1, μY = 0) with small variances
(σX = 1, σY = 1);
(ii) small means (μX = 1, μY = 0) with large variances
(σX = 3, σY = 3);
(iii) large means (μX = 5, μY = 0) with small variances
(σX = 1, σY = 1);
(iv) large means (μX = 5, μY = 0) with large variances
(σX = 3, σY = 3);
(v) equal small means (μX = 1, μY = 1) with a small
variance for one distribution (σX = 1) and a large
variance for the other distribution (σY = 3);
(vi) equal large means (μX = 5, μY = 5) with a small
variance for one distribution (σX = 1) and a large
variance for the other distribution (σY = 3).
Table 2 Simulation results on estimation of P(X > Y) by TSP and
AUCTSP
Gene X
Gene Y
N
TSP
AUCTSP
Az
N(1,1)
N(0,1)
10
0.763
0.762
0.760
20
0.762
0.761
0.760
30
0.759
0.760
0.760
40
0.759
0.760
0.760
N(1,3)
N(0,3)
Results
The AUCTSP classifier was implemented in the C programming language. The evaluation of the methodology
was based on (i) simulations and (ii) case studies.
N(5,1)
N(0,1)
Simulations
We compared the estimations given by TSP (Eq. 5) and
AUCTSP (Eq. 6) for the probability P(X > Y ) involved
in the computation of the TSP and AUCTSP scores. We
generated random expression levels for “genes” X and Y
from normal distributions with different combinations of
mean μ and deviation σ for different sample sizes, where
μX is greater than or equal to μY in all of the simulated
cases. In this case, the probability P(X > Y ) is given by
the detectability index Az defined by Metz et al. [22] as:
Az = P(X > Y ) =
N(1,1)
N(0,3)
N(1,3)
⎞
⎛
⎜
⎜
⎝
N(5,3)
|μX −μY |
σX
1+
σY
σX
⎟
⎟
2⎠
(7)
where () denotes the cumulative distribution function (CDF) of the standard normal distribution and μX ,
N(5,1)
N(5,3)
10
0.595
0.594
0.592
20
0.594
0.593
0.592
30
0.594
0.593
0.592
40
0.593
0.592
0.592
10
0.998
0.998
0.999
20
0.998
0.998
0.999
30
0.998
0.998
0.999
40
0.998
0.998
0.999
10
0.883
0.882
0.878
20
0.881
0.880
0.878
30
0.880
0.879
0.878
40
0.880
0.879
0.878
10
0.619
0.610
0.500
20
0.587
0.581
0.500
30
0.572
0.564
0.500
40
0.563
0.557
0.500
10
0.616
0.610
0.500
20
0.585
0.575
0.500
30
0.570
0.563
0.500
40
0.559
0.554
0.500
The estimates of P(X > Y) closer to Az are marked in bold
Kagaris et al. BMC Bioinformatics (2018) 19:244
Page 5 of 13
Table 3 Simulation results for the ability of AUCTSP and TSP to identify the most informative gene pair
Gene 1
Gene 2
N=100 n1 = n2 =20
N=100 n1 = n2 =40
N=200 n1 = n2 =20
N=200 n1 = n2 =40
TSP
AUCTSP
TSP
TSP
TSP
AUCTSP
AUCTSP
AUCTSP
NH(0,1) ND(1,1)
NH(1,1) ND(0,1)
23.4
51.2
58.8
93.2
15.4
39.8
45.4
89.7
NH(-1,1) ND(1,1)
NH(1,1) ND(-1,1)
69.1
98.9
97.7
99.9
57.8
97.2
94.0
99.9
NH(-2,1) ND(2,1)
NH(2,1) ND(-2,1)
91.6
99.9
97.6
99.9
92.7
99.8
95.7
99.9
NH(-2,2) ND(2,2)
NH(2,2) ND(-2,2)
48.2
93.2
80.2
99.9
38.3
91.4
71.4
99.9
The results for different sample sizes N = 10, 20, 30, 40
are shown in Table 2. Columns 4 and 5 show the estimates
of probability P(X > Y ) obtained by TSP and AUCTSP
over 1000 random trials. The theoretical probability Az =
P(X > Y ) (see Eq. 7) is shown in the last column. With
bold, we show the value that is closer to the theoretical
value Az . As can be seen, for the cases where both simulated gene expression distributions have equal variances
(cases i-iv), the AUCTSP and TSP estimates are virtually
identical and are very close to the theoretical probability
even for small sample sizes. In the two cases where the
variance in one of the genes is greater (cases v-vi), both
estimators do poorly for small sample size N and improve
with increasing N, but the AUCTSP is always closer to the
target quantity Az .
Next, we compared the capability of TSP and AUCTSP
to identify the single informative pair of genes in the midst
of other non-informative genes. For this purpose, we generated random normal expression levels for N “genes”
from n1 “healthy” individuals and n2 “diseased” individuals, for all combinations of N = 100, 200 and n1 =
n2 = 20, 40. In all these simulations the genes numbered
1 and 2 carry the differentiating information between
the healthy and diseased groups, represented by normal
distributions (NH() for the “healthy” and ND() for the “diseased”) that are different from N(0,1), as shown in Table 3.
All remaining genes other than 1 and 2 have expression
levels obtained from the same “non-informative” distribution N(0,1). The efficacy of each classifier is measured
by how many times it is able to identify the pair of genes
(1,2) as the top scoring pair. The results (as averages over
1000 simulations) are shown in Table 3. The rows correspond to cases exploring the effect of increasing variance
and increasing differences in the means of the expression
level distributions. As can be observed, the AUCTSP consistently outperforms the TSP, in some cases dramatically,
even for small sample sizes.
(ii) Acute Leukemia (Golub et al., 1999 [25]) dataset
which consists of 3571 human genes with expression
levels from 25 cases of acute myeloid (aka
myelogenous) leukemia (AML) and 47 cases from
acute lymphoblastic (aka lymphocytic) leukemia;
(iii) Breast Cancer - Estrogen Receptor (ER) status (West
et al., 2001 [26]) dataset which consists of the
expression levels of 7129 genes in 49 tissues
separated into two groups of 25 positive and 24
Table 4 Top scoring pairs of genes under TSP and AUCTSP
Score
Dataset
OVARIAN
LEUKEMIA
BREAST-ER
BREAST-LN
DLBCL
DLBCL-FL
COLON
Case studies
We evaluated the performance of the AUCTSP classifier
over the TSP classifier in 8 publicly available datasets:
(i) Ovarian Cancer (Pepe et al., 2003 [17]) dataset which
consists of 1536 genes with expression levels from 23
healthy and 30 diseased subjects;
PROSTATE
a
Method
Gene pair
TSP
AUCTSP
TSP
[PKM2, OVGP1]
0.900
0.675
AUCTSP
[IRS1, OVGP1]
0.833
0.826
TSP
[SPTAN1, CD33]
0.979
0.938
TSP
[ARHGAP45, ZYX]
0.979
0.770
TSP
[PCDHGC3, ZYX]
0.979
0.855
AUCTSP
[SPTAN1, CD33]
0.979
0.938
TSP
[MUC2, ESR1]
0.918
0.812
TSP
[JAK3, ESR1]
0.918
0.791
TSP
[GNB3, ESR1]
0.918
0.804
TSP
[HARS2, ESR1]
0.918
0.834
TSP
[ERF, ESR1]
0.918
0.822
AUCTSP
[CTSC, ESR1]
0.878
0.891
TSP
[BP1CR, GYPB]
0.838
0.675
AUCTSP
[BP1CR, KRT31]
0.717
0.765
TSP
[FABP3, ACVR1B]b
0.716
0.531
AUCTSP
[GYPB, ACVR1B]b
0.633
0.615
TSP
[PDE4B, GPR12]
0.596
0.414
AUCTSP
[POLR2J, PTGER4]
0.341
0.46
TSP
[YWHAZ, SNRPB]
0.983
0.727
AUCTSP
[FCGR1A, NEO1]
0.759
0.83
TSP
[VIP, DARS]
0.879
0.637
AUCTSP
[MYH9, HNRNPA1]
0.759
0.724
TSP
[CFD, ENO1]
0.901
0.693
AUCTSP
[CFD, NUMB]
0.882
0.883
indicates the selected TSP gene pair by [7] to break the tie for pairs with equal TSP
scores
b
indicates the selected pair of genes by TSP and AUCTSP after removing the
genetically modified gene BP1CR (see [32, 33]) from the dataset
Kagaris et al. BMC Bioinformatics (2018) 19:244
Page 6 of 13
Table 5 Gene legend
Data set
Gene ID
Gene
acronym
Gene description
OVARIAN
g47
IRS1
g93
OVGP1
g1202
PKM2
D86976
ARHGAP45
J05243
SPTAN1
L11373
PCDHGC3
Insulin Receptor
Substrate 1
Oviductal
Glycoprotein 1
Pyruvate Kinase,
Muscle
Rho GTPase
Activating Protein 45
Spectrin Alpha,
Non-Erythrocytic 1
Protocadherin
Gamma Subfamily C, 3
M23197
X95735
L21998
U09607
U15655
U18937
CD33
ZYX
MUC2
JAK3
ERF
HARS2
U47931
GNB3
X03635
X87212
AFFX-CreX-3
ESR1
CTSC
BP1CR
X82634
J02982
M18079
KRT31
GYPB
FABP3
X15357
ACVR1B
LEUKEMIA
BREAST-ER
BREAST-LN
DLBCL
DLBCL-FL
K03008
POLR2J
L20971
L28175
PDE4B
PTGER4
U18548
GPR12
D78134
YWHAZ
M63835
U61262
X17567
COLON
PROSTATE
FCGR1A
NEO1
SNRPB
Hsa.37937
Hsa.8010
MYH9
HNRNPA1
Hsa.2097
VIP
Hsa.601
DARS
40282_s_at
2035_s_at
37693_at
CFD
ENO1
NUMB
(iv)
CD33 Molecule
Zyxin
Mucin 2
Janus Kinase 3
ETS2 Repressor Factor
Histidyl-TRNA
Synthetase 2,
Mitochondrial
G Protein Subunit
Beta 3
Estrogen Receptor 1
Cathepsin C
Bacteriophage P1 Cre
Recombinase
Keratine 31
Glycophorin B
Fatty Acid Binding
Protein 3
Activin A Receptor
Type 1B
RNA Polymerase II
Subunit J
Phosphodiesterase 4B
Prostaglandin E
Receptor 4
G Protein-Coupled
Receptor 12
Tyrosine
3-Monooxygenase/
Tryptophan
5-Monooxygenase
Activation Protein
Zeta
Fc Fragment Of IgG
Receptor Ia
Neogenin 1
Small Nuclear
Ribonucleoprotein
Polypeptides B and B1
Myosin Heavy Chain 9
Heterogeneous
Nuclear
Ribonucleoprotein A1
Vasoactive Intestinal
Peptide
Aspartyl-TRNA
Synthetase
Complement Factor D
Enolase 1
NUMB, Endocytic
Adaptor Protein
(v)
(vi)
(vii)
(viii)
negative tissues based on the estrogen receptor (ER)
status;
Breast Cancer - Lymph Node (LN) status (West et al.,
2001 [26]) dataset which consists of the expression
levels of 7129 genes in 49 tissues separated into two
groups of 24 positive and 25 negative tissues based
on the lymph node (LN) status;
Diffuse Large B-Cell Lymphoma (DLBCL) to predict
patient outcome (Alizadeh et al., 2000 [27]) dataset
which consists of the expression levels of 7129 genes
in 32 cured samples and 26 fatal or refractory disease
samples.
DLBCL versus Follicular Lymphoma (FL) (Alizadeh
et al., 2000 [27]) dataset which consists of the
expression levels of 7129 genes in 58 DLBCL
samples and 19 FL samples;
Colon Cancer (Alon et al., 1999 [28]) dataset which
consists of the expression levels of 2000 genes from
40 subjects diagnosed with colon cancer and 22
healthy subjects;
Prostate cancer (Singh et al., 2002 [29]) dataset
which consists of the expression levels of 12533
Table 6 Deviation of the genes selected by TSP and AUCTSP
from the non-informative “pivot” gene
Dataset
Method
Gene Pair
(Pg1 , Pg2 )
(Pˆ g1 , Pˆ g2 )
OVARIAN
TSP
(PKM2, OVGP1)
(0.16, 0.03)
(0.84, 0.97)
AUCTSP
(IRS1, OVGP1)
(0.84, 0.03)
(0.84, 0.97)
LEUKEMIA
TSP
(SPTAN1, CD33)a
(0.05, 0.99)
(0.95, 0.99)
TSP
(ARHGAP45, ZYX)
(0.61, 0.02)
(0.61, 0.98)
TSP
(PCDHGC3, ZYX)
(0.63, 0.02)
(0.63, 0.98)
BREAST-ER
BREAST-LN
DLBCL
DLBCL-FL
COLON
PROSTATE
a
AUCTSP
(SPTAN1, CD33)
(0.95, 0.01)
(0.95, 0.99)
TSP
(MUC2, ESR1)a
(0.72, 0.04)
(0.72, 0.96)
TSP
(JAK3, ESR1)
(0.66, 0.04)
(0.66, 0.96)
TSP
(GNB3, ESR1)
(0.56, 0.04)
(0.56, 0.96)
TSP
(HARS2, ESR1)
(0.57, 0.04)
(0.57, 0.96)
TSP
(ERF, ESR1)
(0.58, 0.04)
(0.58, 0.96)
AUCTSP
(CTSC, ESR1)
(0.91, 0.04)
(0.91, 0.96)
TSP
(FABP3, ACVR1B)
(0.60, 0.69)
(0.60, 0.69)
AUCTSP
(GYPB, ACVR1B)
(0.14, 0.69)
(0.86, 0.69)
TSP
(PDE4B, GPR12)
(0.73, 0.32)
(0.73, 0.68)
AUCTSP
(POLR2J, PTGER4)
(0.30, 0.72)
(0.70, 0.72)
TSP
(YWHAZ, SNRPB)
(0.80, 0.10)
(0.80, 0.90)
AUCTSP
(FCGR1A, NEO1)
(0.06, 0.84)
(0.94, 0.84)
TSP
(VIP, DARS)
(0.82, 0.16)
(0.82, 0.84)
AUCTSP
(MYH9, HNRNPA1)
(0.89, 0.24)
(0.89, 0.76)
TSP
(CFD, ENO1)
(0.91, 0.27)
(0.91, 0.73)
AUCTSP
(CFD, NUMB)
(0.91, 0.04)
(0.91, 0.96)
indicates the selected TSP gene pair by [7] to break the tie for pairs with equal TSP
scores
Kagaris et al. BMC Bioinformatics (2018) 19:244
Page 7 of 13
genes from 52 subjects diagnosed with prostate
cancer and 50 healthy subjects.
Top scoring pairs selected by TSP and AUCTSP
For each of these datasets, we applied AUCTSP and TSP
and identified the top-scoring pairs obtained by AUCTSP
and TSP. The selected pairs of genes are shown in Table 4
and the gene legend is shown in Table 5.
Table 4 reports also (for informational purposes) the
score that the selected pair by TSP and AUCTSP receives
under the opposite classifier (AUCTSP and TSP, respectively). For example, the pair selected by TSP for the ovarian cancer dataset has a TSP score of 0.9 but it receives
a score of 0.675 under AUCTSP, whereas the AUCTSP
score of the pair selected by AUCTSP is 0.826, while the
score given to it by TSP is 0.833. This shows that pairs
selected by TSP may have significantly lower scores under
AUCTSP.
The biological relevance of the selected genes was found
by consulting the GENECARDS database [30] and the
VarElect NGS Phenotyper [31]. All of the genes identified
by AUCTSP have been reported in the existing literature
to be indeed related to the corresponding disease, whereas
some of the genes identified by TSP such as DARS for
colon cancer have not been reported to be related. A full
description of the biological findings on the genes selected
by AUCTSP and TSP is given in the Additional file 1.
The histograms of the selected genes are also given in the
Additional file 2.
We also note that for the datasets examined, AUCTSP
resulted in no ties, whereas TSP frequently selected
multiple pairs of genes having the same highest TSP
score (3 such pairs in the Leukemia dataset and 5 pairs
in the Breast-ER dataset). We have identified the gene
pair ultimately chosen by the TSP after applying the
tie-breaking rule proposed by Geman et al. [6] with an
asterisk (“*”) in Table 4. (For the case of the Breast-LN
dataset, both the AUCTSP and TSP resulted in selecting a
genetically modified gene (“Bacteriophage P1 Cre recombinase”) [32, 33] as member the top-scoring pair. The pair
of genes selected by the AUCTSP and TSP after eliminating this gene from the dataset are marked with (“**”) in
Table 4).
Furthermore, in order to check how far the selected
genes (by either method) are from being non-informative
“pivot” genes, we computed for each gene g the probability
Pg = P(g∈ C1 > g∈ C2 ) that the expression levels of g
in class C1 are greater than the expression levels of g in
class C2 , where C1 , C2 are the two classes in the corresponding dataset. A value of Pg close to 0.5 means that the
gene is strongly non-informative. A value of Pg close to 1
or close to 0 means that the gene is strongly informative.
For the case where the value of Pg is close to 0, we can
simply inverse the ROC curve to compute the probability
P(g∈ C1 < g∈ C2 ), so that all informative genes are indicated by values of Pg close to 1. The computation of Pg
was done by computing the AUC of the ROC curve corresponding to the expression values of gene g in classes C1
and C2 . The results are shown in Table 6. The Pg values
for each member of a selected pair are shown in column
4, whereas column 5 shows the corresponding values Pˆ g
if the ROC curve has to be inverted so that values closer
to 1 indicate more informative genes. As can be seen, the
genes selected by AUCTSP have better deviation from
the 0.5 value of a non-informative gene in almost every
case.
Classifier performance of AUCTSP vs. TSP
We also compared the performance of the proposed
AUCTSP classifier vs. the TSP classifier in terms of
accuracy for predicting the correct status of subjects
in a “testing” set after the classification rule (i.e., the
top-scoring pair and its associated probabilities under
AUCTSP and TSP, respectively) is obtained from a
“training” set.
For each of the eight datasets in our case study, we generated several training sets and testing sets, by randomly
picking a percentage p of subjects to form the training
set and using the remaining q = 1 − p percentage of
Table 7 Comparison of classifier accuracy by TSP and AUCTSP for decreasing size of training set
Test set fraction OVARIAN
TSP
LEUKEMIA
AUCTSP TSP
COLON
AUCTSP TSP
BREAST-LN
AUCTSP TSP
BREAST-ER
AUCTSP TSP
DLBCL
AUCTSP TSP
DLBCL-FL
AUCTSP TSP
PROSTATE
AUCTSP TSP
AUCTSP
1%
87.18 93.39
97.89 97.89
88.98 96.59
89.76 94.66
84.26 91.07
78.50 78.88
95.80 99.30
91.90 91.90
5%
87.48 89.43
96.02 96.12
84.45 92.45
86.03 89.35
75.40 84.11
78.20 78.50
91.46 96.23
90.70 90.50
10%
77.43 82.78
91.64 92.27
76.76 95.01
89.76 94.66
84.26 91.06
77.20 78.02
83.18 92.49
81.34 80.37
15%
76.96 79.7
88.2
72.71 73.02
77.85 78.6
65.84 75.07
72.84 76.73
83.02 87.57
79.10 79.50
20%
70.71 73.95
84.32 89.1
61.39 79.15
86.03 89.35
75.39 84.10
69.23 75.35
71.30 75.45
68.70 76.06
25%
72.2
81.27 87
53.75 67.65
82.05 85.48
71.20 80.80
66.79 72.11
66.87 67.14
63.30 74.35
30%
61.15 80.38
77.53 81.1
41.38 42.39
77.85 78.6
65.84 75.06
63.41 72.13
67.35 66.74
53.30 60.7
76.6
90.9
Kagaris et al. BMC Bioinformatics (2018) 19:244
Page 8 of 13
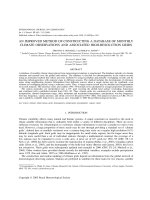
Fig. 1 Comparison of TSP vs. AUCTSP classification accuracy for different sizes of training sets: OVARIAN dataset
subjects as the testing set, for different values of q =
1%, 5%, 10%, 15%, 20%, 30%. The actual size of the testing
set was set to N · q , where N is the size of the dataset,
and the set of the training set was set to N − N · q .
Our intention was to see how AUCTSP and TSP behave
as the training set decreases, i.e., how well AUCTSP and
TSP can “generalize” their classification rule. Each test was
repeated for 1000 trials and the average of the classifier
accuracy (i.e., the ratio of the sum of the true positive and
true negative test cases identified by the classification rule
Fig. 2 Comparison of TSP vs. AUCTSP classification accuracy for different sizes of training sets: COLON dataset
Kagaris et al. BMC Bioinformatics (2018) 19:244
Page 9 of 13
Fig. 3 Comparison of TSP vs. AUCTSP classification accuracy for different sizes of training sets: LEUKEMIA dataset
obtained from the training set over the total number of
test cases) was calculated over these trials for each training
set.
The results for increasing sizes of test sets (equivalently, decreasing sizes of training sets) as percentages of
subjects left out from the original dataset are shown in
Table 7. The plot representations of the results listed in
Table 7 are given in Figs. 1, 2, 3, 4, 5, 6, 7 and 8. These
results show that the AUCTSP method performs better in
terms of classification accuracy than the TSP method. The
results indicate that the AUCTSP classifier is able indeed
to identify useful marker genes from small training sets,
Fig. 4 Comparison of TSP vs. AUCTSP classification accuracy for different sizes of training sets: BREAST-LN dataset
Kagaris et al. BMC Bioinformatics (2018) 19:244
Page 10 of 13
Fig. 5 Comparison of TSP vs. AUCTSP classification accuracy for different sizes of training sets: BREAST-ER dataset
in accordance with the “generalization” capability of the
AUC statistic.
Discussion
AUCTSP maintains the basic advantages of TSP namely
the data-driven and parameter-free machine learning
features that resolve the parameter tuning issue without
making any assumptions about the data used, as well as
the production of easily interpretable classification rules.
AUCTSP, however, improves TSP by avoiding overfitting
and suffering less from small sample sizes, due to the fact
that every sample is compared to all other samples in the
Fig. 6 Comparison of TSP vs. AUCTSP classification accuracy for different sizes of training sets: DLBCL-FL dataset
Kagaris et al. BMC Bioinformatics (2018) 19:244
Page 11 of 13
Fig. 7 Comparison of TSP vs. AUCTSP classification accuracy for different sizes of training sets: DLBCL dataset
same class rather than on only a single sample by sample comparison as in TSP. In addition, AUCTSP tends to
avoid selection of non-informative pivot genes, which are
a known problem of TSP. Concerning selection of genes
whose over-expression or under-expression is due to
reasons unrelated to the disease in question, we note that
this is less likely to create a problem since pairs of genes
rather than single genes have to be affected in that way.
Finally, we note that AUCTSP can be extended to select
a number of k > 1 pairs of genes, with the classification
Fig. 8 Comparison of TSP vs. AUCTSP classification accuracy for different sizes of training sets: PROSTATE dataset
Kagaris et al. BMC Bioinformatics (2018) 19:244
being made according to a majority voting rule among
those k pairs of genes, as was done in [7], or to find
triplets instead of pairs of genes as was done in [5]. As a
non-parametric based technique, AUCTSP can also have
potential benefits in areas such as RNA sequence analysis
(see, e.g. [34]), but this extension is left for future work.
Conclusion
In this paper, we have proposed the AUCTSP, a simple yet
reliable and robust rank-based classifier for gene expression classification. AUCTSP works according to the same
principle as TSP but differs from the latter in that the
probabilities that determine the top scoring pair are computed based on the relative rankings of the two marker
genes across all subjects as opposed to for each individual subject. Results of calculating and comparing the
AUCTSP and TSP probabilities for synthetic data as well
as 8 publicly available datasets demonstrate the better
performance of AUCTSP over TSP.
Additional files
Additional file 1: Biological relevance of the selected gene pairs. A full
description of the biological findings on the genes selected by AUCTSP
and TSP is given. (PDF 112 kb)
Additional file 2: Histograms of the selected genes. The histograms of all
the genes selected by AUCTSP and TSP are given. (PDF 294 kb)
Abbreviations
AUC: Area under the (ROC) curve; AUCTSP: AUC-based TSP; AUROC: Area
under the ROC (curve); ROC: Receiver operating characteristic (curve); TSP: Top
scoring pair
Availability of data and materials
The datasets used in the current study are already publicly available. The C
code is available at />Authors’ contributions
CTY and DK conceived of the study and DK and AK implemented the code. AK
collected the data and composed all figures. DK, AK, and CTY wrote the
manuscript. All authors read and approved the final version of this manuscript.
Ethics approval and consent to participate
Not Applicable.
Consent for publication
Not Applicable.
Competing interests
The authors declare that they have no competing interests.
Publisher’s Note
Springer Nature remains neutral with regard to jurisdictional claims in
published maps and institutional affiliations.
Author details
1 Department of Electrical and Computer Engineering, Southern Illinois
University, 1230 Lincoln Drive, 62901 Carbondale, IL, USA . 2 Department of
Biostatistics, Indiana University School of Public Health, 410 West 10th Street,
Suite 3000, 46202 Indianapolis, IN, USA.
Page 12 of 13
Received: 7 January 2018 Accepted: 4 June 2018
References
1. DeRisi J, Penland L, Brown PO, Bittner ML, Meltzer PS, Ray M, Chen Y,
Su YA, Trent JM. Use of a cDNA microarray to analyze gene expression
patterns in human cancer. Nat Genet. 1996;14:457–60.
2. DeRisi JL, Iyer VR, Brown PO. Exploring the metabolic and genetic control
of gene expression on a genomic scale. Science. 1997;278(5338):680–6.
3. Cheung VG, Morley M, Aguilar F, Massimi A, Kucherlapati R, Childs G.
Making and reading microarrays. Nat Genet. 1999;21:15–9.
4. Martínez E, Yoshihara K, Kim H, Mills GM, Treviño V, Verhaak RG.
Comparison of gene expression patterns across 12 tumor types identifies
a cancer supercluster characterized by TP53 mutations and cell cycle
defects. Oncogene. 2015;34(21):2732–40.
5. Lin X, Afsari B, Marchionni L, Cope L, Parmigiani G, Naiman D, Geman D.
The ordering of expression among a few genes can provide simple
cancer biomarkers and signal BRCA1 mutations. BMC Bioinformatics.
2009;10(1):256.
6. Geman D, d’Avignon C, Naiman DQ, Winslow RL, et al. Classifying gene
expression profiles from pairwise mRNA comparisons. Stat Appl Genet
Mol Biol. 2004;3(1):1071.
7. Tan AC, Naiman DQ, Xu L, Winslow RL, Geman D. Simple decision rules
for classifying human cancers from gene expression profiles.
Bioinformatics. 2005;21(20):3896–904.
8. Cui X, Churchill GA. Statistical tests for differential expression in cDNA
microarray experiments. Genome Biol. 2003;4:210.
9. Ben-Dor A, Bruhn L, Friedman N, Nachman I, Schummer M, Yakhini Z.
Tissue classification with gene expression profiles. J Comput Biol.
2000;7(3-4):559–83.
10. Chopra P, Lee J, Kang J, Lee S. Improving cancer classification accuracy
using gene pairs. PLoS ONE. 2010;5(12):14305.
11. Troyanskaya OG, Garber ME, Brown PO, Botstein D, Altman RB.
Nonparametric methods for identifying differentially expressed genes in
microarray data. Bioinformatics. 2002;18(11):1454–61.
12. Efron B, Tibshirani R, Storey JD, Tusher V. Empirical Bayes analysis of a
microarray experiment. J Am Stat Assoc. 2001;96(456):1151–60.
13. Breitling R, Armengaud P, Amtmann A, Herzyk P. Rank products: a
simple, yet powerful, new method to detect differentially regulated genes
in replicated microarray experiments. FEBS Lett. 2004;573(1-3):83–92.
14. Che D, Liu QC, Rasheed K, Tao X. Decision tree and ensemble learning
algorithms with their applications in bioinformatics. Adv Exp Med Biol.
2011;696:191–9.
15. Geman S, Bienenstock E, Doursat R. Neural networks and the
bias/variance dilemma. Neural Comput. 1992;4(1):1–58.
16. Krzanowski WJ, Hand DJ. ROC Curves for Continuous Data. Boca Raton:
CRC Press; 2009.
17. Pepe MS. The Statistical Evaluation of Medical Tests for Classification and
Prediction. New York: Oxford University Press; 2003.
18. Greiner M, Pfeiffer D, Smith R. Principles and practical application of the
receiver-operating characteristic analysis for diagnostic tests. Prev Vet
Med. 2000;45(1):23–41.
19. Girling A. Rank statistics expressible as integrals under p–p-plots and
receiver operating characteristic curves. J R Stat Soc Ser B Stat Methodol.
2000;62(2):367–82.
20. Lee W-C, Hsiao CK. Alternative summary indices for the receiver
operating characteristic curve. Epidemiology. 1996;7(6):605–11.
21. Mamitsuka H. Selecting features in microarray classification using ROC
curves. Pattern Recogn. 2006;39(12):2393–404.
22. Metz CE, Herman BA, Shen J-H. Maximum likelihood estimation of
receiver operating characteristic (ROC) curves from
continuously-distributed data. Stat Med. 1998;17(9):1033–53.
23. Hanley JA, McNeil BJ. The meaning and use of the area under a receiver
operating characteristic (ROC) curve. Radiology. 1982;143(1):29–36.
24. DeLong ER, DeLong DM, Clarke-Pearson DL. Comparing the areas under
two or more correlated receiver operating characteristic curves: a
nonparametric approach. Biometrics. 1988;44:837–45.
25. Golub TR, Slonim DK, Tamayo P, Huard C, Gaasenbeek M, Mesirov JP,
Coller H, Loh ML, Downing JR, Caligiuri MA, et al. Molecular classification
of cancer: class discovery and class prediction by gene expression
monitoring. Science. 1999;286(5439):531–7.
Kagaris et al. BMC Bioinformatics (2018) 19:244
26. West M, Blanchette C, Dressman H, Huang E, Ishida S, Spang R, Zuzan H,
Olson JA, Marks JR, Nevins JR. Predicting the clinical status of human
breast cancer by using gene expression profiles. Proc Natl Acad Sci.
2001;98(20):11462–7.
27. Alizadeh AA, Eisen MB, Davis RE, Ma C, Lossos IS, Rosenwald A, Boldrick JC,
Sabet H, Tran T, Yu X, et al. Distinct types of diffuse large B-cell lymphoma
identified by gene expression profiling. Nature. 2000;403(6769):503–11.
28. Alon U, Barkai N, Notterman DA, Gish K, Ybarra S, Mack D, Levine AJ.
Broad patterns of gene expression revealed by clustering analysis of
tumor and normal colon tissues probed by oligonucleotide arrays. Proc
Natl Acad Sci. 1999;96(12):6745–50.
29. Singh D, Febbo PG, Ross K, Jackson DG, Manola J, Ladd C, Tamayo P,
Renshaw AA, D’Amico AV, Richie JP, et al. Gene expression correlates of
clinical prostate cancer behavior. Cancer Cell. 2002;1(2):203–9.
30. GeneCards HumanGeneDatabase. . Accessed
Dec 2017.
31. Stelzer G, Plaschkes I, Oz-Levi D, Alkelai A, Olender T, Zimmerman S,
Twik M, Belinky F, Fishilevich S, Nudel R, et al. VarElect: the
phenotype-based variation prioritizer of the GeneCards suite. BMC
Genomics. 2016;17(2):444.
32. Vargo-Gogola T, Rosen JM. Modelling breast cancer: one size does not fit
all. Nat Rev Cancer. 2007;7(9):659.
33. Wierzbicki A, Kendall M, Abremski K, Hoess R. A mutational analysis of
the bacteriophage P1 recombinase Cre. J Mol Biol. 1987;195(4):785–94.
34. Bullard JH, Purdom E, Hansen KD, Dudoit S. Evaluation of statistical
methods for normalization and differential expression in mRNA-Seq
experiments. BMC Bioinformatics. 2010;11(1):94.
Page 13 of 13