Windows Server 2008 Inside Out- P8
Bạn đang xem bản rút gọn của tài liệu. Xem và tải ngay bản đầy đủ của tài liệu tại đây (1.37 MB, 50 trang )
Table 11-1 Process Statistics and How They Can Be Used
Column Name Description
Base Priority
(BasePriority)
Shows the priority of the process. Priority determines how much
of the system resources are allocated to a process. The standard
priorities are Low (4), Below Normal (6), Normal (8), Above Normal
(10), High (13), and Real-Time (24). Most processes have a Normal
priority by default, and the highest priority is given to real-time
processes.
CPU Time
(TotalProcessor-
Time)
Shows the total amount of CPU time used by the process since it
was started. Click the column header to quickly see the processes
that are using the most CPU time. If a process is using a lot of CPU
time, the related application might have a confi guration problem.
This could also indicate a runaway or nonresponsive process that is
unnecessarily tying up the CPU.
CPU Usage (CPU) Shows the percentage of CPU utilization for the process. The System
Idle Process shows what percentage of CPU power is idle. A 99 in
the CPU column for the System Idle Process means 99 percent of
the system resources currently aren’t being used. If the system has
low idle time (meaning high CPU usage) during peak or average
usage, you might consider upgrading to faster processors or adding
processors.
Handles
(HandleCount)
Shows the number of fi le handles maintained by the process. The
number of handles used is an indicator of how dependent the
process is on the fi le system. Some processes have thousands of open
fi le handles. Each fi le handle requires system memory to maintain.
Image Name
(ProcessName)
Shows the name of the process.
Image Path Name
(Path)
Shows the full path to the executable for the process.
Memory –
Commit Size
(Virtual-
MemorySize)
Shows the amount of virtual memory allocated to and reserved for
a process. Virtual memory is memory on disk and is slower to access
than pooled memory. By confi guring an application to use more
physical RAM, you might be able to increase performance. To do this,
however, the system must have available RAM. If it doesn’t, other
processes running on the system might slow down.
Memory –
Non-Paged Pool
(NonpagedSystem-
MemorySize)
Shows the amount of virtual memory for a process that cannot be
written to disk. The nonpaged pool is an area of RAM for objects
that can’t be written to disk. You should note processes that require
a high amount of nonpaged pool memory. If there isn’t enough free
memory on the server, these processes might be the reason for a
high level of page faults.
Memory –
Paged Pool
(PagedSystem -
MemorySize)
Shows the amount of committed virtual memory for a process
that can be written to disk. The paged pool is an area of RAM for
objects that can be written to disk when they aren’t used. As process
activity increases, so does the amount of pool memory the process
uses. Most processes have more paged pool than nonpaged pool
requirements.
Tracking a System’s General Health 317
Chapter 11
Please purchase PDF Split-Merge on www.verypdf.com to remove this watermark.
Column Name Description
Memory –
Peak Working Set
(PeakWorkingSet)
Shows the maximum amount of memory the process used, including
both the private working set and the non-private working set. If peak
memory is exceptionally large, this can be an indicator of a memory
leak.
Memory –
Working Set
(WorkingSet)
Shows the amount of memory the process is currently using,
including both the private working set and the non-private working
set. The private working set is memory the process is using that
cannot be shared with other processes. The non-private working
set is memory the process is using that can be shared with other
processes. If memory usage for a process slowly grows over time and
doesn’t go back to the baseline value, this can be an indicator of a
memory leak.
Memory –
Working Set Delta
Shows the change in memory usage for the process recorded since
the last update. A constantly changing memory delta can be an
indicator that a process is in use, but it could also indicate a problem.
Generally, the memory delta might show increasing memory usage
when a process is being used and then show a negative delta
(indicated by parentheses in Task Manager) as activity slows.
Page Fault Delta Shows the change in the number of page faults for the process
recorded since the last update. As with memory usage, you might
see an increase in page faults when a process is active and then a
decrease as activity slows.
Page Faults Shows page faults caused by the process. Page faults occur when
a process requests a page in memory and the system can’t fi nd it
at the requested location. If the requested page is elsewhere in
memory, the fault is called a soft page fault. If the requested page
must be retrieved from disk, the fault is called a hard page fault. Most
processors can handle large numbers of soft faults. Hard faults, on
the other hand, can cause signifi cant delays. If there are a lot of hard
faults, you might need to increase the amount of memory or reduce
the system cache size.
PID (Id) Shows the run-time identifi cation number of the process.
Session ID
(SessionId)
Shows the identifi cation number user (session) within which the
process is running. This corresponds to the ID value listed on the
Users tab.
Threads (Threads) Shows the number of threads that the process is using. Most server
applications are multithreaded, which allows concurrent execution
of process requests. Some applications can dynamically control the
number of concurrently executing threads to improve application
performance. Too many threads, however, can actually reduce
performance, because the operating system has to switch thread
contexts too frequently.
Chapter 11
318 Chapter 11 Performance Monitoring and Tuning
Please purchase PDF Split-Merge on www.verypdf.com to remove this watermark.
At a Windows PowerShell prompt, you can get key stats for all processes by following
these steps:
1. Get all the processes running on the server and store them in the $a variable by
entering:
$a = get-process
2. Use the InputObject parameter to pass the process objects stored in $a to get-
process and then pass the objects to the format-table cmdlet along with the list of
properties you want to see by entering:
get-process -inputobject $a | format-table –property ProcessName,
BasePriority, HandleCount, Id, NonpagedSystemMemorySize,
PagedSystemMemorySize, PeakPagedMemorySize, PeakVirtualMemorySize,
PeakWorkingSet, SessionId, Threads, TotalProcessorTime,
VirtualMemorySize, WorkingSet, CPU, Path
Note
The order of the properties in the comma-separated list determines the display order. If
you want to change the display order, simply move the property to a different position in
the list.
When you know the process you want to examine, you don’t need to use this multistep
procedure. Simply enter the name of the process without the .exe or .dll instead of
using -inputobject $a. In this example, you list details about the explorer process:
get-process explorer | format-table –property ProcessName, BasePriority,
HandleCount, Id, NonpagedSystemMemorySize, PagedSystemMemorySize,
PeakPagedMemorySize, PeakVirtualMemorySize, PeakWorkingSet, SessionId,
Threads, TotalProcessorTime, VirtualMemorySize, WorkingSet, CPU, Path
You can enter part of a process name as well using an asterisk as a wildcard to match
a partial name. In this example, get-process lists any process with a name that starts
with exp:
get-process exp* | format-table –property ProcessName, BasePriority,
HandleCount, Id, NonpagedSystemMemorySize, PagedSystemMemorySize,
PeakPagedMemorySize, PeakVirtualMemorySize, PeakWorkingSet, SessionId,
Threads, TotalProcessorTime, VirtualMemorySize, WorkingSet, CPU, Path
Some interesting additional properties you can use with get-process include:
MinWorkingSet
The minimum amount of working set memory used by the
process
Modules
The executables and dynamically linked libraries used by the process
PeakVirtualMemorySize
The peak amount of virtual memory used by the process
Note
The order of the properties in the comma-separated list determines the display order. If
you want to change the display order, simply move the property to a different position in
the list.
Tracking a System’s General Health 319
Chapter 11
Please purchase PDF Split-Merge on www.verypdf.com to remove this watermark.
PriorityBoostEnabled
A Boolean value that indicates whether the process has the
PriorityBoost feature enabled
PriorityClass
The priority class of the process
PrivilegedProcessorTime
The amount of kernel-mode usage time for the process
ProcessorAffi nity
The processor affi nity setting for the process
Responding
A Boolean value that indicates whether the process responded when
tested
StartTime
The date and time the process was started
UserProcessorTime
The amount of user-mode usage time for the process
Description
A description of the process
FileVersion
The fi le version of the process’s executable
In Task Manager, you can stop processes that you suspect aren’t running properly. To
do this, right-click the process, and choose End Process to stop the process or End
Process Tree to stop the process as well as any other processes it started. To stop a pro-
cess at the Windows PowerShell prompt, you can use stop-process. The best way to use
stop-process is to identity the process ID of the process that you want to stop rather
than a process name. This ensures that you stop only the intended process rather than
all instances of processes with a particular process name. You should also have stop-
process prompt you to confi rm how you want to proceed using the -confi rm parameter.
In the following example, you stop the process with the process ID 4524:
stop-process –id 4524 –confi rm
As you are confi rming this action and passing through the output, you’ll see a prompt
asking you to confi rm. You can then:
Press Y to answer Yes and confi rm that you want to perform the action and
continue.
Press A to answer Yes to all prompts and confi rm that you want to perform all
actions without further prompting.
Press N to answer No and skip the action and continue to the next action.
Press L to answer No to all prompts and confi rm that you do not want to perform
any actions.
Press N to answer No and confi rm that you do not want to perform the action.
Press S to suspend the pipeline and return to the command prompt. To later
return to the pipeline, type exit.
Chapter 11
320 Chapter 11 Performance Monitoring and Tuning
Please purchase PDF Split-Merge on www.verypdf.com to remove this watermark.
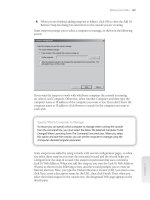
Monitoring and Troubleshooting Services
You can view information about services running on a system by using the Services
tab of Task Manager or by running get-service. By default, the Services tab shows all
services confi gured on the system whether they are running, stopped, or in a different
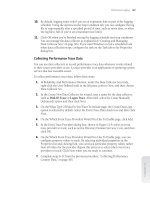
state. As shown in Figure 11-8, services are listed by name, process ID (PID), descrip-
tion, status, and group.
Figure 11-8 The Services tab provides detailed information on configured services.
As multiple services typically run under the same process ID, you can quickly sort ser-
vices by their associated process ID by clicking the related column heading. You can
click the Status column heading to sort services according to their status as Running
or Stopped. If you right-click a service’s listing in Task Manager, you display a short-
cut menu that allows you to start a stopped service, stop a started service, or go to the
related process on the Processes tab.
The Group column provides additional information about related identities or service
host contexts under which a service runs. Services running an identity with a restric-
tion have the restriction appended. For example, a service running under the Local Ser-
vice identity may be listed as LocalServiceNoNetwork to indicate that the service has
no network access, or as LocalSystemNetworkRestricted to indicate that the service has
restricted access to the network.
Services that have svchost.exe list their associated context for the -k parameter. For
example, the RemoteRegistry service runs with the command line svchost.exe -k regsvc
and you’ll see an entry of regsvc in the Group column for this service.
At a Windows PowerShell prompt, you can get the status of confi gured services simply
by entering get-service. By default, only the service status, internal name, and display
name are shown. Additional properties that you can display include:
CanPauseAndContinue
Indicates whether the service can be paused and resumed
CanStop
Indicates whether you can stop the service
Tracking a System’s General Health 321
Chapter 11
Please purchase PDF Split-Merge on www.verypdf.com to remove this watermark.
DependentServices
Lists the services that depend on this service
ServicesDependedOn
Lists the services on which this service depends
At a Windows PowerShell prompt, you can get the available details for all services by
following these steps:
1. Get all the services running on the server and store them in the $a variable by
entering:
$a = get-service
2. Use the InputObject parameter to pass the service objects stored in $a to get-
service and then pass the objects to the format-table cmdlet along with the list of
properties you want to see by entering:
get-service -inputobject $a | format-table –property Name, DisplayName,
CanPauseAndContinue, CanStop, DependentServices, ServicesDependedOn, Status
When you know the service you want to examine, you don’t need to use this multistep
procedure. Simply enter the internal name of the process instead of using -inputobject
$a. In this example, you list details about the TermService process:
get-service TermService | format-table –property Name, DisplayName,
CanPauseAndContinue, CanStop, DependentServices, ServicesDependedOn, Status
You can enter part of a service name as well using an asterisk as a wildcard to match a
partial name. In this example, get-service lists any service with a name that starts with
term:
get-service Term* | format-table –property Name, DisplayName,
CanPauseAndContinue, CanStop, DependentServices, ServicesDependedOn, Status
To list services by display name, use the -displayname parameter and enclose the dis-
play name in quotation marks, such as:
get-service –displayname "Terminal Services" | format-table –property Name,
DisplayName, CanPauseAndContinue, CanStop, DependentServices,
ServicesDependedOn, Status
You can use the following cmdlets to manage services:
Suspend-Service
Pauses a service
Resume-Service
Resumes a paused service
Start-Service
Starts a stopped service
Stop-Service
Stops a started service
Restart-Service
Stops and then starts a service
Typically, you’ll use Restart-Service when you suspect a service is having a problem and
you want to reset it.
Chapter 11
322 Chapter 11 Performance Monitoring and Tuning
Please purchase PDF Split-Merge on www.verypdf.com to remove this watermark.
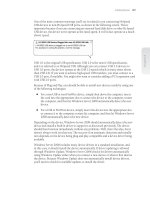
Getting Network Usage Information
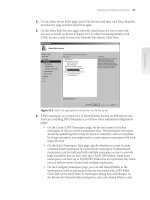
As Figure 11-9 shows, the Networking tab in Task Manager displays current network
usage for each of the system’s connections to the network.
Figure 11-9 Use the Networking tab to track network activity.
You can use the information provided to determine the following quickly:
The number of network adapters installed on the computer
The percentage of utilization of each network adapter
The link speed of each network adapter
The state of each network adapter
The network activity graph shows traffi c going to and from the computer as well as how
much of the network capacity is in use. If a system has one network adapter, the graph
details network traffi c on this adapter over time. If a system has multiple network adapt-
ers, the graph displays a composite index of all network connections, which represents
all network traffi c.
TROUBLESHOOTING
Get separate views of bytes received and sent for troubleshooting
For troubleshooting, it is sometimes useful to have separate views of traffi c going to the
computer (Bytes Received) and traffi c going from the computer (Bytes Sent). To do this,
click View, choose Network Adapter History, and then select Bytes Sent. Then click View,
choose Network Adapter History, and then select Bytes Received. Afterward, Bytes Sent
are shown in red, Bytes Received in yellow, and Bytes Total in green.
OU S OO G
Tracking a System’s General Health 323
Chapter 11
Please purchase PDF Split-Merge on www.verypdf.com to remove this watermark.
You can also get more detailed information for each adapter. This information is use-
ful for troubleshooting. If you click View and choose Select Columns, you’ll see a dia-
log box that will let you add columns for summary statistics to the Networking tab.
Table 11-2 summarizes the key network statistics available.
Table 11-2 Network Statistics and How They Can Be Used
Column Name Description
Bytes Sent Throughput Shows percentage of current connection bandwidth used by
traffi c sent from the system.
Bytes Received
Throughput
Shows percentage of current connection bandwidth used by
traffi c received by the system.
Bytes Throughput Shows percentage of current connection bandwidth used for all
traffi c on the network adapter. If this shows 50 percent or more
utilization consistently, you’ll want to monitor the system more
closely and consider adding network adapters.
Bytes Sent Shows cumulative total bytes sent on the connection since the
system booted.
Bytes Received Shows cumulative total bytes received on the connection since
the system booted.
Bytes Shows cumulative total bytes on the connection since the
system booted.
Unicasts Shows cumulative number of unicast packets received or sent
since the system booted.
Unicasts Sent Shows total packets sent by unicast since the system booted.
Unicasts Received Shows total packets received by unicast since the system
booted.
Nonunicasts Shows total number of broadcast packets sent or received since
the system booted. Too much broadcast traffi c on the network
can be an indicator of networking problems. If you see a lot
of nonunicast traffi c, monitor the amount received during the
refresh interval.
Nonunicasts Sent Shows total broadcast packets sent since the system booted.
Nonunicasts Received Shows total broadcast packets received since the system booted.
Getting Information on User and Remote User Sessions
Members of the Administrators group and any users to which you specifi cally grant
remote access can connect to systems using Terminal Services or Remote Desktop Con-
nection. Both techniques allow users to access systems remotely and use the systems
as if they were sitting at the keyboard. In the standard confi guration, however, remote
access is disabled. You can enable the remote access feature by using the System utility
in Control Panel, System And Maintenance. Open the System Properties dialog box by
Chapter 11
324 Chapter 11 Performance Monitoring and Tuning
Please purchase PDF Split-Merge on www.verypdf.com to remove this watermark.
clicking Advanced System Settings, and then click the Remote tab. In the Remote Desk-
top panel, select one of the following options and then click OK:
Allow Connections From Computers Running Any Version Of Remote Desktop
(Less Secure)
Allow Connections Only From Computers Running Remote Desktop With Net-
work Level Authentication (More Secure)
NOTE
Windows Vista, Windows Server 2008, and later releases of Windows have Network Level
Authentication. Most earlier releases of Windows do not.
With Remote Desktop, Windows Server 2008 allows one console session and two
remote administration sessions. Most remote sessions are created as console sessions.
The reason for this is that the console session provides full functionality for adminis-
tration. If you log on locally to the console and someone is logged on remotely to the
console, you will be prompted to end his or her user session so that you can log on. If
you click Yes, the user’s session is disconnected, halting all user-started applications
without saving application data. If you click No, you will not be allowed to log on. See
Chapter 19, “Using Remote Desktop for Administration,” for details on how you can use
Remote Desktop to confi gure remote sessions for administration rather than console
sessions.
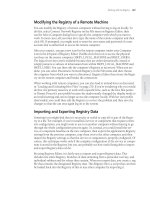
If you confi gure a server by using Terminal Services, multiple users can log on to a
system up to the maximum allowed by licensing. To keep track of sessions after you’ve
confi gured Terminal Services, you can use the Users tab of Task Manager. As shown in
Figure 11-10, the Users tab lists user connections according to the following factors:
User
The pre–Windows 2000 logon name of the user account, such as Wrstanek
or Administrator. If you want to see the logon domain as well as the logon name,
select Show Full Account Name on the Options menu.
ID
The session ID. All user connections have a unique session ID. The session ID
for any user logged on locally is 0.
Status
The status of the connection (Active or Disconnected).
Client Name
The name of the computer from which the user is connecting. This
fi eld is blank for console sessions.
Session
The type of session. Console is used for users logged on locally. Oth-
erwise, indicates the connection type and protocol, such as RDP-TCP for a con-
nection using the Remote Desktop Protocol (RDP) with Transmission Control
Protocol (TCP) as the transport protocol.
NOTE
Windows Vista, Windows Server 2008, and later releases of Windows have Network Level
Authentication. Most earlier releases of Windows do not.
Tracking a System’s General Health 325
Chapter 11
Please purchase PDF Split-Merge on www.verypdf.com to remove this watermark.
Figure 11-10 Use the Users tab to track and manage remote user sessions.
The Users tab can help you determine who is logged on and whether that user’s status
is either Active or Inactive. Right-click an active session and you can choose Send Mes-
sage to send a console message to the user. This message is displayed on the screen of
that user’s session.
If you must end a user session, you can do this in one of two ways. Right-clicking the
session and choosing Log Off logs the user off using the normal logoff process. This
allows application data and system state information to be saved as during a normal
logoff. Right-clicking the session and choosing Disconnect forcibly ends a user’s session
without saving application data or system state information.
You can also connect to an inactive session. Right-click the inactive session, and then
choose Connect. When prompted, provide the user’s password.
Finally, by default the shortcut keys used to end a remote control session are Ctrl+*
(Ctrl+Shift+8). If you want a session to use different shortcut keys, right-click the ses-
sion you want to work with, and then select Remote Control. You can then set the short-
cut keys to end the remote control session.
Tracking Events and Troubleshooting
by Using Event Viewer
The Windows operating system defi nes an event as any signifi cant occurrence in the
operating system or an application that should be recorded for tracking purposes.
Informational events can be tracked as well as events that record warnings, errors, and
auditing. Critical errors that deserve immediate attention, such as when the server has
run out of disk space or memory, are recorded in the logs and displayed on screen.
Chapter 11
326 Chapter 11 Performance Monitoring and Tuning
Please purchase PDF Split-Merge on www.verypdf.com to remove this watermark.
Understanding the Event Logs
The Windows service that controls event logging is the Event Log service. When this
service is started, events are recorded in one of the available event logs. Two general
types of log fi les are used:
Windows logs
Logs that the operating system uses to record general system events
related to applications, security, setup, and system components.
Applications and Services logs
Logs that specifi c applications and services use to
record application-specifi c or service-specifi c events.
Windows logs you’ll see include:
Application
Contains events logged by applications. You’ll fi nd events in this log
for Microsoft Exchange Server, SQL Server, Internet Information Services (IIS),
and other installed applications. It is also used to record events from printers and,
if you’ve confi gured alert logging, alerts. The default location is %SystemRoot%\
System32\Winevt\Logs\Application.evtx. The default log size is 20480 MB.
Forwarded Events
When you confi gure event forwarding, this log records for-
warded events from other servers. The default location is %SystemRoot%\Sys-
tem32\Confi g\FordwardedEvents.evtx. The default log size is 20480 MB.
Security
Contains events you’ve set for auditing with local or global group poli-
cies. Depending on the auditing confi guration, you’ll fi nd events for logon, logoff,
privilege use, and shutdown, as well as general system events, such as the loading
of the authentication package by the Local Security Authority (LSA). The default
location is %SystemRoot%\System32\Winevt\Logs\Security.evtx. The default log
size is 131072 MB on domain controllers and 20480 MB on member servers.
Note
Only administrators are granted access to the Security log by default. If other users need
to access the Security log, you must specifi cally grant them the Manage Auditing and the
Security Log user rights. You can learn more about assigning user rights in Chapter 35,
“Managing Users, Groups, and Computers.”
Setup
This log records events logged by the operating system or its components
during setup and installation. The default location is %SystemRoot%\System32\
Winevt\Logs\Setup.evtx. The default log size is 1028 MB.
System
Contains events logged by Windows Server 2008 and its components.
You should routinely check this log for warnings and errors, especially those
related to the failure of a service to start at bootup or the improper confi guration
of a service. The default location is %SystemRoot%\System32\Winevt\Logs\Sys-
tem.evtx. The default log size is 20480 MB.
Note
Only administrators are granted access to the Security log by default. If other users need
to access the Security log, you must specifi cally grant them the Manage Auditing and the
Security Log user rights. You can learn more about assigning user rights in Chapter 35,
“Managing Users, Groups, and Computers.”
Tracking Events and Troubleshooting by Using Event Viewer 327
Chapter 11
Please purchase PDF Split-Merge on www.verypdf.com to remove this watermark.
Applications and Services logs you’ll see include:
DFS Replication
This log records distributed fi le system (DFS) replication activi-
ties. The default location is %SystemRoot%\System32\Winevt\Logs\DfsReplica-
tion.evtx. The default log size is 15168 MB.
Directory Service
Contains events logged by Active Directory. The primary events
relate to the Active Directory database and global catalogs. You’ll fi nd details on
database consistency checks, online defragmentation, and updates. The default
location is %SystemRoot%\System32\Winevt\Logs\Directory Service.evtx.
DNS Server
Contains Domain Name System (DNS) queries, responses, and other
DNS activities. You might also fi nd details on activities that relate to DNS integra-
tion with Active Directory. The default location is %SystemRoot%\System32\
Winevt\Logs\DNS Server.evtx. The default log size is 16384 MB.
File Replication Service
Contains events logged by the File Replication Service,
a service used to replicate Active Directory changes to other domain control-
lers. You’ll fi nd details on any important events that took place while a domain
controller attempted to update other domain controllers. The default location
is %SystemRoot%\System32\Winevt\Logs\File Replication Service.evtx. The
default log size is 20480 MB.
Hardware Events
When hardware subsystem event reporting is confi gured, this
log records hardware events reported to the operating system. The default loca-
tion is %SystemRoot%\System32\Confi g\HardwareEvents.evtx. The default log
size is 20480 MB.
Microsoft\Windows
Logs that track events related to specifi c Windows ser-
vices and features. Logs are organized by component type and event category.
Operational logs track events generated by the standard operations of the related
component. In some cases, you’ll see supplemental logs for analysis, debugging,
and recording administration-related tasks. Most of the related logs have a fi xed
default log size of 1028 MB.
By default, the logs are sized as appropriate for the type of system you are working with
and its confi guration. In a standard confi guration of Windows Server 2008, most logs
are sized as listed previously. As shown, most logs have a fairly large maximum size.
This includes the DNS Server, System, and Application logs. Because they are less criti-
cal, the Directory Service and File Replication Service logs on domain controllers have
a maximum size of 1028 MB. Because the Security log is so important, it is usually con-
fi gured with a maximum size of 131072 MB on domain controllers and 20480 MB on
member servers. Primarily, this is to allow the server to record a complete security audit
trail for situations in which the server is under attack and a large number of security
events are generated.
Windows Server 2008 logs are confi gured to overwrite old events as needed by default.
So, when the log reaches its maximum size, the operating system overwrites old events
with new events. If desired, you can have Windows automatically archive logs. In this
confi guration, when the maximum fi le size is reached, Windows archives the events by
Chapter 11
328 Chapter 11 Performance Monitoring and Tuning
Please purchase PDF Split-Merge on www.verypdf.com to remove this watermark.
saving a copy of the current log in the default directory. Windows then creates a new
log for storing current events.
You can also confi gure logs so that Windows never overwrites events. However, the
problem with doing it that way is, when the maximum size is reached, events can’t be
overwritten and the system will generate an error message telling you that such and
such an event log is full each time it tries to write an event—and you can quickly get to
where there are dozens of these errors being displayed.
Note
You can control the log confi guration through Group Policy as well. This means changes
you make in Group Policy could in turn change the maximum log size and which action
to take when the maximum log size is reached. For more information about Group Policy,
see Chapter 36, “Managing Group Policy.”
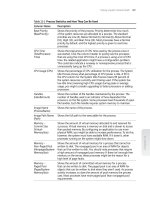
Accessing the Event Logs and Viewing Events
You can view the event logs using Event Viewer, as shown in Figure 11-11. Event Viewer
is a Microsoft Management Console (MMC) snap-in that can be started from the
Administrative Tools menu or by typing eventvwr at the command line.
Event Viewer has custom views as well as standard views of logs. Using the custom
Administrative Events view, you can view all errors and warnings for all logs. Using
your own custom views, you can create views to surface particular types and categories
of events from any logs you want to track. You can also access event logs directly to
view all the events they contain.
You can use the following techniques to work with logs and custom views:
To view all errors and warnings for all logs, expand Custom Views and then select
Administrative Events. In the main pane, you should see a list of all warning and
error events for the server.
To view all errors and warnings for a specifi c server role, expand Custom Views,
expand Server Roles, and then select the role to view. In the main pane, you
should now see a list of all events for the selected role.
To view summary information for Windows logs, select the Windows Logs node.
You’ll then see a list of available logs by name and type along with the number of
events and log size.
To view summary information for Applications and Services logs, select the Appli-
cations And Services Logs node. You’ll then see a list of available logs by name
and type along with the number of events and log size.
Note
You can control the log confi guration through Group Policy as well. This means changes
you make in Group Policy could in turn change the maximum log size and which action
to take when the maximum log size is reached. For more information about Group Policy,
see Chapter 36, “Managing Group Policy.”
Tracking Events and Troubleshooting by Using Event Viewer 329
Chapter 11
Please purchase PDF Split-Merge on www.verypdf.com to remove this watermark.
To view events in a specifi c log, expand the Windows Logs node, the Applications
And Services Logs node, or both nodes. Select the log you want to view, such as
Application or System.
Figure 11-11 The main view in Event Viewer lists the available logs and shows their current size.
As Figure 11-12 shows, individual event entries provide an overview of the event that
took place. Each event is recorded according to the date and time the event took place
as well as the event level. For all the logs except Security, the event levels are classifi ed
as Information, Warning, or Error. For the Security log, the event levels are classifi ed as
Audit Success or Audit Failure. These event levels have the following meanings:
Information
Generally relates to a successful action, such as the success of a
service starting up. If you’ve confi gured alert logging, the alerts are also recorded
with this event type to show they’ve been triggered.
Warning
Describes events that aren’t critical but could be useful in prevent-
ing future system problems. Most warnings should be examined to determine
whether a preventative measure should be taken.
Error
Indicates a fatal error or signifi cant problem occurred, such as the failure
of a service to start. All errors should be examined to determine what corrective
measure should be taken to prevent the error from reoccurring.
Audit Success
Describes an audited security event that completed as requested,
such as when a user logs on or logs off successfully.
Audit Failure
Describes an audited security event that didn’t complete as
requested, such as when a user tries to log on and fails. Audit failure events can
be useful in tracking down security issues.
Chapter 11
330 Chapter 11 Performance Monitoring and Tuning
Please purchase PDF Split-Merge on www.verypdf.com to remove this watermark.
Figure 11-12 Events are logged according to the date and time they occurred as well as by type.
Note
Any attempt by users, services, or applications to perform a task for which they don’t
have appropriate permissions can be recorded as an audit failure. If someone is trying
to break into a system, you might see a large number of audit failure events. If a service
or application doesn’t have the permissions it needs to perform certain tasks, you might
also see a large number of audit failure events.
Other pertinent information recorded with an event includes the event source, event
ID, task category, user, and computer. The Source column lists the application, service,
or component that logged the event. The Task Category column details the category of
the event and is sometimes used to further describe the event. The Event ID column
provides an identifi er for the specifi c event that occurred. You can sometimes look up
events in the Microsoft Knowledge Base to get more detailed information.
When you select an event, Event Viewer shows additional details in the lower pane,
including a general description of the event and other fi elds of information. The User
fi eld shows the name of the user who was logged on when the event occurred (if
applicable). If a server process triggered the event, the user name usually is that of the
special identity that caused the event. This includes the special identities Anonymous
Logon, Local Service, Network Service, and System. Although events can have no user
associated with them, they can also be associated with a specifi c user who was logged
on at the time the event occurred.
Note
Any attempt by users, services, or applications to perform a task for which they don’t
have appropriate permissions can be recorded as an audit failure. If someone is trying
to break into a system, you might see a large number of audit failure events. If a service
or application doesn’t have the permissions it needs to perform certain tasks, you might
also see a large number of audit failure events.
Tracking Events and Troubleshooting by Using Event Viewer 331
Chapter 11
Please purchase PDF Split-Merge on www.verypdf.com to remove this watermark.
The Computer fi eld shows the name of the computer that caused the event to occur.
Because you are working with a log from a particular computer, this is usually the
account name of that computer. However, this is not always the case. Some events
can be triggered because of other computers on the network. Some events triggered
by the local machine are stored with the computer name as MACHINENAME. For
some events, any binary data or error code generated by the event is available on the
Details tab.
You can double-click any event to open its Properties dialog box (see Figure 11-13). The
Properties dialog box provides the information that is available in the details pane as
well as an option to copy the event data to the Clipboard. Most of the event descrip-
tions aren’t easy to understand, so if you need a little help deciphering the event, click
Copy. You can then paste the event description into an e-mail message to another
administrator.
Figure 11-13 Event details include a description of the event and in some cases binary data
generated by the event.
Note
Within every event description is a Help And Support Center link that you can click. This
link provides access to the Microsoft Web site where you can query for any additional
information that might be available on the event.
Note
Within every event description is a Help And Support Center link that you can click. This
link provides access to the Microsoft Web site where you can query for any additional
information that might be available on the event.
Chapter 11
332 Chapter 11 Performance Monitoring and Tuning
Please purchase PDF Split-Merge on www.verypdf.com to remove this watermark.
Viewing Event Logs on Remote Systems
You can use Event Viewer to view events on other computers on your network. Start
Event Viewer, right-click Event Viewer (Local) in the left pane, and then choose Con-
nect To Another Computer. In the Select Computer dialog box, shown in Figure 11-14,
type the domain name or Internet Protocol (IP) address of the computer for which you
want to view the event log and then click OK. Or you can click Browse to search for the
computer you want to use. If you need to specify logon credentials, select the Connect
As Another User check box and then click the Set User button. Afterward, type the user
name and password to use for logon, and then click OK.
Note
Keep in mind that you must be logged on as an administrator or be a member of the
Administrators group to view events on a remote computer. You must also confi gure
Windows Firewall on the local computer to allow your outbound connection and the
remote computer to allow your inbound connection.
Figure 11-14 Connect to a remote computer.
Sorting, Finding, and Filtering Events
Event Viewer provides several ways for you to organize and search for events in the
logs. You can sort events based on date or other stored information. You can search a
particular event log for specifi c events and view events one at a time. You can also fi lter
events so that only the specifi c events you want to see are shown.
Note
Keep in mind that you must be logged on as an administrator or be a member of the
Administrators group to view events on a remote computer. You must also confi gure
Windows Firewall on the local computer to allow your outbound connection and the
remote computer to allow your inbound connection.
Tracking Events and Troubleshooting by Using Event Viewer 333
Chapter 11
Please purchase PDF Split-Merge on www.verypdf.com to remove this watermark.
Sorting the Event Logs
By default, logs are sorted so that the newest events are listed fi rst. If you’d rather see
the oldest events fi rst, you can do this by clicking View, pointing to Sort By, and then
selecting Date And Time. Or you can simply click the Date And Time column header.
This change must be made for each log in which you want to see the oldest events fi rst.
You can also sort events based on information in other columns. For example, if you
wanted to sort the events based on the event level, you would click the Level column
header.
Searching the Event Logs
By using the Find feature, you can search for events within a selected log and view
matching events one at a time. Say, for instance, a Microsoft Knowledge Base article says
to look for an event with such and such an event source and you want to search for it
quickly. You can use the Find feature to do this.
To search, right-click an event log and select Find. In the Find dialog box, type the
search text to match and then click Find Next. The fi rst event that matches the search
criteria is highlighted in the log. You can double-click the event to get more detailed
information or click Find Next to fi nd the next match.
Filtering the Event Logs
The Find option works well if you want to perform quick searches, such as for a single
event of a specifi c type. If you want to perform an extended search, however, such as
when you want to review all events of a particular type, there’s a better way to do it and
that’s to create a fi ltered view so that only the specifi c events you want to see are shown.
Windows creates several fi ltered views of the event logs for you automatically. In Event
Viewer, fi ltered views are listed under the Custom Views node. When you select the
Administrative Events node, you’ll see a list of all errors and warnings for all logs. When
you expand the Server Roles node and then select a role-specifi c view, you’ll see a list of
all events for the selected role.
You can create and work with fi ltered views in several different ways. You can:
Create a custom view by fi ltering the events in a specifi c log and saving this fi l-
tered view for later use. Simply right-click the log and select Create Custom View.
This displays the Create Custom View dialog box, as shown in the following
screen. Choose the fi lter options you want to use, as described in Table 11-3, and
then click OK. In the Save Filter To Custom View dialog box, type a name and
description for the view. Select where to save the custom view. By default, custom
views are saved under the Custom Views node. You can create a new node by
clicking New Folder, entering the name of the new folder, and then clicking OK.
Click OK to close the Save Filter To Custom View dialog box.
Chapter 11
334 Chapter 11 Performance Monitoring and Tuning
Please purchase PDF Split-Merge on www.verypdf.com to remove this watermark.
Create a temporary view by fi ltering the events in a specifi c log. Simply select
the log and then right-click and select Filter Current Log. This displays the Fil-
ter Current Log dialog box, as shown in the following screen. Choose the fi lter
options you want to use, as described in Table 11-3, and then click OK. After
you’ve applied the fi lter, only events with the options you specify are displayed in
the selected event log. For the rest of the current Event Viewer session, the fi lter
is applied to the selected log and you know this because the upper portion of the
main pane shows you are working with a fi ltered log.
Tracking Events and Troubleshooting by Using Event Viewer 335
Chapter 11
Please purchase PDF Split-Merge on www.verypdf.com to remove this watermark.
Set Filter Options
You can set as many fi lter options as you want to narrow the results. Keep in mind, how-
ever, that each fi lter option you apply sets a search criterion that must be matched for an
event to be displayed. The options are cumulative so that an event must match all fi lter
options.
Table 11-3
Find and Filter Options for Event Logging
Option Description
Computer Includes all events associated with a particular computer. Usually this is
the name of the computer whose logs you are working with.
Event ID Includes or excludes events with the event IDs you specify. Enter ID
numbers or ID ranges separated by commas. To exclude an event,
enter a minus sign before the event ID.
Event Level Allows you to include or exclude events by level. The most important
event levels are warnings, which indicate that something might pose
a future problem and might need to be examined, and errors, which
indicate a fatal error or signifi cant problem occurred.
Event Sources Includes events only from specifi ed sources, such as an application,
service, or component that logged the event.
Event Logs Includes events only from specifi ed logs. When working with a custom
log view, the log you right-clicked is selected automatically and you
can’t choose additional logs.
Logged With fi lters, all events from the fi rst to the last are displayed by default.
You can choose to include events from the Last Hour, Last 12 Hours,
Last 24 Hours, Last 7 Days, Last 30 Days, or a custom range.
Task Category Includes events only within a given category. The categories available
change based on the event source you choose.
User Includes events associated with a particular user account that was
logged on when the event was triggered. Server processes can log
events with the special identities Anonymous Logon, Local Service,
Network Service, and System. Not all events have a user associated
with them.
You can apply a fi lter to a custom view as well as to a log. To fi lter a custom view, right-
click the view and then select Filter Current Custom View. Choose the fi lter options
you want to use and then click OK. For the rest of the current Event Viewer session, the
fi lter is applied to the selected view and you know this because the upper portion of the
main pane shows you are working with a fi ltered view.
If you later want to clear a fi lter that is applied to a view or log, right-click the log and
select Clear Filter. Another option is to save the fi ltered view as a custom view so you
Set Filter Options
You can set as many fi lter options as you want to narrow the results. Keep in mind, how-
ever, that each fi lter option you apply sets a search criterion that must be matched for an
event to be displayed. The options are cumulative so that an event must match all fi lter
options.
Chapter 11
336 Chapter 11 Performance Monitoring and Tuning
Please purchase PDF Split-Merge on www.verypdf.com to remove this watermark.