Windows Server 2008 Inside Out- P9
Bạn đang xem bản rút gọn của tài liệu. Xem và tải ngay bản đầy đủ của tài liệu tại đây (1.35 MB, 50 trang )
10. By default, logging stops only if you set an expiration date as part of the logging
schedule. Using the options on the Stop Condition tab, you can confi gure the log
fi le to stop manually after a specifi ed period of time, such as seven days, or when
the log fi le is full (if you’ve set a maximum size limit).
11. Click OK when you’ve fi nished setting the logging schedule and stop conditions.
You can manage the data collector as explained in “Creating and Managing
Data Collector Sets” on page 364. If you want Windows to run a scheduled task
when data collection stops, confi gure the task on the Task tab in the Properties
dialog box.
Collecting Performance Trace Data
You can use data collectors to record performance trace data whenever events related
to their source providers occur. A source provider is an application or operating system
service that has traceable events.
To collect performance trace data, follow these steps:
1. In Reliability And Performance Monitor, under the Data Collector Sets node,
right-click the User Defi ned node in the left pane, point to New, and then choose
Data Collector Set.
2. In the Create New Data Collector Set wizard, type a name for the data collector,
such as Disk IO Trace or Logon Trace. Afterward, select the Create Manually
(Advanced) option and then click Next.
3. On the What Type Of Data Do You Want To Include page, the Create Data Logs
option is selected by default. Select the Event Trace Data check box and then click
Next.
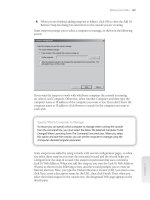
4. On the Which Event Trace Providers Would You Like To Enable page, click Add.
5. In the Event Trace Providers dialog box, shown in Figure 12-9, select an event
trace provider to track, such as Active Directory Domain Services: Core, and then
click OK.
6. On the Which Event Trace Providers Would You Like To Enable page, you can
confi gure property values to track. By selecting individual properties in the
Properties list and clicking Edit, you can track particular property values rather
than all values for the provider. Repeat this process to select other event trace
providers to track. Click Next when you are ready to continue.
7. Complete steps 6–11 from the previous procedure, “Collecting Performance
Counter Data,” on page 365.
Performance Logging 367
Chapter 12
Please purchase PDF Split-Merge on www.verypdf.com to remove this watermark.
Figure 12-9 Select a provider to trace.
Collecting Confi guration Data
You can use data collectors to record changes in Registry confi guration. To collect con-
fi guration data, follow these steps:
1. In Reliability And Performance Monitor, under the Data Collector Sets node,
right-click the User Defi ned node in the left pane, point to New, and then choose
Data Collector Set.
2. In the Create New Data Collector Set wizard, type a name for the data collector,
such as System Registry Info or Current User Registry Info. Afterward, select
the Create Manually (Advanced) option and then click Next.
3. On the What Type Of Data Do You Want To Include page, the Create Data Logs
option is selected by default. Select the System Confi guration Information check
box and then click Next.
4. On the Which Registry Keys Would You Like To Record page, click Add. Type the
Registry path to track. Repeat this process to add other Registry paths to track.
Click Next when you are ready to continue.
5. Complete steps 6–11 from the earlier procedure, “Collecting Performance Counter
Data,” on page 365.
Viewing Data Collector Reports
When you’re troubleshooting problems, you’ll often want to log performance data over
an extended period of time and then review the data to analyze the results. For each
data collector that has been or is currently active, you’ll fi nd related data collector
reports. As with data collector sets themselves, data collector reports are usually orga-
nized into two general categories: user-defi ned and system.
Chapter 12
368 Chapter 12 Comprehensive Performance Analysis and Logging
Please purchase PDF Split-Merge on www.verypdf.com to remove this watermark.
To view data collector reports in Reliability And Performance Monitor, expand the
Reports node and then expand the individual report node for the data collector you
want to analyze. Under the data collector’s report node, you’ll fi nd individual reports
for each logging session. A logging session begins when logging starts and ends when
logging is stopped.
The most recent log is the one with the highest log number. To view a log and analyze
its related data graphically, double-click it. Keep in mind that if a data collector is
actively logging, you won’t be able to view the most recent log. You can stop collecting
data by right-clicking a data collector set and selecting Stop. Collected data is shown
by default in a graph view from the start of data collection to the end of data collection.
Only counters that you selected for logging will be available. If a report doesn’t have a
counter that you want to work with, you’ll need to modify the data collector properties,
restart the logging process, and then check the logs again.
You can modify the report details using the following techniques:
1. In Reliability And Performance Monitor, right-click the Performance Monitor
node and then select Properties. In the Performance Monitor Properties dialog
box, click the Source tab.
2. Specify data sources to analyze. Under Data Source, select Log Files and then
click Add to open the Select Log File dialog box. You can now select an additional
log fi le to analyze.
3. Specify the time window that you want to analyze. Click Time Range, and then
drag the Total Range bar to specify the appropriate starting and ending times.
Drag the left edge to the right to move up the start time. Drag the right edge to the
left to move down the end time.
4. Click the Data tab. You can now select counters to view. Select a counter and then
click Remove to remove it from the graph view. Click Add to display the Add
Counters dialog box, which you can use to select the counters that you want to
analyze.
5. Click OK. In the monitor pane, click the Change Graph Type button to select the
type of graphing.
Confi guring Performance Counter Alerts
You can confi gure alerts to notify you when certain events occur or when certain per-
formance thresholds are reached. You can send these alerts as network messages and as
events that are logged in the application event log. You can also confi gure alerts to start
applications and performance logs.
To confi gure an alert, follow these steps:
1. In Reliability And Performance Monitor, under the Data Collector Sets node,
right-click the User Defi ned node in the left pane, point to New, and then choose
Data Collector Set.
Performance Logging 369
Chapter 12
Please purchase PDF Split-Merge on www.verypdf.com to remove this watermark.
2. In the Create New Data Collector Set wizard, type a name for the data collector,
such as Memory Alert or Full Disk Alert. Afterward, select the Create Manually
(Advanced) option and then click Next.
3. On the What Type Of Data Do You Want To Include page, select the Performance
Counter Alert option and then click Next.
4. On the Which Performance Counters Would You Like To Monitor page, click Add
to display the Add Counters dialog box. This dialog box is identical to the Add
Counters dialog box discussed previously. Use the Add Counters dialog box to
add counters that trigger the alert. Click OK when you’re fi nished.
5. In the Performance Counters panel, select the fi rst counter and then use the Alert
When text box to set the occasion when an alert for this counter is triggered.
Alerts can be triggered when the counter is above or below a specifi c value.
Select Above or Below, and then set the trigger value. The unit of measurement is
whatever makes sense for the currently selected counter(s). For example, to alert
if processor time is over 95 percent, you would select Over and then type 95.
Repeat this process to confi gure other counters you’ve selected.
6. Complete steps 7–11 from the earlier procedure, “Collecting Performance Counter
Data,” on page 365.
Monitoring Performance from the Command Line
Windows Server 2008 includes a command-line utility called Typeperf for writing per-
formance data to the command line. You can use it to monitor the performance of both
local and remote computers. The available parameters for Typeperf are summarized in
Table 12-2.
Table 12-2 Parameters for Typeperf
Parameter Description
-cf <fi lename> Specifi es a fi le containing a list of performance counters to
monitor.
-confi g <fi lename> Specifi es the settings fi le containing command options.
-f <CSV|TSV|BIN|SQL> Sets the output fi le format. The default is .csv for comma-
separated values.
-o <fi lename> Sets the path of an output fi le or SQL database.
-q [object] Lists installed counters for the specifi ed object.
-qx [object] Lists installed counters with instances.
-s <ComputerName> Sets the server to monitor if no server is specifi ed in the
counter path.
-sc <samples> Sets the number of samples to collect.
-si <[[hh:]mm:]ss> Sets the time between samples. The default is 1 second.
-y Answers Yes to all questions without prompting.
Chapter 12
370 Chapter 12 Comprehensive Performance Analysis and Logging
Please purchase PDF Split-Merge on www.verypdf.com to remove this watermark.
Looks complicated, I know, but Typeperf is fairly easy to use after you get started. In
fact, all you really need to provide to get basic monitoring information is the path to the
performance counter you want to track. The performance counter path has the follow-
ing syntax:
\\ComputerName\ObjectName\ObjectCounter
Here, the path starts with the UNC computer name or IP address of the local or remote
computer you are working with and includes the object name and the object counter
to use. If you wanted to track System\Processor Queue Length on CORPSVR02, you’d
type:
typeperf "\\corpsvr02\System\Processor Queue Length"
Note
You might have noticed that I enclosed the counter path in double quotation marks.
Although this is good form for all counter paths, it is required in this example because
the counter path includes spaces.
You can also easily track all counters for an object by using an asterisk (*) as the coun-
ter name, such as in the following:
typeperf "\\corpsvr02\Memory\*"
Here, you track all counters for the Memory object.
A slight problem is introduced for objects that have multiple instances. For these
objects, such as the Processor object, you must specify the object instance you want to
work with. The syntax for this is as follows:
\\ComputerName\ObjectName(ObjectInstance)\ObjectCounter
Here, you follow the object name with the object instance in parentheses. To work with
all instances of an object that has multiple instances, you use _Total as the instance
name. To work with a specifi c instance of an object, use its instance identifi er. For
example, if you want to examine the Processor\% Processor Time counter, you must
use either this to work with all processor instances:
typeperf "\\corpsvr02\Processor(_Total)\% Processor Time"
or this to work with a specifi c processor instance:
typeperf "\\corpsvr02\Processor(0)\% Processor Time"
In this case, that is the fi rst processor on the system.
By default, Typeperf writes its output to the command line in a comma-delimited list.
You can redirect the output to a fi le using the -o parameter and set the output format
Note
You might have noticed that I enclosed the counter path in double quotation marks.
Although this is good form for all counter paths, it is required in this example because
the counter path includes spaces.
Performance Logging 371
Chapter 12
Please purchase PDF Split-Merge on www.verypdf.com to remove this watermark.
using the -f parameter. The output format indicators are CSV for a comma-delimited
text fi le, TSV for a tab-delimited text fi le, BIN for a binary fi le, and SQL for a SQL binary
fi le. Consider the following example:
typeperf "\\corpsvr02\Memory\*" -o perf.bin -f bin
Here, you track all counters for the Memory object and write the output to a binary fi le
called Perf.bin in the current directory.
If you need help determining the available counters, type typeperf -q followed by the
object name for which you want to view counters, such as in the following:
typeperf -q Memory
If an object has multiple instances, you can list the installed counters with instances by
using the -qx parameter, such as in the following:
typeperf -qx PhysicalDisk
You can use this counter information as input to Typeperf as well. Add the -o parameter
and write the output to a text fi le, such as in the following:
typeperf -qx PhysicalDisk -o perf.txt
Then edit the text fi le so that only the counters you want to track are included. You can
then use the fi le to determine which performance counters are tracked by specifying
the -cf parameter followed by the fi le path to this counter fi le. Consider the following
example:
typeperf -cf perf.txt -o c:\perfl ogs\perf.bin -f bin
Here, Typeperf reads the list of counters to track from Perf.txt and then writes the per-
formance data in binary format to a fi le in the C:\PerfLogs directory.
The one problem with Typeperf is that it will sample data once every second until you
tell it to stop by pressing Ctrl+C. This is fi ne when you are working at the command line
and monitoring the output. It doesn’t work so well, however, if you have other things to
do—and most administrators do. To control the sampling interval and set how long to
sample, you can use the -si and -sc parameters, respectively. For example, if you wanted
Typeperf to sample every 60 seconds and stop logging after 120 samples, you could
type this:
typeperf -cf perf.txt -o C:\perf\logs\perf.bin -f bin -si 60 -sc 120
Analyzing Trace Logs at the Command Line
You can examine trace log data by using the Tracerpt command-line utility. Tracerpt
processes trace logs and allows you to generate trace analysis reports and dump fi les for
the events generated. The parameters for Tracerpt are summarized in Table 12-3.
Chapter 12
372 Chapter 12 Comprehensive Performance Analysis and Logging
Please purchase PDF Split-Merge on www.verypdf.com to remove this watermark.
Table 12-3 Parameters for Tracerpt
Parameter Description
-o [fi lename] Sets the text output fi le to which the parsed data should be
written. The default is Dumpfi le.xml.
-summary [fi lename] Sets the name of the text fi le to which a summary report of the
data should be written. The default is Summary.txt.
-report [fi lename] Sets the name of the text fi le to which a detailed report of the
data should be written. The default is Workload.xml.
-rt <session_name
[session_name ...]>
Sets the real-time event trace session data source to use instead
of a converted log fi le.
-confi g <fi lename> Specifi es a settings fi le containing command options.
-y Answers Yes to all questions without prompting.
-of <CSV|EVTX|XML> Sets the dump fi le format.
-f <XML|HTML> Sets the report fi le format.
-export <fi lename> Sets the name of the event schema export fi le. The default is
schema.man.
The most basic way to use Tracerpt is to specify the name of the trace log to use. By
default trace logs are written to C:\PerfLogs, so if a log in this directory was named
SysP_000002.etl, you could analyze it by typing the following:
tracerpt C:\Perfl ogs\SysP_000002.etl
Here, four fi les are created in the current directory: The parsed output is written to
Dumpfi le.xml, a summary report is written to Summary.txt, a detailed report is written
to Workload.xml, and a event schema report fi le is written to schema.man.
You could also specify the exact fi les to use for output as shown in the following
example:
tracerpt C:\Perfl ogs\ SysP_000002.etl -o c:\sysp.csv
-summary c:\sysp-summary.txt -report sysp-report-.txt
Performance Logging 373
Chapter 12
Please purchase PDF Split-Merge on www.verypdf.com to remove this watermark.
Please purchase PDF Split-Merge on www.verypdf.com to remove this watermark.
PART 3
Managing Windows
Server 2008 Storage
and File Systems
CHAPTER 13
Boot Confi guration . . . . . . . . . . . . . . . . . . . . . 377
CHAPTER 14
Storage Management . . . . . . . . . . . . . . . . . . . 405
CHAPTER 15
TPM and BitLocker Drive Encryption . . . . . . 467
CHAPTER 16
Managing Windows Server 2008
File Systems . . . . . . . . . . . . . . . . . . . . . . . . . . . 497
CHAPTER 17
File Sharing and Security . . . . . . . . . . . . . . . . 547
CHAPTER 18
Using Volume Shadow Copy . . . . . . . . . . . . . 587
CHAPTER 19
Using Remote Desktop
for Administration . . . . . . . . . . . . . . . . . . . . . . 607
375
Please purchase PDF Split-Merge on www.verypdf.com to remove this watermark.
Please purchase PDF Split-Merge on www.verypdf.com to remove this watermark.
U
nlike earlier releases of server operating systems for Windows, Windows Server
2008 doesn’t boot from an initialization fi le. Instead, the operating system uses
the Windows Boot Manager to initialize and start the operating system. The boot envi-
ronment dramatically changes the way the operating system starts and is designed
to resolve issues related to boot integrity, operating system integrity, and fi rmware
abstraction. The boot environment is loaded prior to the operating system, making
it a pre–operating system environment. This ensures that the boot environment can
be used to validate the integrity of the startup process and the operating system itself
before actually starting the operating system.
Boot from Hardware and Firmware
At fi rst glance, startup and shutdown seem to be the most basic features of an operating
system, but as you get a better understanding of how computers work, you quickly see
that there’s nothing simple or basic about startup, shutdown, or related processes and
procedures. In fact, anyone who’s worked with computers probably has had a problem
with startup or shutdown at one time or another. Problems with startup and shut-
down are compounded in Windows Vista and Windows Server 2008 because of their
extended frameworks for advanced confi guration and power management in fi rmware
and hardware.
Note
Many administrators install Windows Server 2008 on desktop class systems without giv-
ing careful consideration to how this could affect the operation of the computer. When
you install Windows Server 2008 on a desktop class system, it is critically important for
you to understand how computers designed for Windows Vista handle advanced con-
fi guration and power management in hardware and fi rmware. This will enable you to
modify the hardware and fi rmware settings so that they work with Windows Server 2008.
Never install Windows Server 2008 on a desktop class system without fi rst checking its
hardware and fi rmware confi guration settings for boot and power.
Boot from Hardware and Firmware . . . . . . . . . . . . . . . . 377
Boot Environment Essentials . . . . . . . . . . . . . . . . . . . . . . 382
Managing Startup and Boot Configuration . . . . . . . . . 383
Managing the Boot Configuration Data Store
and Its Entries . . . . . . . . . . . . . . . . . . . . . . . . . . . . . . . . . . 390
CHAPTER 13
Boot Confi guration
377 377
Please purchase PDF Split-Merge on www.verypdf.com to remove this watermark.
Hardware and Firmware Power States
Before the boot environment is loaded, computers start up from hardware and fi rm-
ware. Windows Vista does things a bit differently from Windows Server 2008 when it
comes to power state management features. In Windows Vista, turning off a computer
and shutting down a computer are separate tasks. By default, when you turn off a
computer running Windows Vista, the computer enters standby mode. When entering
standby mode, the operating system automatically saves all work, turns off the display,
and enters a low power consumption mode with the computer’s fans and hard disks
stopped. The state of the computer is maintained in the computer’s memory. When the
computer wakes from standby mode, its state is exactly as it was when you turned off
your computer.
You can turn off a computer running Windows Vista and enter standby mode by click-
ing the Start button and then clicking the power button. To wake the computer from
the standby state you can press the power button on the computer’s case or a key on
the computer’s keyboard. Moving the mouse also wakes the computer.
Mobile computers running Windows Vista can be turned off and turned on by closing
or opening the lid. When you close the lid, the laptop enters the standby state. When
you open the lid, the laptop wakes up from the standby state.
There are, however, a few gotchas with the power button and the standby state in
Windows Vista. The way the power button works depends on the following:
System hardware
For the power button to work, the computer hardware must
support the standby state. If the computer hardware doesn’t support the standby
state, the computer can’t use the standby state and turning off the computer pow-
ers it down completely.
System state
For the power button to work, the system must be in a valid state. If
the computer has installed updates that require a reboot or you’ve installed pro-
grams that require a reboot, the computer can’t enter the standby state and turn-
ing off the computer powers it down completely.
System confi guration
For the power button to work, sleep mode must be enabled.
If you’ve reconfi gured the power options on the computer and set the power but-
ton to the Shut Down action, the computer can’t use the standby state and turn-
ing off the computer powers it down completely.
You can determine exactly how Windows Vista is confi gured by clicking Start and
looking at the power button icon. An amber power button, depicting a shield with a
line through the top of it, indicates that the computer will turn off and enter low-power
sleep state. A red power button, depicting a shield with a line in the middle of it, indi-
cates that the computer will shut down and completely power off.
Chapter 13
378 Chapter 13 Boot Configuration
Please purchase PDF Split-Merge on www.verypdf.com to remove this watermark.
Diagnosing Hardware and Firmware Startup Problems
When you are working with Windows Vista or Windows Server 2008 and trying to
diagnose and resolve startup problems, it is important to remember that power state
management capabilities are provided by the hardware but are enabled by the operat-
ing system. Because of this, to fully diagnose and resolve problem boot issues, you must
look at the computer’s hardware and software, including:
Motherboard/chipset
Firmware
Operating system
To better understand the hardware aspects related to boot issues, let’s dig in and take
a look at Advanced Confi guration and Power Interface (ACPI). A computer’s mother-
board/chipset, fi rmware, and operating system must support ACPI for the advanced
power state features to work. There are many different types of motherboards/chipsets.
Although older motherboards/chipsets might not be updatable, most of the newer ones
have updatable fi rmware. Chipset fi rmware is separate from and different from the
computer’s underlying fi rmware interface.
Currently, the two prevalent fi rmware interfaces are:
Basic input/output system (BIOS)
Extensible Firmware Interface (EFI)
A computer’s BIOS or EFI programming provides the hardware-level interface between
hardware components and software. Like chipsets themselves, BIOS and EFI can be
updated. ACPI-aware components track the power state of the computer. An ACPI-
aware operating system can generate a request that the system be switched into a differ-
ent ACPI mode. BIOS or EFI responds to enable the requested ACPI mode.
As shown in Table 13-1, there are a total of six different power states ranging from S0
(the system is completely powered ON and fully operational) to S5 (the system is com-
pletely powered OFF) and the states (S1, S2, S3, and S4) are referred to as sleep states,
in which the system appears OFF because of low power consumption and retains
enough of the hardware context to return to the working state without a system reboot.
Motherboards/chipsets support specifi c power states. For example, the Intel Server
Board SE7505VB2 supports S0, S1, S4, and S5 states, but does not support the S2 and
S3 states. In Windows operating systems, the sleep power transition refers to switch-
ing off the system to a sleep or a hibernate mode, and the wake power transition refers
to switching on the system from a sleep or a hibernate mode. The sleep and hibernate
modes allow users to switch off and switch on systems much faster than the regular
shutdown and startup processes.
Thus, a computer is waking up when the computer is transitioning from the OFF state
(S5) or any sleep state (S1–S4) to the ON state (S0) and the computer is going to sleep
when the computer is transitioning from the ON state (S0) to the OFF state (S5) or
sleep state (S1–S4). A computer cannot enter one sleep state directly from another, as it
must enter the ON state before entering any other sleep state.
Boot from Hardware and Firmware 379
Chapter 13
Please purchase PDF Split-Merge on www.verypdf.com to remove this watermark.
Table 13-1 Power States for ACPI in Firmware and Hardware
State Type Description
S0 ON state The system is completely operational, fully powered, and completely
retains the context (such as the volatile registers, memory caches, and
RAM).
S1 Sleep state The system consumes less power than the S0 state. All hardware and
processor contexts are maintained.
S2 Sleep state The system consumes less power than the S1 state. The processor
loses power and processor context and contents of the cache are lost.
S3 Sleep state The system consumes less power than the S2 state. Processor and
hardware contexts, cache contents, and chipset context are lost. The
system memory is retained.
S4 Hibernate
state
The system consumes the least power compared to all other sleep
states. The system is almost at an OFF state. The context data is
written to the hard disk and there is no context retained. The system
can restart from the context data stored on the disk.
S5 OFF state The system is in a shutdown state and the system retains no context.
The system requires a full reboot to start.
Resolving Hardware and Firmware Startup Problems
On most computers, you can enter the BIOS or EFI during boot by pressing F2 or
another function key. When you are in fi rmware, you can go to the Power screen or a
similar screen to manage ACPI and related settings.
Power settings you might see include:
After Power Failure or AC Recovery
Determines the mode of operation if a power
loss occurs and for which you’ll see settings like Stay off/Off, Last state/Last,
Power on/On. Stay Off means the system will remain off after power is restored.
Last state restores the system to the state it was in before power failed. Power On
means the system will turn on after power is restored.
Wake On LAN From S5 or Auto Power On
Determines the action taken when the
system power is off and a PCI Power Management wake event occurs. You’ll see
settings like Stay off or Power on.
ACPI Suspend State or Suspend Mode
Sets the suspend mode. Typically, you’ll be
able to set S1 State or S3 State as the suspend mode.
Note
I provide two standard labels for each setting because your computer hardware may not
have these exact labels. The fi rmware variant you are working with determines the actual
labels that are associated with boot, power, and other settings.
Note
I provide two standard labels for each setting because your computer hardware may not
have these exact labels. The fi rmware variant you are working with determines the actual
labels that are associated with boot, power, and other settings.
Chapter 13
380 Chapter 13 Boot Configuration
Please purchase PDF Split-Merge on www.verypdf.com to remove this watermark.
Because Intel and AMD also have other technologies to help reduce startup and resume
times, you might also see power settings for:
Enhanced Intel SpeedStep Technology (EIST), which can be either Disabled or
Enabled
Intel Quick Resume Technology Driver (QRTD), which can be either Disabled or
Enabled
Enhanced Intel SpeedStep Technology (EIST or SpeedStep) allows the system to
dynamically adjust processor voltage and core frequency, which can result in decreased
average power consumption and decreased average heat production. When EIST or
a similar technology is enabled and in use, you’ll see two different processor speeds
on the System page in Control Panel. The fi rst speed listed is the specifi ed speed of
the processor. The second speed is the current operating speed, which should be less
than the fi rst speed. If Enhanced Intel SpeedStep Technology is off, then both proces-
sor speeds will be equal. Advanced Settings for Power Options under Processor Power
Management can also affect how this technology works. Generally speaking, although
you might want to use this technology with Windows Vista, you won’t want to use this
technology with Windows Server 2008.
Intel Quick Resume Technology Driver (QRTD) allows an Intel Viiv technology-based
computer to behave like a consumer electronic device with instant on/off after an initial
boot. Intel QRTD manages this behavior through the Quick Resume mode function of
the Intel Viiv chipset. Pressing the power button on the computer or a remote control
puts the computer in the Quick Sleep state, and you can switch the computer to the
Quick Resume state by moving the mouse, pressing an on/off key on the keyboard
(if available), or pressing the sleep button on the remote control. Quick Sleep mode is
different from standard sleep mode. In Quick Sleep mode, the computer’s video card
stops sending data to the display, the sound is muted, and the monitor LED indicates
a lowered power state on the monitor but the power continues to be supplied to vital
components on the system, such as the processor, fans, and so on. As this technology
was originally designed for Windows XP Media Center Edition, in many cases it does
not work with Windows Vista and generally should not be used with Windows Server
2008. You might need to disable this feature in fi rmware to allow Windows Vista to
properly sleep and resume.
After you look at the computer’s power settings in fi rmware, you should also review the
computer’s boot settings in fi rmware. Typically, you’ll be able to confi gure the following
boot settings:
Boot Drive Order
Determines the boot order for fi xed disks
Boot To Hard Disk Drive
Determines whether the computer can boot to fi xed
disks and can be set to Disabled or Enabled
Boot To Removable Devices
Determines whether the computer can boot to
removable media and can be set to Disabled or Enabled
Boot To Network
Determines whether the computer can perform a network boot
and can be set to Disabled or Enabled
Boot from Hardware and Firmware 381
Chapter 13
Please purchase PDF Split-Merge on www.verypdf.com to remove this watermark.
USB Boot
Determines whether the computer can boot to USB fl ash devices and
can be set to Disabled or Enabled
As with power settings, your computer might not have these exact labels, but the labels
should be similar. You’ll need to optimize these settings for the way you plan to use the
computer. In most cases, with server hardware, you’ll only want to enable Boot To Hard
Disk Drive. The exception is for when you use BitLocker Drive Encryption. With Bit-
Locker, you’ll want to enable Boot To Removable Devices, USB Boot, or both to ensure
that the computer can detect the USB fl ash drive with the encryption key during the
boot process.
Boot Environment Essentials
Windows Server 2008 supports several different processor architectures and several
different disk partitioning styles. Generally, computers with x86-based and x64-based
processors use the master boot record (MBR) disk partitioning style and BIOS. Comput-
ers with x64-based processors use the GUID partition table (GPT) disk partitioning
style and Extensible Firmware Interface (EFI).
BIOS and EFI currently are the two most prevalent fi rmware interfaces. With earlier
releases of the server operating system for Windows, BIOS-based computers use Ntldr
and Boot.ini to boot into the operating system. Ntldr handles the task of loading the
operating system while Boot.ini contains the parameters that enable startup, including
identity of the boot partitions. Through Boot.ini parameters, you can add options that
control the way the operating system starts, the way computer components are used,
and the way operating system features are used.
On the other hand, with earlier releases of the server operating system for Windows,
EFI-based computers use Ia64ldr.efi , Diskpart.efi , and Nvrboot.efi to boot into the oper-
ating system. Ia64ldr.efi handles the task of loading the operating system while Disk-
part.efi identifi es the boot partitions. Through Nvrboot.efi , you set the parameters that
enable startup.
Windows Server 2008 doesn’t use these boot facilities. Instead, it uses a pre–operating
system boot environment. Figure 13-1 provides a conceptual overview of how the boot
environment fi ts into the overall computer architecture.
The boot environment is an extensible abstraction layer that allows the operating sys-
tem to work with multiple types of fi rmware interfaces without requiring the operating
system to be specifi cally written to work with these fi rmware interfaces. Within the
boot environment, startup is controlled using the parameters in the Boot Confi guration
Data (BCD) store.
The BCD store is contained in a fi le called the BCD registry. The location of this registry
depends on the computer’s fi rmware:
On BIOS-based operating systems, the BCD registry fi le is stored in the
\Boot\Bcd directory of the active partition.
On EFI-based operating systems, the BCD registry fi le is stored on the EFI system
partition.
Chapter 13
382 Chapter 13 Boot Configuration
Please purchase PDF Split-Merge on www.verypdf.com to remove this watermark.
Hardware
Boot Environment
Boot Manager
Boot Application
Operating System
HAL (Hardware Abstraction Layer)
Device Drivers Microkernel
Figure 13-1 A conceptual view of how the boot environment works.
Entries in the BCD store identify the boot manager to use during startup and the spe-
cifi c boot applications available. The default boot manager is the Windows Boot Man-
ager. Windows Boot Manager controls the boot experience and enables you to choose
which boot application is run. Boot applications load a specifi c operating system or
operating system version. For example, a Windows Boot Loader application loads Win-
dows Server 2008. This allows you to boot BIOS-based and EFI-based computers in
much the same way.
Managing Startup and Boot Confi guration
As discussed in “Troubleshooting Startup and Shutdown” on page 1416, you can press
F8 during startup of the operating system to access the Advanced Boot Options menu
and then use this menu to select one of several advanced startup modes, including Safe
Mode, Enable Boot Logging, and Disable Driver Signature Enforcement. Although these
advanced modes temporarily modify the way the operating system starts to help you
diagnose and resolve problems, they don’t make permanent changes to the boot con-
fi guration or to the BCD store. Other tools you can use to modify the boot confi guration
and manage the BCD store include the Startup And Recovery dialog box, the System
Confi guration utility, and the BCD Editor. The sections that follow discuss how these
tools are used.
Managing Startup and Boot Configuration 383
Chapter 13
Please purchase PDF Split-Merge on www.verypdf.com to remove this watermark.
Managing Startup and Recovery Options
The Startup And Recovery dialog box controls the basic options for the operating sys-
tem during startup. You can use these options to set the default operating system, the
time to display the list of available operating systems, and the time to display recovery
options when needed. Whether you boot a computer to different operating systems or
not, you’ll want to optimize these settings to reduce the wait time during startup and in
this way speed up the startup process.
You can access the Startup And Recovery dialog box by completing the following steps:
1. In Control Panel\System And Maintenance, click System to access the System
window.
2. In the System window, click Advanced System Settings under Tasks in the left
pane. This displays the System Properties dialog box.
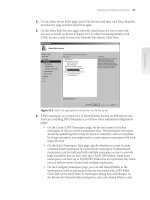
3. On the Advanced tab of the System Properties dialog box, click Settings under
Startup And Recovery. This displays the Startup And Recovery dialog box, as
shown in Figure 13-2.
Figure 13-2 Configure system startup options.
4. On a computer with multiple operating systems, use the Default Operating
System list to specify the operating system that you want to start by default.
5. Set the timeout interval for the operating system list by selecting the Time To
Display List Of Operating Systems check box and specifying a timeout in seconds
Chapter 13
384 Chapter 13 Boot Configuration
Please purchase PDF Split-Merge on www.verypdf.com to remove this watermark.
in the fi eld provided. To speed up the startup process, you might want to use a
value of 5 seconds.
6. Set the timeout interval for the recovery options list by selecting the Time To
Display Recovery Options When Needed check box and specifying a timeout in
seconds in the fi eld provided. Again, to speed up the start up process, you might
want to use a value of 5 seconds.
7. Click OK to save your settings.
Managing System Boot Confi guration
The System Confi guration utility (Msconfi g.exe) allows you to fi ne-tune the way a com-
puter starts. Typically, you’ll use this utility during troubleshooting and diagnostics.
For example, as part of troubleshooting, you can confi gure the computer to use a diag-
nostic startup where only basic devices and services are loaded.
The System Confi guration utility is available on the Administrative Tools menu. You
can also start the System Confi guration utility by clicking Start, typing msconfi g.exe in
the Search box, and pressing Enter. As shown in Figure 13-3, this utility has a series of
tabs with options.
The General tab options allow you to confi gure the way startup works and are where
you should start your troubleshooting and diagnostics. Using these options, you can
choose to perform a normal startup, diagnostic startup, or selective startup. After you
restart the computer and resolve any problems, access the System Confi guration utility
again, select Normal Startup on the General tab, and then click OK.
Figure 13-3 Perform a diagnostic or selective startup as part of troubleshooting.
Managing Startup and Boot Configuration 385
Chapter 13
Please purchase PDF Split-Merge on www.verypdf.com to remove this watermark.
The Boot tab options, shown in Figure 13-4, allow you to control the way the individual
startup-related processes work. You can confi gure the computer to start in one of vari-
ous Safe Boot modes and set additional options, such as No GUI Boot. If after trouble-
shooting you fi nd that you want to keep these settings, you can select the Make All Boot
Settings Permanent check box to save the settings to the boot confi guration startup
entry.
Figure 13-4 Fine-tune the boot options.
Clicking the Advanced Options button on the Boot tab displays the BOOT Advanced
Options dialog box shown in Figure 13-5. In addition to being able to lock PCI, detect
the correct HAL, and enable debugging, you can use the advanced options to:
Specify the number of processors the operating system should use. You should
use this option when you suspect there is a problem with additional processors
you’ve installed in a server and you want to pinpoint which processors are pos-
sibly causing startup problems. Consider the following scenario: A server shipped
with two processors and you installed two additional processors. Later, you fi nd
that you cannot start the server. You could eliminate the new processors as the
potential cause by limiting the computer to two processors.
Specify the maximum amount of memory the operating system should use. You
should use this option when you suspect there is a problem with additional mem-
ory you’ve installed in a server. Consider the following scenario: A server shipped
with 2 GB of RAM and you installed 2 additional GB of RAM. Later, you fi nd that
you cannot start the server. You could eliminate the new RAM as the potential
cause by limiting the computer to 2048 MB of memory.
Chapter 13
386 Chapter 13 Boot Configuration
Please purchase PDF Split-Merge on www.verypdf.com to remove this watermark.