Tạo dòng, giải trình tự vùng gene E và N chủng virus Sars-CoV-2 (Covid-19) đang lưu hành tại Việt Nam
Bạn đang xem bản rút gọn của tài liệu. Xem và tải ngay bản đầy đủ của tài liệu tại đây (1006.15 KB, 30 trang )
UNIVERSITY OF SCIENCE AND TECHNOLOGY OF HANOI
UNDERGRADUATE SCHOOL
Research and Development
BACHELOR THESIS
Project:
Cloning, sequencing and characterization of genes
encoding E and N proteins of SARS-CoV-2
circulating in Vietnam
Hanoi, July 2020
Contents
ACKNOWLEDGEMENTS
LIST OF ABBREVIATIONS
LIST OF FIGURES
LIST OF TABLES
ABSTRACT
TÓM TẮT
I/ INTRODUCTION
II/ OBJECTIVES
III/ MATERIALS AND METHODS
3.1.
Materials
3.2. Methods
3.2.1 RNA extraction from samples.
3.2.2 cDNA synthesis by reverse transcription enzyme
3.2.3 DNA sequencing and analysis
3.2.4 Phylogenetic tree analysis
3.2.5 Construction of pCR2.1 expression vector carrying E gene and N gene
3.2.6 Transformation of competent E.coli cell with plasmid DNA
3.2.7 Plasmid DNA extraction from E.coli
3.2.8 Restriction enzyme digestion:
3.2.9 Agarose gel electrophoresis
IV/ RESULTS AND DISCUSSIONS
4.1
Results
4.1.1 Insert E gene and N gene into pCR2.1 vector
4.1.2 Select recombinant plasmid carrying E gene and N gene by restriction enzymes
4.1.3 E gene analysis
4.1.4 N gene analysis
4.2
Discussion
V/ CONCLUSION 17
REFERENCES
18
LIST OF ABBREVIATIONS
BLAST
Basic Local Alignment Search Tool
COX-2
Cyclooxygenase-2
DMEM
Dulbecco’s modified Eagle’s medium
DMSO
Dimethyl sulfoxide
DPBS
Dulbecco's Phosphate Buffered Saline
eNOS
Endothelial nitric oxide synthase
FBS
Fetal bovine serum
IL-1β
Interleukin-1β
IL-6
Interleukin-6
iNOS
Inducible nitric oxide synthase
LPS
Lipopolysaccharide
MTT
3-(4, 5-dimethylthiazol-2-yl)-2, 5 diphenyltetrazolium bromide
NCBI
National Center for Biotechnology Information
NF-κB
Nuclear factor-kappaB
NNED
N-1-napthylethylenediamine dihydrochloride
nNOS
Neuronal nitric oxide synthase
NO
Nitric oxide
NO2-
Nitrite
NOS
Nitric oxide synthase
NSAIDs
Nonsteroidal anti-inflammatory drugs
SAs
Steroidal agent
TNF-α
Tumor necrosis factor-α
GAPDH
Glyceraldehyde-3-phosphate dehydrogenase
LIST OF FIGURES
Figure 1: Cytotoxicity of Polysporina extract in RAW 264.7 cells..................................10
Figure 2: Effects of Polysporina extract on LPS-induced NO production in LPS-induced RAW
264.7 cells.............................................................…………………………………11
Figure 3: The effects of Polysporina extract on the expression of COX-2 and iNOS protein in
RAW 264.7 cells................................................................................................15
LIST OF TABLES
Figure 1: Cytotoxicity of Polysporina extract in RAW 264.7 cells..................................10
Figure 2: Effects of Polysporina extract on LPS-induced NO production in LPS-induced RAW
264.7 cells.............................................................…………………………………11
Figure 3: The effects of Polysporina extract on the expression of COX-2 and iNOS protein in
RAW 264.7 cells................................................................................................15
ABSTRACT
Coronavirus disease 2019 or COVID-19 is an acute infectious respiratory disease caused by
SARS-CoV-2 corona virus. It has caused for alarms due to the absence of effective vaccines and
antiretroviral therapy, coupled with the ability to spread rapidly since it was first discovered in
January 2020. Therefore, the genome sequencing of this virus strain plays a key role in
developing a diagnostic kit, assessing the relationship between viral genes and human immune
mechanisms as well as developing an effective vaccine treatment.
In this study, the E and N gene was cloned from the SARS-CoV-2/human/VIE/NIHE/2020 strain
viral RNA by RT-PCR, and inserted into the cloning vector pCR2.1. The recombinant plasmid
pCR2.1 vector was confirmed by restriction enzymes and sequencing analysis.
The results of sequence analysis of nucleotide (nt) and amino acid (aa) based on the sequencing
of E gene (envelope gene) and N gene (nucleocapsid gene) showed that there were significantly
similarity percentage of nt and aa between the SARS-CoV-2 virus strains in this study and other
reference SARS-CoV-2 virus strains in the world collected from Genbank. The results of
phylogenetic tree analysis indicated that the SARS-CoV-2 virus strains is more closely related to
SARS 2003 virus strain than to the MERS 2012 virus strain.
Key word: SARS-CoV-2, envelope gene, nucleocapsid gene, cloning, sequencing analysis,
phylogenetic tree analysis
TÓM TẮT
Bệnh virus corona 2019 hay COVID-19 là một bệnh đường hơ hấp cấp tính truyền nhiễm gây ra
bởi chủng virus corona SARS-CoV-2. Nó đã gây ra sự báo động do khơng có bất kỳ loại vắc-xin
hiệu quả cũng như bất kỳ liệu pháp điều trị bằng thuốc chống virus nào và sự lây lan tương đối
nhanh chóng của nó trên toàn cầu, từ lần phát hiện đầu tiên vào đầu tháng 1 năm 2020. Do đó,
việc giải mã hệ gen của chủng virus này là yếu tố quan trọng giúp phát triển kit chẩn đoán bệnh,
đánh giá sự liên quan giữa gen virus và cơ chế miễn dịch của con người cũng như phát triển
vaccine điều trị.
Trong nghiên cứu này, gen E và N đã được sao chép từ RNA virus SARS-CoV-2 / human / VIE
/ NIHE / 2020 bằng RT-PCR và đưa vào vector nhân bản pCR2.1. Plasmid pCR2.1 tái tổ hợp đã
được xác nhận bằng enzyme cắt giới hạn và gene sequencing.
Kết quả phân tích trình tự nucleotide (nt) và axit amin (aa) dựa trên trình tự gen E (gen envelope)
và gen N (gen nucleocapsid) cho thấy tỷ lệ tương đồng đáng kể giữa nt và aa của chủng vi rút
SARS-CoV-2 trong nghiên cứu này và các chủng vi rút SARS-CoV-2 tham chiếu khác trên thế
giới được thu thập từ Genbank. Kết quả phân tích cây phát sinh gen cho thấy các chủng vi rút
SARS-CoV-2 có quan hệ gần gũi hơn với chủng vi rút SARS 2003 so với chủng vi rút MERS
2012.
Key word: SARS-CoV-2, envelope gene, nucleocapsid gene, cloning, phân tích trình tự gene,
phân tích cây phát sinh.
I/ INTRODUCTION
Coronavirus disease 2019 (COVID-19), caused by severe acute respiratory syndrome
coronavirus 2 (SARS-CoV-2), is a novel infectious disease that first emerged in Wuhan, China
in December 2019 (Wang et al. 2020), especially the total number of cases and deaths has
surpassed the 2003 severe acute respiratory syndrome coronavirus (SARS-CoV) (Xie et al.
2020). To specify, it has aff ected at least 190 countries or territories, with 14,647,584 confirmed
cases and 608,987 deaths (Worldometer 2020).
During the initial outbreak in Wuhan, China, the virus was commonly referred to as the
"coronavirus" or "Wuhan coronavirus" or "Wuhan virus". In January 2020, the World Health
Organisation recommended "2019 novel coronavirus" (2019-nCov) as the provisional name for
the virus, which was in accordance with WHO's 2015 guidance against using geographical
locations, animal species, or groups of people in disease and virus names. On 11 February 2020,
the name "severe acute respiratory syndrome coronavirus 2" (SARS-CoV-2) was accepted.
However, SARS-CoV-2 is a descendent of SARS-CoV but was chosen based on the established
practice for naming viruses in this species and the relatively distant relationship of SARS-CoV2 to the SARS-CoV virus in a phylogenetic tree and the distance space. In addition, to avoid
confusion with the disease SARS, SARS-CoV-2 sometimes is referred as "the COVID-19 virus"
or HCoV-19 (Gorbalenya et al. 2020).
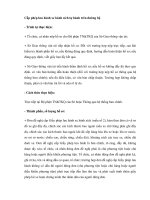
Figure 1: Structure of Coronaviruses.
Coronaviruses are enveloped, positive-sense, single stranded RNA viruses that can infect a wide
range of human and animal species (Chu et al. 2020). The corona viral genome encodes four
major structural proteins which are the spike (S) protein, nucleocapsid (N) protein, membrane
(M) protein, and the envelope (E) protein. All of these components are required to produce a
structurally complete viral particle. Individually, each protein primarily plays a role in the
structure of the virus particle (Schoeman and Fielding 2019a), for instance, the S protein mediates
the attachment of the virus to the host cell surface receptors resulting in fusion and subsequent
viral entry whereas the M protein is the most abundant protein and defines the shape of the viral
envelope. The E protein is the smallest of the major structural proteins and participates in viral
assembly and budding while the N protein is the only one that binds to the RNA genome and is
also involved in viral assembly and budding (Malik 2020).
Table 1: SARS-CoV-2 genome
Gene
Position
Length (nt)
1
ORF1ab
266-21555
21290
2
ORF1a
266-13483
13218
3
S
21563-26384
3822
4
ORF3
25393-26220
828
5
E
26245-26472
228
6
M
26532-27191
660
7
ORF6
27202-27387
186
8
ORF7a
27394-27759
366
9
ORF7b
27756-27887
132
10
ORF8
27894-28259
366
11
N
28274-29533
1260
12
ORF10
29558-29674
117
The SARS-CoV-2 genome is similar to typical CoVs, which contains at least ten open reading
frames (ORFs). The 5’-terminal two thirds of the genome ORF1a/b encodes two large
polyproteins, which form the viral replicase transcriptase complex, coupled with the other ORFs
of SARSCoV-2 on the one- third of the genome encode the same four main structural proteins:
spike (S), envelope (E), nucleocapsid (N) and membrane (M) proteins and several accessory
proteins with unknown functions which do not participate in viral replication (Malik 2020). In
this study, we would like to focus on two structural genes which are E gene encoding for E protein
and N gene encoding for N protein of SARS-CoV-2.
Envelope protein
Starting with some general information about the E protein, the E protein encoded by the E gene
is the smallest structural protein of SARS-CoV-2 but also the most enigmatic. This
transmembrane protein has a N-terminal ectodomain and a C-terminal endodomain with ion
channel activity (Schoeman and Fielding 2019a). During the replication cycle of SARS-CoV-2,
E gene is abundantly expressed inside the infected cell, but only a small portion is incorporated
into the virion envelope (Corse and Machamer 2000). The majority of the protein is localised at
the site of intracellular trafficking, where it participates in CoV assembly and budding (Fischer
et al. 1998). Based on the importance of E protein in virus production and maturation, we can
design the protocol of the real-time RT-PCR assays targeting the E gene to diagnose infectious
cases, as well as investigate its capacity in producing effective vaccines for SARS-CoV-2
treatment (Malik 2020).
Nucleocapsid protein
The nucleocapsid (N) protein is encoded by the 9th ORF of SARS-CoV and it is known to be the
most abundantly expressed protein of the SARS-CoV-2. The protein is composed of two separate
domains, an N-terminal domain (NTD) and a C-terminal domain (CTD). It has been suggested
that optimal RNA genome binding requires contribution from both these domains due to a huge
amount of positively charged amino acids consisting of N-terminal regions. Between these two
structural domains, N gene included a highly disordered region, which has been reported to
interact with the membrane (M) protein and human cellular hnRNPA1 protein as well as it is also
predicted to be a hotspot for phosphorylation. Hence, in summary, the N-protein might serve
completely different functions during different stages of the viral life cycle. Therefore, the
investigation of the N gene of SARS-CoV-2 can be used as a component for COVID-19 detection
and provide a handsome opportunity to develop an effective vaccine treatment for this disease
(Surjit and Lal 2008).
Situation of SARS-CoV-2 research in the world and in Vietnam
Up to 15th July, 2020, there are 163 COVID-19 vaccine candidates being researched and
developed: 23 vaccines are tested in humans and 140 candidates are in preclinical phase. Besides,
the governments have also begun issuing Guidelines for research, development, clinical trials
and registration of licenses for the COVID-19 vaccine.
Figure 2: Number of circulating COVID-19 therapeutic vaccines
Vietnam is currently controlling the COVID-19 epidemic, however, social distancing is just a
temporary solution to limit the number of new infectious cases as well as prevent the development
and outbreak of COVID-19. There are still many mysteries we need to uncover about the SARSCoV-2 virus, especially developing an effective vaccine against COVID-19 vaccine. Currently,
there are 04 domestic manufacturers which are VABIOTECH, POLYVAC, IVAC and
NANOGEN are in the process of discovering and developing the COVID-19 vaccine.
II/ OBJECTIVES
III/ MATERIALS AND METHODS
3.1. Materials
E gene and N gene cloned into pCR2.1 vector was provided by Molecular Microbiology Lab
—Institute of Biotechnology — Vietnam Academy of Science and Technology.
E.coli DH5 α strain (InvitrogenTM) was used as a primary host for cloning purpose, which
is engineered to maximize transformation efficiency. They are defined by three
mutations recA1, endA1 which help plasmid insertion and lacZM15 which enable blue white
screening. The cells are competent and often used with calcium chloride transformation to
insert the desired plasmid.
pCR2.1 vector: It has 3'-T overhangs for direct ligation of Taq-amplified PCR products, T7
promoter for in vitro RNA transcription and sequencing, a versatile polylinker with flanking
EcoR I sites for easy excision of inserts and a M13 forward and reverse primer sites for
sequencing
3.2 Methods:
3.2.1 RNA extraction:
Trizol (Invitrogen) was used to extract RNA of the sample, and extraction protocols followed the
manufacturer's standard instructions. Add 800uL of Trizol solution into 200uL of virus
suspension, vortex and then add 200uL of chloroform and vortex solution for 15 seconds, then
incubate at room temperature for 5 minutes. The suspension was centrifuged at 12000 rpm for
10 minutes at 40C. After centrifugation, transfer the aqueous phase containing RNA into a new
eppendorf tube (approximately 500 μL). Precipitating viral RNA by adding 500uL of Isopropanol
solution, centrifugation at 12000 rpm for 10 minutes at 40°C. Washing the precipitate with 1mL
of Ethanol 70°, centrifuge at 12000 rpm for 10 minutes at 40°C. Dissolving the RNA in 30uL of
Rnase-free sterile water and confirm the quality of the RNA by Nanodrop measurement. The
purified RNA would be stored at -20°C.
3.2.2 cDNA synthesis by reverse transcription enzyme:
The cDNA has been synthesized by reverse transcription enzymes. To synthesize cDNA, a
SuperScriptTM (Invitrogen) kit was used. The components and optimal condition for cDNA
synthesis are as follows: 5uL of purified RNA, 4.5uL of RNase-free water, 3uL dNTPs (2.5mM/
type), 2uL of oligo dT primer (200pM / uL), 1uL SuperscriptTM II RNAse H- reverse
transcriptase (20U / uL), 0.5uL RNase inhibitor (10U / uL) and 4uL 5x first strand buffer. The
reaction was performed at 420°C in 60 minutes and then increased to 85°C in 5 minutes.
3.2.3 DNA sequencing and analysis:
The nucleotide sequence of studied strain was determined by Sanger's method using ABI prism
3100 Sequencer (Applied Biosystem) with BigDye Terminator v3.1 Cycle Sequencing Kit of
Applied cave Biosystems. The results of 2-dimensional reading sequences were assembled into
complete sequences by ChromasPro, BioEdit (Hall, 2013) coupled with investigating the
similarity of gene functions on NCBI data banks by BlastN tool and BlastX. E gene and N gene
were chosen for further analysis.
3.2.4 Phylogenetic tree analysis:
Nucleotide sequences were compared by using the ClustalW software. In addition, the analysis
of genetic correlation and evolutionary origin by constructing a phylogenetic tree based on E and
N genes of Sarscov2 strains and reference strains collected from Genbank were performed by
MEGA7 tool, which used the Maximum-likelihood similarity algorithm, coupled with a repeat
value (bootstrap) 1000 times.
3.2.5 Construction of pCR2.1 expression vector carrying E gene and N gene
In order to clone the E gene and N gene into pCR2.1 expression vectors, those two sequences
were amplified by PCR, then PCR product and pCR2.1 vector were cut simultaneously with
EcoRI, then purified by agarose gel extraction kit. The digested PCR product was then ligated to
the vector by R4-ligase. The ligation reaction was performed as below:
Table 2: Reaction component for inserting gene into expression vector
Components
Volume (uL)
Deionized water
4.5
Buffer for T4 DNA ligase
1
(10X)
Vector pCR2.1 (200ng)
1
T4 DNA ligase
0.5
Template
3
Total
10
Notice: Incubate the reaction at 140C overnight.
3.2.6 Transformation of competent E.coli cell with plasmid DNA
Transformation is the process of getting the recombinant vector from a reaction mixture or vector
solution into E. coli cells. To enable the cells to take up circular vector DNA they have to be
made competent. The method for the preparation of competent cells depends on the
transformation method used and transformation efficiency required.
E.coli competent cell preparation
1, Inoculate one colony from the LB plate into 2 ml LB liquid medium. Shake at 37°C overnight.
2. Inoculate 1-ml overnight cell culture into 100 ml LB medium (in a 500 ml flask). Shake
vigorously at 37°C to OD600 — 0.25-0.3 (usually it takes about 1.5-2 hours).
3. Chill the culture on ice for 15 min. Also make sure the 0.1M CaCl2 solution and 0.1M CaCl2
plus 15% glycerol are on ice
4. Centrifuge the cells for 10 min at 3300g (e.g. 4,000 rpm in the Jouan tabletop centrifuge) at 4
°C.
5. Discard the medium and resuspend the cell pellet in 30-40 ml cold 0.1M CaCl2.
6. Keep the cells on ice for 30 min.
7. Centrifuge the cells as above.
8. Remove the supernatant, and resuspend the cell pellet in 6 ml 0.1 M CaCl2 solution plus 15%
glycerol.
9. Pipet 0.4-0.5 ml of the cell suspension into sterile 1.5 ml microcentrifuge tubes. Freeze these
tubes on dry ice and then transfer them to the -70 C freezer.
Notes:
1. The transformation efficiency is about 1-5x10⁶/u1 DNA when using the competent cells
prepared with this method.
2. Important: all steps after harvesting the cell should be done on ice (or at 4 °C)
2. The frozen competent cells are stable for 6 months, but once a tube is taken from the freezer
and thawed, any unused portion should be discarded.
3. After the competent cells are made, the transformation efficiency should be checked by
transformation using plasmid DNA of known concentration.
Chemical Transformation
1. Add 1-50118 of DNA (in a volume greater than 10u1) per 100u1 cells. Quickly flick the tube
several times to ensure the even distribution of DNA. To determine the transformation efficiency,
add 1-10u1 (0.1-1ng, depending on how competent the cells are) of the pGEM-3Z control
plasmid (or alternate control).
2. Immediately place tubes on ice for at least 10 minutes.
3. Heat shocks the cells for 45-50 seconds in a water bath at exactly 42°C. Do not shake.
4. Immediately place tubes on ice for 2 minutes.
5. Add 900u1 of LB medium and incubate for 1 hour at 37°C with shaking at —225 rpm.
6. Plate 100-200u1 of the transformation mix or an appropriate dilution onto antibiotic plates.
7. For the positive control DNA, a 1:100 to 1:1000 dilution is recommended for plating on LB
plates.
8. Place plates in the 37°C incubator and grow overnight 14-18 hrs depending on the cell growth
rate.
3.2.7 Plasmid DNA extraction from E.coli
Plasmid DNA were extracted from E.coli using Alkaline Lysis Method.
3.2.8 Restriction enzyme digestion:
Digestion of PCR product and DNA plasmid was performed as below:
Table 3: Digestion of pCR2.1 vector and PCR product by restriction enzymes:
Components
Density
Buffer
5uL
pCR2.1
20uL
vector
EcoRI
3uL
Deionized
14uL
water
Total
50uL
3.2.9 Agarose gel electrophoresis:
Prepare 1% agarose gel: lg agarose + 100 ml solution TEA 1X, heated in microwave oven until
completely melted. After cooling the solution to about 60°C, pour it into a casting tray containing
a sample comb and keep at room temperature for polymerization. After solidifying, the comb is
removed, using care not to rip the bottom of the wells. The gel, still in its plastic tray, is inserted
horizontally into the electrophoresis chamber and just covered with a buffer. Samples containing
DNA mixed with loading dye are then pipetted into the same wells, the lid and power leads are
placed on the apparatus and a current is applied (potential difference 100-110V) in 30 minutes.
Observing the migration of bromophenol blue dye to know when electrophoresis would be done.
DNA fragments are visualized by staining the gel with EtBr (ethidium bromide: 24m1) in 15
minutes, then wash through with distilled water. Lastly, gel is placed on an ultraviolet
transilluminator to observe the band.
IV/ RESULTS AND DISCUSSIONS
4.1. Results:
4.1.1 Insert E gene and N gene into pCR2.1 vector
In order to express in E.coli, the gene of interest needs to be cloned into the expression vector. In
this study, the pCR2.1 vector was used for expression. PCR product (E gene and N gene) and the
pCR2.1 expression vector were cut simultaneously by restriction enzyme EcoRI, then were
separated on 1% agarose by electrophoresis. Excise the DNA bands corresponding to E gene and
N gene and pCR2.1 vector from agarose gel, then the DNA bands were eluted out of the gel by
gel elution method. The purified PCR product and vector were linked together by T4 ligase to
create recombinant vectors. Recombinant vectors are transformed into E.coli and plated on LB
solid medium supplemented with Amp (100mg/ml). In order to select recombinant plasmid that
carried genes of interest, a number of single colonies were picked up, growing with shaking in
LB medium supplemented with Amp (100mg/ ml) at 37°C overnight. Plasmid was extracted from
the colonies by the method described above, then checked on 1% agarose gel. Result of plasmid
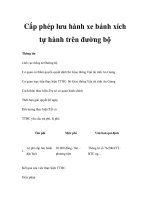
extraction is shown in Fig 3. During the electrophoresis on agarose gel, the larger molecules
move more slowly through the gel while the smaller molecules move faster. From electrophoresis
results (Fig 3), the plasmids that move slower than the control were chosen for further analysis
because these plasmids may carry foreign genes. To check whether these plasmid carries the
foreign DNA or not, they would be cut with EcoRI and then analysed by agarose gel
electrophoresis (Fig 4).
Fig 3: Plasmid extraction result of E gene and N gene on 1% agarose gel.
M; DNA marker 1kb plus (Fermentas), X; negative control.
4.1.2 Select recombinant plasmid carrying E gene and N gene by restriction enzymes
When designing primers, the restriction enzyme EcoRI had been inserted in the 5'-terminus of
the forward and reverse primers, respectively. So, if the recombinant vector carrying E gene or
N gene, then when vector were cut by this enzyme, a foreign DNA fragment that have the same
size with E gene or N gene would be released. The result of electrophoresis on 1% agarose gel
(Fig 4) showed that all 2 plasmids checked also released the DNA bands with the same size of
the E gene ( 7..bp) and N gene (1473 bp) . Thus, these 2 recombinant plasmids are capable of
carrying E gene or N gene. In order to affirm certainty that the newly cloned fragments was bring
genes of interest, those recombinant plasmid were futher analysed by DNA sequencing on
automated sequencing machine ABI Prism 3100 sequencer with the BigDye Terminater v3.1
Cycle Sequencing (Applied Biosystem). The results of sequencing were analyzed by Blast and
BioEdit software. Compared with reference E gene and N gene sequence submitted in GenBank,
the cloned DNA fragments were confirmed to carry E gene and N gene.
pCR 2.1
Inserted fragment
Figure 4: Electrophoresis result of the recombinant plasmids cut with EcoRI
M; Marker, X; negative control
4.1.3 E gene analysis
In this part, the investigation of the E gene sequence as well as phylogenetic tree was presented
to evaluate the genetic variation of SARS-CoV-2 circulating in the world, coupled with
examining the potential candidate to develop the vaccines treatment for SARS-CoV-2.
10
MT127115
MT447168.1
MT510726.1
MT407659.1
MT470125.1
LC547533.1
20
30
40
50
60
70
80
90
100
....|....|....|....|....|....|....|....|....|....|....|....|....|....|....|....|....|....|....|....|
atgtactcattcgtttcggaagagacaggtacgttaatagttaatagcgtacttctttttcttgctttcgtggtattcttgctagttacactagccatcc
....................................................................................................
....................................................................................................
....................................................................................................
....................................................................................................
....................................................................................................
MT678839.1
MT637144.1
MT374108.1
MT077125.1
MT126808.1
....................................................................................................
....................................................................................................
....................................................................................................
....................................................................................................
....................................................................................................
110
120
130
140
150
160
170
180
190
200
MT127115
MT447168.1
MT510726.1
MT407659.1
MT470125.1
LC547533.1
MT678839.1
MT637144.1
MT374108.1
MT077125.1
MT126808.1
....|....|....|....|....|....|....|....|....|....|....|....|....|....|....|....|....|....|....|....|
ttactgcgcttcgattgtgtgcgtactgctgcaatattgttaacgtgagtcttgtaaaaccttctttttacgtttactctcgtgttaaaaatctgaattc
....................................................................................................
....................................................................................................
....................................................................................................
....................................................................................................
....................................................................................................
....................................................................................................
....................................................................................................
....................................................................................................
....................................................................................................
....................................................................................................
MT127115
MT447168.1
MT510726.1
MT407659.1
MT470125.1
LC547533.1
MT678839.1
MT637144.1
MT374108.1
MT077125.1
MT126808.1
210
220
....|....|....|....|....|...
ttctagagttcctgatcttctggtctaa
............................
............................
............................
............................
............................
............................
............................
............................
............................
............................
Figure 5: Genetic variation analysis of E gene of studied strain compared with other
reference strains collected from Genbank
The upper figure describes the comparison between the studied E gene sequence and other
reference E gene sequences of SARS-CoV-2 strains collected from GenBank. It can be seen very
clearly that, the studied E gene sequence identical to all reference E gene listed in the figure,
which mean even in various region in the world with different timeline, the variation of the E
gene sequence of the SARS-CoV-2 virus strains has not occurred yet. The reasonable explanation
for this result might be due to the modest length of E gene sequence, which is only 228 nucleotide.
Thereby, the deduced amino acid sequences of the E gene of the SARS-CoV-2 virus strains listed
in the figure are also precisely the same to each other.
Table 4: Comparison between various E gene sequence of the SARS-COV-2 virus strains and E
gene sequences of the SARS-COV 2003 and MERS virus strains 2012 collected from GenBank
1
2
3
4
5
6
7
8
9
10
11
12
13
14
15
16
17
18
19
20
21
22
23
24
25
26
27
28
29
30
Description
MT077125.1_CoV-2/human/ITA/INMI1/2020
MT374108.1_CoV-2/human/TWN/CGMH-CGU-12/2020
MT637144.1_SARS-CoV-2/human/RUS/SCPM-O-cDNA-06/2020
MT678839.1_CoV-2/human/KOR/CNUHV03/2020
LC547533.1_hCoV-19/Japan/P5-3/2020
MT470125.1_CoV-2/human/France/10063BI/2020
MT126808.1_CoV-2/human/BRA/SP02/2020
MT407659.1_CoV-2/human/CHN/OS4/2020,
MT510726.1_CoV-2/human/USA/hCoV-19-USA-CA-UCSF-UC48/2020
MT447168.1_CoV-2/human/THA/SI204512-NT/2020
DQ182595.1 SARS ZJ0301 from China
AY310120.1 SARS FRA
AY864805.1 SARS BJ162
AY345986.1 SARS CUHK-AG01
AY323977.2 SARS HSR 1
AY502928.1 SARS TW5
JQ316196.1 SARS HKU-39849 isolate UOB
MK062179.1 SARS Urbani isolate icSARS
FJ882938.1 SARS wtic-MB
JX163928.1 SARS Tor2 isolate Tor2/FP1-10895
KT006149.2 Mers strain ChinaGD01
KM015348.1 Mers isolate England/2/2013
KJ361503.1 Mers isolate Hu-France - FRA2_130569-2013_Isolate_Sanger
KT806052.1 Mers isolate Hu/Kharj-KSA-2599/2015
KT326819.1 Mers strain MERS-CoV/KOR/KNIH/001_05_2015
KT026456.1 Mers isolate Hu/Riyadh_KSA_4050_2015
KX034097.1 Mers isolate MERS-CoV/KOR/Seoul/080-3-2015
KT225476.2 Mers isolate MERS-CoV/THA/CU/17_06_2015
KY688122.1 Mers-related strain Hu/Hufuf-KSA-11767/2015
KY581684.1 Mers-related strain Hu/UAE_002_2013
Per. ident
100
100
100
100
100
100
100
100
100
100
93.51
93.51
93.51
93.51
93.51
93.51
93.51
93.51
93.51
93.51
38.2
38.2
38.2
38.2
38.2
38.2
38.2
38.2
38.2
38.2
Moving onto the table, the comparison between various E gene sequence of the SARS-COV-2
virus strains and E gene sequences of the SARS-CoV 2003 and MERS virus strains 2012
collected from GenBank were shown. It is interesting to note that, the similarity percentage
between the E gene sequence of SARS-CoV-2 and SARS-CoV 2003 virus strains was very high,
approximately 93.51%, whereas the similarity proportion of the E gene sequence between SARSCoV-2 and MERS virus strains are quite low, only reached 38.2% . Therefore, the detailed
comparison of the N gene sequence between SARS-CoV-2 and SARS-CoV 2003 was performed.
10
MT127115
JX163928.1
20
30
40
50
60
70
80
90
100
....|....|....|....|....|....|....|....|....|....|....|....|....|....|....|....|....|....|....|....|
ATGTACTCATTCGTTTCGGAAGAGACAGGTACGTTAATAGTTAATAGCGTACTTCTTTTTCTTGCTTTCGTGGTATTCTTGCTAGTTACACTAGCCATCC
.......................A..............................................................C.............
110
120
130
140
150
160
170
180
190
200
MT127115
JX163928.1
....|....|....|....|....|....|....|....|....|....|....|....|....|....|....|....|....|....|....|....|
TTACTGCGCTTCGATTGTGTGCGTACTGCTGCAATATTGTTAACGTGAGTCTTGTAAAACCTTCTTTTTACGTTTACTCTCGTGTTAAAAATCTGAATTC
..................................................T.A........AA.GG.......C.....G.................C..
MT127115
JX163928.1
210
220
230
....|....|....|....|....|....|.
TTCTAGAGTTCCTGATCTTCTGGTCTAA
....GA..GAGT.CC.GA...TC.GGTCTAA
Figure 6: Genetic variation analysis of E gene of studied strain compared with
JX163928.1 Sars-CoV virus strains collected from Genbank
Fig 6. illustrated the E gene sequence of the studied SARS-CoV-2 strain and the SARS-CoV
2003 strain DQ182595.1 SARS ZJ0301 collected on GenBank. It could be plainly seen that the
similarity percentage of 2 E gene sequence was reached 93.51% as well as there were 30 different
positions between two sequences.
4.1.4 N gene analysis
Similarly, the sequence analysis and phylogenetic tree analysis based on the N gene sequence is
also play a crucial role to evaluate the genetic variation of SARS-CoV-2 circulating in the world
as well as contribute a handsome opportunity to develop the vaccines treatment of SARS-CoV2.
210
MT127114.1
MT447168.1
MT407659.1
MT374108.1
LC547533.1
MT678839.1
MT470125.1
MT077125.1
MT637144.1
MT637144.1
MT126808.1
220
230
240
250
260
270
280
290
300
....|....|....|....|....|....|....|....|....|....|....|....|....|....|....|....|....|....|....|....|
TCGAGGACAAGGCGTTCCAATTAACACCAATAGCAGTCCAGATGACCAAATTGGCTACTACCGAAGAGCTACCAGACGAATTCGTGGTGGTGACGGTAAA
....................................................................................................
....................................................................................................
....................................................................................................
....................................................................................................
..........................................C.........................................................
....................................................................................................
....................................................................................................
....................................................................................................
....................................................................................................
....................................................................................................
510
520
530
540
550
560
570
580
590
600
....|....|....|....|....|....|....|....|....|....|....|....|....|....|....|....|....|....|....|....|
MT127114.1
MT447168.1
MT407659.1
MT374108.1
LC547533.1
MT678839.1
MT470125.1
MT077125.1
MT637144.1
MT637144.1
MT126808.1
GCCAAAAGGCTTCTACGCAGAAGGGAGCAGAGGCGGCAGTCAAGCCTCCTCTCGTTCCTCATCACGTAGTCGCAACAGTTCAAGAAATTCAACTCCAGGC
................................................T...................................................
................................................T...................................................
................................................T...................................................
................................................T...................................................
................................................T...................................................
................................................T...................................................
................................................T...................................................
................................................T...................................................
................................................T...................................................
................................................T...................................................
610
MT127114.1
MT447168.1
MT407659.1
MT374108.1
LC547533.1
MT678839.1
MT470125.1
MT077125.1
MT637144.1
MT637144.1
MT126808.1
640
650
660
670
680
690
700
920
930
940
950
960
970
980
990
1000
....|....|....|....|....|....|....|....|....|....|....|....|....|....|....|....|....|....|....|....|
TGGCCGCAAATTGCACAATTTGCCCCCAGCGCTTCAGCGTTCTTCGGAATGTCGCGCATTGGCATGGAAGTCACACCTTCGGGAACGTGGTTGACCTACA
....................................................................................................
....................................................................................................
....................................................................................................
.......................................................A............................................
....................................................................................................
....................................................................................................
....................................................................................................
....................................................................................................
....................................................................................................
....................................................................................................
1010
MT127114.1
MT447168.1
MT407659.1
MT374108.1
LC547533.1
MT678839.1
MT470125.1
MT077125.1
MT637144.1
MT637144.1
MT126808.1
630
....|....|....|....|....|....|....|....|....|....|....|....|....|....|....|....|....|....|....|....|
AGCAGTAGGGGAACTTCTCCTGCTAGAATGGCTGGCAATGGCGGTGATGCTGCTCTTGCTTTGCTGCTGCTTGACAGATTGAACCAGCTTGAGAGCAAAA
....................................................................................................
.......AAC..........................................................................................
.......AAC..........................................................................................
.......AAC..........................................................................................
....................................................................................................
.......AAC..........................................................................................
....................................................................................................
.......AAC..........................................................................................
.......AAC..........................................................................................
....................................................................................................
910
MT127114.1
MT447168.1
MT407659.1
MT374108.1
LC547533.1
MT678839.1
MT470125.1
MT077125.1
MT637144.1
MT637144.1
MT126808.1
620
1020
1030
1040
1050
1060
1070
1080
1090
1100
....|....|....|....|....|....|....|....|....|....|....|....|....|....|....|....|....|....|....|....|
CAGGTGCCATCAAATTGGATGACAAAGATCCAAATTTCAAAGATCAAGTCATTTTGCTGAATAAGCATATTGACGCATACAAAACATTCCCACCAACAGA
....................................................................................................
....................................................................................................
....................................................................................................
....................................................................................................
.................................................................................T..................
....................................................................................................
....................................................................................................
....................................................................................................
....................................................................................................
....................................................................................................
Figure 6: Genetic variation analysis of N gene of studied strain compared with other
reference strains collected from Genbank
The upper figure indicated that there was a huge similarity between the studied N gene sequence
and other reference N gene sequences of SARS-CoV-2 strains collected from GenBank, ranging
from 99.6% to 99.92%, which mean it was just only a few nucleotide differences. In detail, at
position of 243, strains MT678839.1 carried nucleotide C whereas the studied strains and other
reference strains collected from Genbank carried nucleotide T. At position of 549, while the
studied strain carried nucleotide C, the reference strains collected from Genbank carried
nucleotide T. From the position 608 to 610, the studied strain and 4 strains MT447168.1,
MT678839.1, MT077125.1, MT126808.1 had the same nucleotides which are GGG, whereas the
remaining contain nucleotides AAC. Thus, the the studied SARS-CoV-2 strain might have closer
relationship to the four strains listed above when we construct the phylogenetic tree. At position
of 951, strain LC547533.1 carries nucleotide A, different from all other strains that carry
nucleotide G. Finally, at the position of 1082, the strain MT678839.1 carries nucleotide T while
the remaining strains carry nucleotide A. Thus, this result shows that there had been a change in
the N gene sequence of the currently circulating SARS-CoV-2 virus strains.
Table 5: Comparison between various E gene sequence of the SARS-CoV-2 virus strains and E
gene sequences of the SARS-COV 2003 and MERS virus strains 2012 collected from GenBank
1
2
3
4
5
6
7
8
9
10
11
12
13
14
15
16
Description
MT126808.1 SARS-CoV-2/human/BRA/SP02/2020
MT077125.1 SARS-CoV-2/human/ITA/INMI1/2020
MT510726.1 SARS-CoV-2/human/USA/hCoV-19-USA-CA-UCSF-UC48/2020
MT447168.1 SARS-CoV-2/human/THA/SI204512-NT/2020
MT678839.1 SARS-CoV-2/human/KOR/CNUHV03/2020
MT637144.1 SARS-CoV-2/human/RUS/SCPM-O-cDNA-06/2020
MT470125.1 SARS-CoV-2/human/France/10063BI/2020
MT374108.1 SARS-CoV-2/human/TWN/CGMH-CGU-12/2020
MT407659.1 SARS-CoV-2/human/CHN/OS4/2020
LC547533.1 hCoV-19/Japan/P5-3/2020 RNA
AY323977.2 SARS HSR 1
AY864805.1 SARS BJ162
AY345986.1 SARS CUHK-AG01
MK062179.1 SARS Urbani isolate icSARS
JX163928.1 SARS Tor2 isolate Tor2/FP1-10895
FJ882938.1 SARS wtic-MB Positions 28100 to 29368
Per. ident
99.92
99.92
99.92
99.92
99.76
99.68
99.68
99.68
99.68
99.6
88.1
88.1
88.1
88.1
88.1
88.1