Analysis of gene expression
Bạn đang xem bản rút gọn của tài liệu. Xem và tải ngay bản đầy đủ của tài liệu tại đây (368.43 KB, 24 trang )
Analysis of gene
expression
8.1
Introduction
The varied phenotypes observed for both unicellular and multicellular
organisms result from differences in the genes and alleles that comprise the
genomes of each species. However, most cell types of a multicellular
organism, such as nerve cells, liver cells, bone cells and blood cells, also
show striking phenotypic variations. Similarly plant development is
governed by differential expression of genes in different tissues and cell
types. The DNA sequence of the genome in all cells is identical, but changes
in the methylation state of regions of the genome and regulation of
transcriptional processes leads to differential expression of cell-specific
genes during development. In modern biology, accurate analysis of gene
expression has become increasingly important not only in improving our
understanding of gene and protein functions but also to detect low-level
transcripts as part of biotechnological applications or in medical diagnosis
(1). The website />contains a useful introduction to comparative gene expression analysis.
For many years the conventional approaches to analyzing gene expression have been by Northern blot, in situ hybridization or RNAse protection
assays. While these are still used extensively, they are often time consuming and are relatively insensitive, making detection of rare transcripts
difficult or impossible. The development of PCR as a tool for analysis of gene
expression patterns and to detect rare transcripts has revolutionized the
sensitivity of gene expression analysis. It is now possible, using fluorescent
dyes, to perform real-time analysis of accumulation of multiple products to
provide more sophisticated information on relative levels of different gene
transcripts. Changes in gene expression of even more genes can be analyzed
in parallel by the use of microarrays which can allow several tens of thousands of gene probes to be investigated in a single experiment. This Chapter
outlines how PCR can be used to analyze gene expression patterns and will
describe current PCR techniques that allow quantitative gene expression
analysis, and cellular and subcellular detection of transcript levels. A major
technology for analysis of differential gene expression is real-time PCR and
Chapter 9 has now been devoted to this important topic.
8.2
Reverse transcriptase PCR (RT-PCR)
Analysis of gene expression requires accurate determination of mRNA
levels. But PCR is based on amplification of DNA rather than RNA, so how
8
186 PCR
can it be used for mRNA analysis? The answer is that first, mRNA is
converted into DNA using the well-known process of reverse transcription,
which is used by RNA viruses to convert their genomic RNA into a DNA
within the host cell; and second, PCR amplification is performed on the
resulting complementary DNA (cDNA).
Standard RT-PCR
Standard RT-PCR offers a rapid, versatile and extremely sensitive way of
analyzing whether a target gene is being expressed and can provide some
semi-quantitative information about expression levels. Theoretically RT-PCR
should be able to amplify one single mRNA molecule, although in practice
this is not likely to be a realistic goal. However, RT-PCR is an extremely
valuable tool when limited material, such as specific differentiated cells, is
available. In this context RT-PCR can be used either to detect specific
transcripts by using sequence-specific primers, or to create cDNA libraries by
using generic primers such as oligo-dT and either random oligonucleotides
or 5′-cap-specific primers such as the SMART II oligonucleotide (Clontech).
The following Sections describe the steps involved in RT-PCR.
The reverse transcriptase reaction
RT-PCR is based on the ability of the enzyme reverse transcriptase, an
RNA-dependent DNA polymerase, to generate a complementary strand of
DNA (first-strand cDNA) using the mRNA as a template. The reverse
transcriptase reaction can be performed on either total cytoplasmic RNA or
purified mRNA. It is important that no genomic DNA is present, as this will
also provide a template for the PCR amplification step. An appropriate
control for any contaminating DNA is a control reaction in which the
reverse transcriptase step is omitted. Many commercial kits generate highquality DNA-free total or mRNA preparations, or an RNAse-free DNAse I
digestion step can be included in the RNA extraction protocol. To analyze
a previously characterized gene the primers can be designed to amplify
across an intron, thus allowing simple identification of contaminating
genomic DNA that will contain the intron while the transcript will not.
This means DNA will give rise to a longer product than the RNA transcript.
The method is sometimes called intron-differential RT-PCR. The use of
purified mRNA is recommended since this generally gives rise to a higher
yield of first-strand cDNA. When analyzing low abundance transcripts the
use of purified mRNA is important for success since the relative concentration of the target mRNA will be much higher than when using total
cytoplasmic RNA. A wide variety of simple-to-use kits, based on the use of
oligo-dT annealing to the 3′-polyA tract of eukaryotic mRNAs, are available
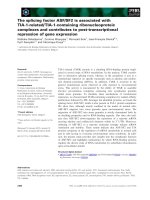
for purifying mRNA (Figure 8.1).
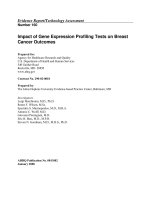
The next step is to copy the mRNA to first-strand cDNA (Figure 8.2). This
is often done using an oligo-dT primer that can anneal to the 3′-polyA tail
of eukaryotic mRNAs and allows reverse transcriptase to synthesize cDNA
from each mRNA molecule present in the reaction. This can be carried out
either using purified eluted mRNA or purified mRNA still attached to a solid
support matrix. There are two common types of reverse transcriptase; Avian
Analysis of gene expression 187
Solid
support – TTTTTTTTT
+
AAAAAAAAA
mRNA
Hybridization and purification
Solid
support
AAAAAAAAA
mRNA
–TTTTTTTTT
Reverse transcription
Solid
AAAAAAAAA
support –TTTTTTTTT
mRNA
cDNA
Purification
Solid
–TTTTTTTTT
support
cDNA
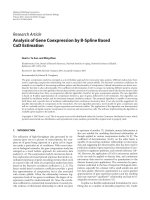
Figure 8.1
mRNA purification using an oligo-dT solid support matrix and subsequent firststrand cDNA synthesis.
Myeloblastoma Virus (AMV), reverse transcriptase and Moloney Murine
Leukemia virus (M-MLV) reverse transcriptase. Versions that allow efficient
copying of long mRNAs are available, for example the M-MLV RNase (H–)
that carries a point mutation (Stratagene, Promega). However, new enzymes
are being produced such as the Carboxydothermus hydrogenoformans
polymerase (Roche Applied Science), which displays reverse transcriptase
activity at a high reaction temperature between 60°C and 70°C. AMV-RT
has both 5′→3′ primer-dependent polymerase activity with either RNA or
DNA as template and a 3′→5′ RNAse H activity that degrades the RNA
portion of the RNA-DNA heteroduplex product of cDNA synthesis. The
M-MLV-RT is essentially identical to the AMV enzyme but it can only use
RNA as a template.
For a standard first-strand cDNA reaction using AMV-RT approximately
1 µg of total RNA or 10–100 ng mRNA should be used. Depending on the
abundance of the target mRNA species, the optimal amount of RNA may
need to be determined empirically by testing various starting amounts. A
standard reverse transcriptase reaction is described in Protocol 8.1.
Usually first-strand cDNA synthesis is very reliable and an aliquot of the
reaction can be taken immediately for PCR amplification. However, if there
is any doubt about the quality of the mRNA or the cDNA synthesis reaction,
or you fail to obtain a PCR product, the success and efficiency of the reverse
transcriptase reaction should be monitored. For example, if no PCR ampli-
188 PCR
fied product is detected it is important to know whether this is due to the
failure of the first-strand cDNA synthesis reaction or of the PCR reaction.
If a gene-specific primer to be used for the subsequent PCR step lies close
to the 5′-end of the gene, it is useful to know that reverse transcription has
yielded first-strand cDNA of appropriate length. If the abundance of the
transcript is extremely low it may be necessary to optimize the first-strand
cDNA synthesis conditions by varying mRNA and primer concentrations/
combinations. The simplest way of analyzing the efficiency of first-strand
synthesis is to substitute one of the nucleotides with a radiolabeled
nucleotide, such as [α–32P] dATP or dCTP that will be incorporated into the
cDNA, and then to calculate the final incorporation value by scintillation
counting. A less quantitative method, but one that provides information
on the size range of cDNA products, is gel electrophoresis. An aliquot of
the first-strand cDNA reaction can be fractionated through an agarose gel
after RNAse digestion to remove the template RNA. The first-strand
synthesis product will consist of single-stranded DNA so cannot be visualized efficiently using ethidium bromide. However, the radiolabeled cDNA
can be analyzed by autoradiography of the gel. This can be done directly
by covering the gel in plastic film and then exposing it to X-ray film or a
phosphorimager plate. Alternatively, the gel can be transferred to a
membrane, such as nitrocellulose, by using standard Southern blot
procedures (Chapter 5) and the membrane can be exposed to film or an
imager plate. If radiolabel was not included, the membrane or the agarose
gel can be stained using a single-stranded specific nucleic acid dye such as
SYBR Green II nucleic acid gel stain (Molecular Probes) or Fast RNA Stain‘
(HealthGene Corporation). A successful first-strand cDNA synthesis
reaction produced by oligo-dT priming should appear as a smear from a
position greater than 2 kb due to the heterogeneous mixture of cDNA
products. RNA markers can be used to help assess the size range of cDNA
products. Once the success of the first-strand cDNA reaction has been
verified the remainder of the reaction products can either be used directly
for PCR or stored at –80°C.
The analysis of RT-PCR amplification products is performed by the
detection methods described in Chapter 5. Despite the possibility of low
levels of amplification due to low initial concentrations of target transcript,
standard agarose gel electrophoresis and ethidium bromide staining is
usually sufficient to detect the final RT-PCR amplification product.
The PCR reaction
The next step is to amplify the cDNA by PCR as described in Protocol 2.1.
Appropriate upstream and downstream primers are used and can either be
specific to the target gene, or, for cDNA library construction, generic. Due
to the single-stranded nature of the first strand cDNA, the early cycles of
the PCR involve linear amplification as the first strand can only act as
template for one of the primers. Exponential amplification from both
primers occurs once sufficient copies of the second strand have been
generated. In practice this has no effect on the final PCR amplification yield.
In some cases, particularly when transcript levels are low, some
optimization of PCR conditions will probably be necessary to obtain a
Analysis of gene expression 189
(A)
dATP
dGTP
dCTP
dTTP
(T)nTTTTTTTTTT – 3'
Reverse
transcriptase
mRNA
(A)nAAAAAAAAA
Generation of
first-strand cDNA
(B)
3' First-strand cDNA
(T)nTTTTTTTTTT
5' Second-strand cDNA
Gene-specific
primer 1
3'
5'
3'
3'
Gene-specific
primer 2
PCR amplification
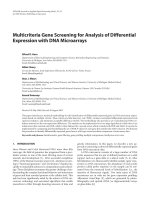
Figure 8.2
Diagram showing (A) reverse transcription from mRNA using an oligo-dT primer
and (B) second-strand cDNA synthesis.
convincing result. The optimization can of course be performed on the firststrand cDNA material but, if extensive optimization is required, this will be
very wasteful and will require the use of large amounts of reverse
transcriptase.
A more economical way of optimizing the PCR parameters is to use the
same reaction components as for the RT-PCR itself but using genomic DNA
or plasmid DNA containing either the genomic region or the cDNA of
interest. Of course by using double-stranded DNA for the optimization
experiments, the PCR conditions are not strictly mimicked, but should
allow you to determine the best temperature profiles and primer combinations for any given sample.
8.3
Semi-quantitative and quantitative RT-PCR
While standard RT-PCR can detect the presence or absence of mRNA species
it does not provide a quantitative measurement of levels of gene expression principally due to the ‘plateau effect’ described in Chapter 2. However,
by modifying the standard method RT-PCR can be used to quantify the
levels of mRNA in a sample or provide insight into the relative expression
levels between different cell types or in response to external stimuli.
Semi-quantitative RT-PCR
If relative differences in transcript levels are to be compared between different cell types, a semi-quantitative approach may be sufficient. The simplest
way of performing such analysis is to determine the amounts of PCR
product during the exponential phase of the PCR but before the plateau
phase (Chapter 2). While this approach does not give any absolute value
190 PCR
of the mRNA level in your starting sample it will readily detect differences
of 10–20-fold in mRNA levels between different samples. This method can
be useful for analyzing changes in the level of a target transcript in identical
tissue or cells in response to external stimuli. Of course valid comparisons
are only possible when the same primer combinations and reaction
conditions are used for all samples. The PCR experiments should be
performed in parallel at least twice to ensure that the results obtained are
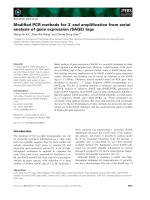
consistent and reproducible. An example of a semi-quantitative analysis
analyzed by agarose gel electrophoresis is shown in Figure 8.3.
An oligo-dT primer should be used for the first-strand cDNA synthesis
because eukaryotic mRNA molecules have a polyA tail, ensuring that the
level of cDNA synthesis reflects the level of the starting target mRNA. The
recommended way of determining the efficiency of cDNA synthesis is to
measure the incorporated level of radiolabeled nucleotides by scintillation
counting. Identical quantities (radioactivity counts per minute) of each
first-strand cDNA reaction should be used for PCR (Section 2.1). Aliquots
should be removed from each reaction during the PCR every 3–5 cycles for
the first 15–20 cycles. This ensures that the reaction is being sampled during
the exponential phase of the PCR and that the plateau is never reached.
Agarose gel electrophoresis may not be sufficiently sensitive to detect slight
differences in amplification levels between samples. In such cases Southern
blot analysis (Chapter 5) should be performed using either a DNA or an
oligonucleotide probe. For the detection of slight differences between high
abundance mRNA species it may be necessary to perform serial dilutions of
the RNA or PCR products to achieve the optimal range for accurate estimation of mRNA levels. For this purpose dot-blot analysis is recommended
as large numbers of samples can be analyzed simultaneously. The measure-
M
1
2
3
4
Figure 8.3
Agarose gel showing semi-quantitative RT-PCR analysis from plant RNA.
Amplification was performed using primers designed for an abundantly expressed
root gene. Lanes 1 and 2 represent RT-PCR of RNA from Arabidopsis thaliana
flowers using 10 (lane 1) and 15 (lane 2) amplification cycles. Lanes 3 and 4
represents RT-PCR of RNA from Arabidopsis thaliana roots using 10 (lane 3) and 15
(lane 4) amplification cycles.
Analysis of gene expression 191
ment of signal intensities can either be performed by densitometry measurements of X-ray films or by a phosphoimager. X-ray film has a major
limitation since even short exposures to different amounts of PCR product
can appear equally intense due to the nonlinear nature of X-ray film.
However, it can be useful if the amounts of PCR product are strikingly
different. If possible use a phosphoimager, as even small differences in
signal intensity can be accurately determined. If you do not have access to
a phosphoimager an alternative is scintillation counting of isolated
products on sections of the filter.
Virtual Northern blotting
Semi-quantitative analysis of gene expression profiles, either by Northern
blot analysis or by differential display (Section 5), can lead to apparent false
expression patterns and so it is best to perform an experiment based on an
alternative approach to verify the result. For example a differential display
result could be confirmed by Northern blot analysis or a Northern blot
result could be confirmed by an RNAse protection assay. However, the
bottleneck for such approaches is the requirement for microgram amounts
of RNA. To overcome this problem of the availability of material a new
approach involving an intrinsic PCR ‘amplification’ step has been incorporated into the Northern blot procedure creating a virtual Northern blot. The
approach was first described by Clontech and has now been used successfully in place of standard Northern blot analysis. The principle is to generate
full-length double-stranded cDNA and to incorporate an amplification step
to boost the measurable levels of ‘transcript’ in the form of cDNA. This
process requires between 50 and 500 ng of total RNA, which is significantly
less than is required for standard Northern blotting (2–10 µg). Clontech’s
SMART PCR cDNA synthesis kit facilitates production of high-quality
cDNA from total or polyA RNA as described more fully in Chapter 10
(Section 10.1).
In order to allow for semi-quantitative analysis it is important that the
PCR amplification does not reach the plateau phase (Chapter 2) thus ensuring that the differential expression profile is mirrored in the corresponding
amplified cDNA. ‘Test’ amplifications are required using different numbers
of PCR cycles so that optimal conditions are used for the transcript in
question. Following amplification, the cDNAs are size fractionated through
an agarose gel and subjected to Southern blot analysis. Figure 8.4 shows a
comparison of a standard Northern blot using 2 µg of polyA RNA and a
virtual Northern blot using 100 ng of total RNA. Virtual Northern blotting
has been used successfully for a number of gene expression studies and it
has been shown that as little as 100 cultured cells is sufficient to generate
more than 100 virtual Northern blots (2).
Quantitative RT-PCR
Since every PCR displays different reaction dynamics it is difficult to
compare semi-quantitative data from separate experiments, and comparisons of mRNA transcript levels from amplified genes using different
primer pairs cannot be made. More robust and reliable methods for mRNA
192 PCR
Testis
Prostate
Virtual Northern
Spleen
Testis
Prostate
Spleen
Standard Northern
Figure 8.4
Comparison of a standard Northern blot analysis using 2 µg of polyA RNA and a
virtual Northern blot using 100 ng of total RNA. (Reproduced with permission of
CLONTECH Laboratories Inc.)
quantitation rely on the use of internal standards and quantitative competitive RT-PCR.
Competitor PCR
A relatively simple approach to quantitative RT-PCR involves coamplification of both the target mRNA and a standard RNA in a single reaction using
primers common to both target and standard (Figure 8.5). As the standard
competes with the target mRNA for both primers and enzyme it is referred
to as a competitor or mimic (3). It is best to design an RNA competitor that
is slightly different in length from the target allowing simple and direct gel
determination of relative efficiencies of amplification. The competitor RNA
can be generated by T7 or SP6 directed in vitro transcription from a suitable
plasmid vector. The competitor should contain the same primer sites as the
target and can then be used to control for both cDNA synthesis and PCR.
Both the target and standard are primed with a gene-specific primer and
the cDNAs are then coamplified directly in the same tube using a single
primer pair. In practice several reactions are performed simultaneously with
different amounts of competitor RNA. The concentration of the target
mRNA can be determined as being equivalent to that of the competitor
when there is a 1:1 ratio of target and competitor products. One of the most
critical steps in this process is determining accurately the concentration of
the competitor RNA. The best and simplest way of doing this is by spectrophotometry. The absorbance of the transcribed competitor RNA, after
DNAse treatment, at 260 nm (A260) should be measured in triplicate and the
average will give a quantitatively accurate measure of the competitor RNA
concentration.
Controls and measurements
In all experiments that involve the quantification of mRNA levels it is
important to ensure the integrity of samples, and to ensure that normal-
Analysis of gene expression 193
T7 RNA
polymerase
Primer 1
Competitor DNA template
Primer 2
In vitro
transcription by
T7 RNA polymerase
Target RNA
Competitor RNA
Primer 2
Mix various quantities of
competitor with target
Reverse transcribe
Primer 1
Primer 2
Primer 1
Primer 2
PCR amplification
using primers 1 and 2
Competitor
Target
Competitor concentration
equal to target concentration
Figure 8.5
Principle of quantitative RT-PCR analysis using in vitro transcribed competitors. A
competitor is generated that can be distinguished from the target product upon
gel analysis. The RT-PCR reactions are spiked with known amounts of competitor.
The concentration of competitor that gives the same amount of product as the
target sample provides a measure of the amount of target mRNA in the original
sample.
ization between samples can be achieved. This is done by including the
analysis of a gene whose level should remain constant under all conditions.
For example actin is widely used as such a control. The levels of the mRNA
for this protein can be used to quantitate the amounts of mRNA produced
from a sample, and differences in signal intensity can be used to moderate
the levels of target gene signals. The measurement of signals from samples
separated through gels will depend on whether the DNA is labeled or not.
194 PCR
For standard DNA gels, it is possible to capture gel images using a CCD
camera and to analyze the intensity of the signals in each band by using
appropriate software, often supplied by the manufacturer of the imaging
equipment. These programs allow integration of the intensity of the band
and provide a numerical value for the level of signal. The use of a standard,
such as actin, allows the normalization of signal intensities. If the samples
are radiolabeled, such as for virtual Northern analysis, then the signals can
be measured by exposing X-ray film in a suitable cassette. It is important
that the bands are gray and do not become black during this exposure since
this prevents subsequent accurate quantification of signal intensities when
the film is scanned in a densitometer. For faster and more accurate analysis
use a phosphorimager, which has a much broader dynamic range than
X-ray film. It uses a storage phosphor autoradiography system, but some
instruments also offer direct fluorescence and chemifluorescence detection.
All systems come with associated software for accurately quantifying signal
intensities.
8.4
One-tube RT-PCR
RT-PCR protocols are not always successful. The major limitation is that
cDNA synthesis is commonly performed at 42°C, which does not eliminate RNA secondary structures. In addition, the two-step procedure
involving the first-strand cDNA synthesis step and then the PCR step can
result in potential contamination problems. New systems have been
developed where both the RT-PCR reaction and the subsequent PCR
reaction are carried out in the same tube. Details of such systems are
provided in Chapter 3. A further benefit is that in some systems cDNA
synthesis can be performed at high temperatures, which eliminates RNA
secondary structure. For example, the Titan one-tube RT-PCR system
(Roche) uses a reverse transcriptase and buffer that allows the cDNA
synthesis reaction to be performed at 60°C. The tube, now containing firststrand cDNA, can be directly subjected to PCR amplification, as the initial
reactants include a thermostable DNA polymerase. This system has been
used to successfully amplify cDNAs up to 6 kb in length from as little as
10 ng of total RNA.
8.5
Differential display
Differential display, first described by Liang and Pardee (4), allows rapid and
simultaneous display of the expression profiles of mRNAs from different cell
populations. The main steps include:
● reverse transcription using a 3′-anchored primer;
● PCR in the presence of α-35S dATP using an arbitrary 5′-primer;
● size fractionation of the amplified products and comparison of patterns
derived from different cell populations; and
● re-amplification and cloning of differentially expressed cDNA products.
Each step will be described in more detail, but for a comprehensive protocol
see the website />
Analysis of gene expression 195
Reverse transcription
The 3′-primer for reverse transcription is based on the polyadenylation
(polyA) tail found on eukaryotic mRNAs. An oligo-dT primer is used to
anchor the primer at the 3′-end of the mRNA to ensure directional firststrand cDNA synthesis. If you tried to compare all the transcripts at one
time the pattern would be extremely complicated and impossible to
interpret. To simplify the interpretation the oligo-dT primer is modified to
anneal to only a subset of mRNA molecules. At the 3′-end of the primer,
one or commonly two extra bases are included to select a subpopulation of
the mRNAs for amplification. This specificity of annealing shown below
also ensures that all products prime from the 3′-end of the transcript rather
than nonspecifically within the polyA tail:
mRNA 5′-NNNNNNNNNNNNAAAAAAAAAAAAAAAAAAAAAAAAAAAAAAAAAAAAAAA-3′
3′-NNTTTTTTTTTTTTTTTTTTTTT-5′
NN in the primers could be either AA, AG, AC, GA, GG, GC, CA, CG, CC,
AT, GT or CT, giving 12 different combinations of oligo-dT primer. Any
single primer will therefore anneal to one-twelfth of the total mRNAs in
the population. The use of all 12 primers in separate cDNA synthesis
reactions should amplify different subpopulations of the mRNA complement of the cells thereby allowing comparison of essentially all the
transcripts. The reverse transcription reaction is then performed as
described previously (Section 8.2). Further advances in primer design were
subsequently introduced. For example only a one-base anchor means that
only three primers of the general design N10T11C and N10T11A and N10T11G,
are required. In this case N10 represents a 10-nucleotide 5′-sequence
that includes a restriction site for subsequent cloning (5). The twonucleotide-anchor primers produce fewer bands per gel lane than the
single-anchor primers, but provide higher resolution of the product bands
(6).
mRNA 5′-NNNNNNNNNNNNAAAAAAAAAAAAAAAAAAAAAAAAAAAAAAAAAAAAAAA-3′
3′-ATTTTTTTTTTTGGAATTCCTA-5′
3′-GTTTTTTTTTTTGGAATTCCTA-5′
3′-CTTTTTTTTTTTGGAATTCCTA-5′
The PCR reaction
The main constraint in differential display is the separation and display of
products. Amplified cDNAs larger than about 500 bp will not be resolved
by standard polyacrylamide DNA sequencing gels. Thus it is important to
try to amplify fragments from each cDNA within 500 bp of the mRNA polyA
tail. This is most conveniently achieved using a short, essentially random
sequence 5′-primer that is 10 nucleotides in length (4). A range of such
primers is commercially available, for example from Operon Technologies.
The specificity of amplification also increases dramatically if the final dNTP
concentration is reduced to 2 µM compared with 200 µM used for standard
PCR reactions. The lower dNTP concentration also increases the efficiency
of incorporation of [α-35S] dATP, increasing the specific activity of the
generated fragments and consequently improving their detection. Differ-
196 PCR
ential display procedures normally require extensive optimization in order
to efficiently and clearly display cDNA differences. Optimization is very
important as the success of both the DNA elution and re-amplification
depends on the amount of cDNA generated during the first round of PCR.
A good way of optimizing the first round PCR is to take advantage of known
genes that are differentially expressed in the cells that you will use for the
‘real’ experiment. The value of such an internal control was demonstrated
with the murine thymidine kinase (TK) gene from tumorigenic cells (4).
Displaying the differentially expressed genes
Polyacrylamide gel electrophoresis can separate DNA molecules that differ
by as little as 1 bp in 500 bp and is therefore an appropriate method for
displaying differentially expressed genes. The gel system is the same as that
used for manual DNA sequencing (7). The accuracy and resolution of the
differential gene expression profiles depends to a large extent on the quality
of the polyacrylamide gel and generally a final polyacrylamide concentration of 6% is appropriate with an effective separation range of between 25
and 500 bp. Acrylamide and bis-acrylamide are both neurotoxins which can
enter the body by inhalation, if a powder, or through the skin, so extreme
care should be taken when handling these chemicals, and protective clothing, gloves and mask should always be used. Because of this we recommend
using commonly available ready prepared solutions.
Preparing the gel apparatus
A number of gel apparatus are commercially available and consist of two
glass plates (a ‘notched’ front plate and a complete back plate), plastic
spacers, a comb and a discontinuous electrophoresis buffer system.
Generally, a gel of 40 cm length and 20 cm width is used. The gel thickness is determined by the spacer thickness and is normally between 0.2 mm
and 0.6 mm. Thinner gels give increased resolution but are fragile, while
thicker gels are easier to handle, accept larger sample volumes, but are more
difficult to fix and dry. A gel thickness of 0.4 mm is recommended, which
gives good resolution, ease in post-run handling and is generally easy to fix
and dry.
Re-amplification and cloning
Once you are satisfied that there are cDNAs differentially expressed between
your samples it is time to perform the re-amplification and cloning of the
cDNA fragments. The re-amplification serves two purposes; first, it generates
sufficient cDNA to clone into a plasmid for further analysis, and second, it
serves as a control to demonstrate that the initial PCR amplification was
primer-specific. To perform the re-amplification the DNA must be eluted
from the dried gel by crushing the gel slice in elution buffer
( />The amount of cDNA available for re-amplification may be limiting and
a frequent problem when analyzing the PCR re-amplification is that no
product can be detected. This is not uncommon even after 40 rounds of
Analysis of gene expression 197
PCR and a third round of PCR amplification may be required. The problems
associated with re-amplification, described in Chapter 4, such as increased
probability of PCR-generated mutations, are not so important here since
differential display cDNA fragments will usually be used to screen a cDNA
library to isolate the full-length cDNA for further characterization.
However, by increasing the number of PCR rounds, the possibility of
amplifying nonspecific DNA fragments increases. This means that following cloning of the product, it is important to verify its differential
expression character by Northern blot analysis or RT-PCR (Section 8.3).
Advantages of differential display
The advantages of PCR-based differential display are:
● that differences in expression patterns can be readily visualized by
running different samples in parallel;
● the differentially expressed cDNAs can, in theory, be easily recovered,
cloned and sequenced;
● the displayed mRNA patterns are highly reproducible.
In addition, PCR-based differential display is technically much simpler and
quicker than the traditional techniques used for detecting differences in
gene expression patterns. After initial optimization, PCR-based differential
display only requires 2 days for differential band pattern visualization and
only 5 days for the subsequent elution, re-amplification and cloning.
Fluorescent differential display
The main drawback to differential display is that it makes use of hazardous
radioisotopes. Recent advances have overcome the use of radioisotopes and
manual autoradiography detection by incorporating fluorescent primers or
fluorescent dUTP into the PCR reaction as part of the differential display
protocol. The fluorescent signal can then be detected using an automated
fluorescent DNA gel imager (for example from Hitachi or Amersham
Biosciences) and the fluorescent signal can be analyzed using various software packages such as FMBIO (Hitachi). This technique has been termed
fluorescent differential display (FDD). The main advantages of FDD are: full
automation, which makes it cost effective in terms of time when optimizing the experimental protocol; no need for radiolabels; high level of
reliability; and consistency between duplicate samples. Conveniently,
fluorescently labeled universal primers can be used for virtually all experiments, thereby reducing the overall cost. Both fluorescein isothiocyanate
and rhodamine can be used as fluorescent tags. The FDD procedure is
essentially identical to standard differential display.
FDD has been used successfully for a number of applications such as the
identification of differentially expressed genes during neuroblastoma
differentiation (8) and in identifying differentially expressed genes in plants
in response to different light regimes (9). Recently it has been shown that
cloning of the differentially expressed fragments can be omitted. After
excision of FDD bands from the polyacrylamide gel these are separated on
an agarose gel containing a base-specific DNA ligand which separates
198 PCR
equally sized fragments differing in base composition. It has been shown
that most of the cDNA fragments selected using this method can be directly
sequenced and subsequent Northern blot analysis reveals them to have
differential expression patterns (10).
8.6
PCR in a cell: in situ RT-PCR
The concept of performing PCR to detect gene expression patterns inside
single cells or even specific intracellular organelles would have been unbelievable only a few years ago. In situ RT-PCR follows the same principle
as RT-PCR but instead of being performed in a test-tube the reaction occurs
inside cells or even at specific intracellular locations showing organellespecific gene expression.
Principle
In situ RT-PCR detects gene expression profiles at the cellular and subcellular level. In essence the technique is carried out on the biological
sample usually immobilized on a glass slide. In situ RT-PCR therefore has
the sensitivity of standard RT-PCR but also the spatial resolution of in situ
hybridization. The technique can be divided into several main steps including:
●
●
●
●
sample preparation;
in situ first-strand cDNA synthesis;
in situ PCR using either labeled primers or unlabeled primers; and
in situ hybridization or detection.
The following Sections outline these different steps whilst more detailed
information can be found at />nuovo1/htmls/list.htm.
Sample preparation
Preparing a sample for in situ RT-PCR is slightly more time consuming than
preparing samples for standard RT-PCR as they must maintain cellular
integrity during first-strand cDNA synthesis, PCR and product detection. To
achieve this, samples are normally prepared on glass slides to allow
sufficient heat transfer during the RT and PCR steps. Depending on the
tissue or sample there are a number of standard sample preparation steps
that should be followed. To maintain cellular integrity the tissues should
be fixed in 2–4% paraformaldehyde or 2–3% glutaraldehyde solutions. Once
fixed the tissue must be sectioned, usually by embedding in paraffin-based
waxes, followed by standard µm-range sectioning. The tissue sections are
placed on silane-coated in situ PCR slides and allowed to dry at room
temperature for several days. The sections are then deparaffinized, incubated
in xylene and dried at room temperature.
The cells must be permeabilized to allow entry of reactants for the
subsequent RT-PCR analysis which is normally achieved by pre-treating
sections with proteinases such as proteinase K or pepsin. It must be stressed
that proteinase treatment should be optimized for each sample type, since
Analysis of gene expression 199
over-digestion will result in loss of cellular integrity while under-digestion
will render the sections impermeable to reaction components. A recommended starting point is incubation with 5 µg ml–1 proteinase K for 30 min
at 37°C followed by heat inactivation at 95°C for 5 min.
As for standard RT-PCR, it is important to remove any contaminating
DNA which can potentially interfere with the RT-PCR reaction. The removal
of DNA for in situ RT-PCR is extremely important since product detection
is not based on size determination, which eliminates the possibility of using
intron-spanning primers. Sections should therefore be treated with RNAsefree DNAse. At this stage it is also important to include RNAse inhibitors
to avoid RNA degradation. It has been shown that the precise adjustment
of the DNAse concentration and incubation time is essential for reliable
and reproducible results when performing in situ RT-PCR (1). The efficacy
of DNAse treatment varies between different cell lines and it is more appropriate to fine-tune the incubation time rather than DNAse concentrations.
Attachment of samples to glass slides
As described above, in most cases in situ RT-PCR involves fixing samples to
glass slides. It is important that samples remain attached to the glass slides
throughout the entire experimental procedures. This requires the attachment procedure to be thermostable and chemically inert. The use of
silane-coated slides for in situ PCR studies was first described by Dyanov and
Dzitoeva (11). It allows rapid and irreversible sample attachment where more
than 95% of the material remains attached after in situ PCR and in situ
hybridization procedures. For most applications, silane A-174 (Bind-Silane;
Amersham Pharmacia Biotech) together with γ-methacryloxypropyltrimethoxy-silane (Sigma Chemicals) provides a very strong adhesive for a
wide range of samples. For most single cell applications it is advisable to
perform the fixation and permeabilization on the glass slides. Fixed and
paraffin-embedded sections are generally easy to transfer to silane-coated
glass slides. The attachment of whole organs to glass slides has obvious size
limitations. Whole organs from, for example, Drosophila melanogaster have
been successfully attached to glass slides and subjected to in situ RT-PCR
experiments (11). The attachment process is essentially identical to the
attachment procedure used for tissue sections.
In situ thermal cyclers
There are an increasing number of instruments available for in situ PCR
applications and these are designed to accept multiple slides and to provide
optimized thermal exchange for in situ applications (Chapter 3).
In situ first-strand cDNA synthesis
The in situ first-strand cDNA synthesis reaction is essentially identical to
standard first-strand cDNA synthesis described in Section 8.2. One limitation is that the absolute level of mRNA is not controllable and this may,
in cases of low mRNA levels, result in a low yield of first-strand cDNA
molecules. This is normally not a problem and an example illustrating this
200 PCR
is the successful detection of insulin-like growth factor-IA (IGF-1A) mRNA
from human lung tumor cell lines (12). IGF-1A mRNA levels are present at
extremely low levels in these cell lines (13), which limited the use of
standard in situ hybridization protocols and Northern blot experiments.
However, by carefully optimizing in situ RT-PCR protocols it was possible
to detect IGF-1A mRNA species and detect their cellular location.
The in situ first-strand synthesis reaction can be performed using random
primers, an oligo-dT primer, gene-specific primers, or a combination of
these. Random primers will generate a vast array of differently sized singlestranded cDNA fragments which in turn will act as templates for the in situ
PCR reaction. In most cases the randomly generated DNA fragments will
span the region to be subsequently amplified; however it is possible that
the majority of DNA fragments generated lie outside of the desired PCR
amplification area. To ensure that the region of DNA to be subsequently
amplified is present in the first-strand cDNA, it is recommended that either
an oligo-dT or a gene-specific primer be used. As described in later parts of
this Section, product detection can be achieved by indirect in situ hybridization or by using labeled primers for the in situ PCR. If in situ hybridization
is the method of choice we advise the use of both oligo-dT and random
primers to maximize the efficiency of the first-strand reaction. However, if
labeled primers are to be used it is advisable to use gene-specific primers or
an oligo-dT primer.
For the first-strand cDNA synthesis reaction a premix consisting of
reaction buffer, dNTPs, RNAse inhibitor, the primer or primer set of choice
at a concentration of 200 pmols and the reverse transcriptase. The premix
is added to the sample on the in situ PCR slide and ‘sealed’ in a chamber.
The chamber can be constructed with silicon spacers that surround the
sample followed by sealing with a second glass slide. Alternately, specialized in situ glass slides, cover slips, and cover discs can be purchased from
a number of commercial sources such as PE Biosystems and Hybaid. Once
sealed the reaction should be allowed to proceed at 42°C for 1 h, or at a
higher temperature if a thermostable reverse transcriptase is used.
In situ PCR
After first-strand cDNA synthesis the cover disc should be removed, the
samples rinsed briefly in phosphate buffered saline (PBS) and the PCR
premix added to the sample, and the chamber resealed. The PCR premix is
essentially the same as for standard PCR containing the reaction buffer,
dNTPs, gene-specific primers, and Taq DNA polymerase. Although the in
situ PCR cycling conditions will not vary a great deal from standard PCR
conditions some degree of optimization of reactant concentrations and
amplification conditions may be required. For example, the number of
amplification cycles required for in situ PCR is normally lower than for
standard PCR. In general, 15–20 cycles are sufficient, with an increase in
cycle number often having a detrimental outcome with the signal losing
its ‘crisp’ appearance and becoming more diffuse due to excess final product
(12).
Once the in situ PCR has been completed the reaction chamber should
be rinsed thoroughly with PBS. There are two main ways in which to detect
Analysis of gene expression 201
the in situ PCR-generated amplification products and these are described in
the following Sections.
In situ hybridization
In situ hybridization is well established and has been optimized for a
number of different biological systems. Some common applications include
detection of gene expression patterns at the cellular level, cellular detection
of pathogen DNA, detection of DNA rearrangements in single cells and
analysis of both legitimate and illegitimate recombination events. The
power of in situ hybridization makes it an obvious method for product
detection as part of the in situ RT-PCR protocol.
The basic principle of in situ hybridization is the ability of a labeled nucleic
acid fragment to ‘seek out’ and hybridize to a complementary nucleic acid
sequence. The method is extremely versatile and by applying only slight
modifications it can be used to detect either perfectly homologous nucleic
acid sequences (high-stringency conditions) or heterologous stretches of
nucleic acids (low-stringency conditions). When using in situ hybridization
as part of the in situ RT-PCR protocol, high-stringency conditions are always
required so that only DNA sequences generated as part of the in situ PCR are
detected. High-stringency conditions will also minimize nonspecific background hybridization.
A variety of different labels, varying from radiolabels to enzymatic
components, can be conjugated to probes, with enzyme-conjugated probes
being the most common for in situ RT-PCR applications.
Alkaline phosphatase
There are several different commercially available enzyme-linked labels that
can be incorporated into nucleic acids. Alkaline phosphatase (AP) is widely
used for in situ RT-PCR applications and several chromogenic substrates
such as 5-bromo,4-chloro,3-indolyl phosphate (BCIP) and nitro blue tetrazolium (NBT) are cleaved by the enzyme to generate a visible dense blue
insoluble precipitate. Both BCIP and NBT are stable as stock solutions. AP
can be linked to DNA fragments in different ways. A common and efficient
method is to conjugate avidin-bound biotinylated AP to the generated
probe, and several manufacturers offer kits for such enzyme–DNA probe
conjugation. Enzyme-linked probes can be stored for extended periods at
4°C. The DNA probes for in situ hybridization reactions are normally
generated by PCR amplification or restriction digestion of a plasmid
followed by gel purification as described in Chapter 6.
Once the probe has been labeled the in situ hybridization reactions can
be performed. It is important to prehybridize the sample to minimize
nonspecific hybridization. Prehybridization makes use of a blocking agent
such as sonicated salmon sperm DNA or calf thymus DNA to ‘mask’ nonspecific targets for the probe. The prehybridization buffer should be of the
same composition as the hybridization buffer with the exception of the
added probe. A ‘standard’ hybridization buffer, for an enzyme-conjugated
probe, consists of 1 × PBS and sonicated ‘blocking’ DNA at a final concentration of 200 µg ml–1. Samples should be incubated in prehybridization
202 PCR
buffer at 37–40°C for 2–5 hours with gentle shaking followed by careful
rinsing in hybridization buffer and addition of fresh hybridization buffer
containing the denatured labeled probe. The labeled probe must be added
to the hybridization buffer (2–5 µg ml–1) before adding it to the sample to
eliminate high probe concentrations at the site of application. The
hybridization reaction should be performed at the same temperature as the
prehybridization for between 8 and 16 hours. However, to limit potential
loss of cellular integrity and minimize loss of enzyme activity the
incubation times should be kept to a minimum.
Post-hybridization washes are important to remove nonspecifically
bound probe molecules. The substrates NBT or BCIP can then be added in
the reaction buffer. AP requires a basic pH for optimal activity and the
buffer contains 100 mM NaCl, 50 mM MgCl2, and 100 mM Tris, pH 9.5.
The reaction should be performed in the dark for between 10 and 15
minutes or until visible staining appears. The reaction can be stopped by
extensive washing in PBS containing 20 mM EDTA followed by viewing
using bright-field microscopy.
Indirect detection of incorporated labels
Another well-documented method of product detection as part of in situ
RT-PCR is the use of modified nucleotides followed by antibody detection.
For in situ RT-PCR applications, as for many other applications, digoxigenin11-2′-deoxyuridine-5′triphosphate (DIG-dUTP) is commonly used as the
modified nucleotide. Digoxigenin is a steroid hapten found only in Digitalis
plants so background problems are minimal. DIG-dUTP is incorporated into
DNA as part of the PCR (Chapter 3) and the amplification products can be
analyzed by agarose gel electrophoresis (Chapter 5) and gel purified (Chapter
6) for use as a probe (Figure 8.6). The DIG-labeled probe can be used for the
hybridization steps as described above, but normally at a higher temperature
such as 65°C. After hybridization and post-hybridization washes the samples
should be incubated at room temperature with an AP-conjugated anti-DIG
antibody for 1 h. After extensive washing with PBS, product detection is
performed using NBT or BCIP. One limitation when using anti-DIG antibodies is background staining in complex tissues due to antibody ‘trapping’.
However, by including appropriate controls, false staining patterns can
normally be identified.
Labeled primers and direct detection
Recent developments have eliminated the need for post-PCR in situ
hybridization. Direct detection of the in situ RT-PCR products can be
achieved using primers carrying a fluorescent label, usually fluorescein, in
the final PCR reaction (14). An example of the use of fluorescein-labeled
primers for final product detection is illustrated by detection of tumor
necrosis factor (TNF). The mammary carcinoma cell line MCF-7 harbors the
TNF-α gene but does not express TNF mRNA. To achieve TNF expression
the cell line has to be transduced with a retrovirus containing the cDNA
for the human TNF gene. This system was chosen by Stein et al. (1) to
develop a one-step in situ RT-PCR protocol. To check for successful TNF
Analysis of gene expression 203
PCR amplification + DIG-dUTP
DIG
DIG
DIG
Hybridization
DIG
DIG
DIG
Incubate with
anti-DIG antibody
AP
AP
AP
DIG
DIG
DIG
DETECTION
Figure 8.6
Labeling of a PCR-amplified probe with DIG as part of in situ RT-PCR indirect
detection of gene expression.
expression standard RT-PCR was performed showing specific amplification
of the TNF gene. For in situ RT-PCR the transduced cell line was grown,
fixed and DNAse treated. M-MLV reverse transcriptase was used together
with random hexamer primers for the in situ RT reaction. For in situ PCR a
3′-unlabeled TNF-specific primer was used together with a 5′-fluoresceinlabeled TNF-specific primer, both at 1 µM concentration. The PCR was
performed in situ using a GeneAmp In Situ System 1000 thermal cycler (PE
Biosystems). Slides were washed in PBS and the final amplification product
visualized by fluorescent microscopy (absorbance wavelength 495 nm and
emission wavelength 525 nm). This technique proved to be reliable and
reproducible and did not generate any ‘false’ positive results due to nonspecific amplification as shown when the nontransduced cell line was used
as a negative control. Also, as for any PCR, single primer controls, no primer
controls and no DNA polymerase controls were performed confirming
gene-specific amplification. This elegant technique can be modified by
204 PCR
using different fluorescent labels for different primer sets, which should
make it possible to detect several expressed genes in one reaction.
As labeled primers can be expensive it is advisable to first produce an unlabeled primer set which should be used for the optimization of in situ PCR
conditions. One of these primers can subsequently be used as the unlabeled
primer for the ‘real’ experiment. The cost of having one unlabeled primer is
minimal if it ensures that the expensive labeled primer will function
efficiently. Optimization of conditions, such as annealing temperature and
extension times, can be performed on genomic DNA or on in vitro generated
first-strand cDNA, which makes the procedure rapid and easy to perform.
Once optimized, the conditions can be transferred to the in situ RT-PCR
protocol.
8.7
Microarrays
With the increasing availability of genome sequence information it has
now become possible to interrogate the gene expression patterns in
particular cells. To investigate which genes are expressed in particular cell
types, or which genes are altered in their expression in response to some
external stimulus or disease state, it would be useful to have a method for
global analysis of gene expression. A DNA microarray represents an array
of DNA sequences representing large numbers of genes, immobilized on a
solid support, such as a nylon membrane, glass slide or silicon chip. The
array must be prepared so that the identity of the sequence at each spot is
known. The DNA samples spotted onto the support can be either cDNA
sequences, which can be produced by PCR, or oligonucleotides. In the case
of Affymetrix gene chips the oligonucleotides are actually synthesized in
situ on the slide at defined locations.
The microarray chip is then interrogated by measuring the ability of
mRNA molecules to bind or hybridize to the DNA template that produced
it. Since the array contains many DNA sequences it is possible to determine
from a single experiment the expression levels of hundreds or thousands
of genes within a sample by measuring the amount of mRNA bound to each
spot (or sequence) on the array. Usually the experiment is performed as a
competition hybridization between two samples of mRNA, one from a
control sample and one from the test sample. These mRNAs are used to
produce cDNA populations that are differently labeled by addition of a
fluorescent tag, say green for the control and red for the test sample. If there
is more of a particular sequence in the control sample, the spot will be
green, indicating that expression of the gene was reduced in the test sample.
This is because more of the sequences that are available for hybridization
to the chip sequence will be labeled green, and so more of these sequences
will hybridize compared with the lower concentration red sequences.
Conversely if the gene shows increased expression in the test sample the
spot will be red, while if there is no difference in expression between the
two samples the spot will be yellow indicating roughly equal amounts of
both sequences have hybridized to the chip.
After the hybridization process the microarray slide is placed in a scanner
that contains a laser to excite the fluorescent tags on the cDNAs; the resulting fluorescence is detected by a microscope and camera that captures an