(Luận văn thạc sĩ) technical efficiency of vietnam rice farms a stochastic frontier production approach
Bạn đang xem bản rút gọn của tài liệu. Xem và tải ngay bản đầy đủ của tài liệu tại đây (2.22 MB, 86 trang )
UNIVERSITY OF ECONOMICS
HO CHI MINH CITY
VIETNAM
·-
....
INSTITUTE OF SOCIAL STUDIES
THE HAGUE
THE NETHERLANDS
VIETNAM- NETHERLANDS
PROGRAMME FOR M.A IN DEVELOPMENT ECONOMICS
TECHNICAL EFFICIENCY OF
VIETNAM RICE FARMS
A STOCHASTIC FRONTIER
PRODUCTION APPROACH
By
NGUYEN THANH DONG TRINH NGUYEN
MASTER OF ARTS IN DEVELOPMENT ECONOMICS
Ho Chi Minh, December 2011
UNIVERSITY OF ECONOMICS
HO CHI MINH CITY
VIETNAM
INSTITUTE OF SOCIAL STUDIES
THE HAGUE
THE NETHERLANDS
VIETNAM- NETHERLANDS
PROGRAMME FOR M.A IN DEVELOPMENT ECONOMICS
TECHNICAL EFFICIENCY OF
VIETNAM RICE FARMS
A STOCHASTIC FRONTIER PRODUCTION
APPROACH
A thesis submitted in partial fulfilment of the requirements for the degree of
MASTER OF ARTS IN DEVELOPMENT ECONOMICS
By
NGUYEN THANH DONG TRINH NGUYEN
Academic Supervisors
DR. NGUYEN TRONG HOAI
DR. PHAM LE THONG
Ho Chi Minh, December 2011
CERTIFICATION
"I certificate that the substance of the thesis has not already been submitted for
any degree and is not currently submitted for any other degree.
I certify that to the best of my knowledge and help received in preparing the
thesis and all sources used have been acknowledged in the thesis."
Signature
Nguyen Thanh Dong Trinh Nguyen
Date:
ACKNOWLEDGMENTS
Firstly, I would like to say thank you to Dr. Nguyen Trong Hoai and Dr. Pham
Le Thong - my academic supervisors, for their devoted recommendation.
Without their precious advice and instruction, I could not complete this thesis.
By the way, I am very proud to attend this program. Every teacher sets an
example of hard working for me and other students to follow. And I will never
forget the support from all employees of the program. Their enthusiastic and
friendly attitude makes me feel comfortable to study and research.
Moreover, I received the enormous and continue encouragement from my
closed friends and my family, especially my mother. Their loves have given me
more strength and belief to overcome difficulties during the studying.
I am very grateful for everything that all of you gave me. How can I pay your
debt of gratitude!
Nguyen Thanh Dong Trinh Nguyen
ii
ABSTRACT
The research investigates the technical efficiency level and determinants of rice
production in Vietnam. The analysis employs the Vietnam Household Living
Standard Survey 2008 data set and stochastic production frontier approach. The
mean technical efficiency level is 80%. Credit approach, land policy, and
experience are not significant elements of technical efficiency models while the
irrigation, promotion program, education and gender of household head are
significant ones.
Key words: technical efficiency, rice production, stochastic production frontier.
111
TABLE OF CONTENT
CERTIFICATION ................................................................................................ i
ACKNOWLEDGMENTS .................................................................................. ii
ABSTRACT ...................................................................................................... iii
TABLE OF CONTENT .................................................................................... iv
LIST OF FIGURES ........................................................................................... vi
LIST OF TABLES ............................................................................................ vi
LIST OF ABBREVIATION ............................................................................ vii
CHAPTER I INTRODUCTION ........................................................................ 1
1.1 Problem Statements ....................................................................................... 1
1.2 Research Objectives ...................................................................................... 5
1.3 Research Questions and Hypotheses ............................................................. 5
1.4 Research Methodology .................................................................................. 6
1.6 Thesis Structure ............................................................................................. 6
CHAPTER II LITERATURE REVIEW ON TECHNICAL EFFICIENCY
AND CONCEPTUAL FRAMEWORK .............................................................. 8
2.1 Key Concepts ................................................................................................. 8
2.1.1 Technical Efficiency ............................................................................ 8
2.1.2 Production Frontier .............................................................................. 9
2.1.3 Stochastic Production Frontier .......................................................... I 0
2.2 Approaches to Measure Technical Efficiency ............................................. 11
2.2.1 Data Envelopment Analysis .............................................................. 11
2.2.2 Stochastic Frontier Analysis .............................................................. 12
2.3 Stochastic Frontier Analysis Framework .................................................... 12
2.3.1 Stochastic Frontier Model ................................................................. 12
2.3.2 Estimation method ............................................................................. 14
2.4 Empirical Studies ......................................................................................... 15
2.5 Conceptual Framework ............................................................................... 25
CHAPTER III RESEARCH METHODOLOGY FOR TECHNICAL
EFFICIENCY AT THE FAMRS LEVEL. ........................................................ 31
3.1 Data Source ................................................................................................. 31
3.2 Models Specification and Variables Definition .......................................... 31
IV
3 .2.1 Stochastic Frontier Production Function ........................................... 31
3.2.2 Efficiency Model: .............................................................................. 38
CHAPTER IV RESULTS AND DISCUSSION .............................................. .45
4.1 Results of Data Analysis ............................................................................. 45
4.1.1 Stochastic Frontier Production Function ........................................... 45
4.1.2 Efficiency Model ............................................................................... 49
4.2 Results Discussion ....................................................................................... 52
4.2.1 Discussion on Determinants of Stochastic Frontier Production
Function ...................................................................................................... 52
4.2.2 Discussion on Determinants of Technical Efficiency ....................... 54
CHAPTER V CONCLUSION AND RECOMMENDATION ........................ 60
5.1 Conclusion ................................................................................................... 60
5.2 Policy recommendation ............................................................................... 61
5.3 Research limitation and further studies ....................................................... 63
REFERENCE .................................................................................................... 64
APPENDIX ....................................................................................................... 69
v
LIST OF FIGURES
Figure 2.1: Technical Efficiency ......................................................................... 9
Figure 2.2: Production Frontier ......................................................................... I 0
Figure 2.3: The Stochastic Frontier Production Function ................................. 11
Figure 2.4: Conceptual Framework ................................................................... 26
Figure 4.1: Distribution of Technical Efficiency .............................................. 56
LIST OF TABLES
Table 2.1: Summary of Empirical Studies ........................................................ 22
Table 3.1 : Definition of Variables in Stochastic Frontier Production Function32
Table 3.2: Definition of Variables in Technical Efficiency Model... ................ 38
Table 4.1: Statistical Summary of Variables in Frontier Model ...................... .45
Table 4.2: Maximum Likelihood Estimation of Stochastic Frontier Production
Function ............................................................................................................. 46
Table 4.3: Statistical Summary ofVariables in Efficiency Model ................... 49
Table 4.4: OLS -Robust Model of Technical Efficiency Determinants .......... 51
Table 4.5: Statistical Summary of Technical Efficiency Level ........................ 55
Table 4.6: Distribution of Technical Efficiency ................................................ 55
vi
LIST OF ABBREVIATION
COLS
Corrected Ordinary Least Squares
DEA
Data Envelopment Analysis
FAOSTAT
Food and Agriculture Organization of the United NationsStatistics Division
GDP
Gross Domestic Production
GOY
government of Vietnam
GSO
General Statistics Office of Vietnam
IPCC
International Panel of Climate Change
MLE
Maximum Likelihood Estimation
MOLS
Modified Ordinary Least Squares
OLS
Ordinary Least Squares
SBV
State Bank of Vietnam
TE
Technical Efficiency
USDA
US Department of Agriculture
VHLSS
Vietnam Household Living Standard Survey
VND
Unit Currency of Vietnam- Vietnam Dong
vii
CHAPTER I
INTRODUCTION
1.1 Problem Statements
•
Agriculture is an important sector in Vietnam economy. Agriculture accounts for
I8.2% of the country's gross domestic product in 2009. In 2008, agricultural export
accounts for I2.3% of total export value of the country. In 2009, the proportion of
labor force in agriculture, forestry and fishery sector is 62.9%. Rural population
proportion was around 7I% (FAOSTAT, 20IO) and rural labor force made up 58.5
%of the total labor force (GSO, 20I 0).
Rice is one of the most important crops in agricultural production with the highest
cultivating area of food production. Rice production is ranked at the fifth in the
world. Rice yield contributes 90% food production, and is related to 80% labor
force of Vietnam. In 20 I 0, domestic rice production of whole country was about 40
million tons from 7,500 thousands hectares of cultivated area with average yield of
over 5 tons/ha (GSO, 20IO). Vietnam annual per capita of rice consumption is very
high, I69 kg/person/year (Laillou et. al, 20 I 0), producing about I ,59 I calorie intake
- 60% in 2007 (Timmer, 20 I 0).
Rice has been a Vietnam's principal agricultural export and a great source of
foreign exchange. Value of exported rice accounts about 20% of agricultural and
forestry products. Vietnam has exported rice to I20 countries and its share in global
market is about 20%, ranked at the second in the world (USDA, 20 I I). In 20 I 0,
Vietnam has exported 6.88 million tons of rice worth US$3.23 billion. In
comparison with the year 2009, the quantity was increased I5.4 percent and the
value was increased 21.2 percent (GSO, 20IO).
Being a tropical subequatorial country, Vietnam has favorable natural conditions for
rice cultivation. Farmers can sow, plant, cultivate and harvest three crops per year.
The country has two even and flat deltas irrigated by interlaced system rivers
broadly with alluvial water flows. Humid climate associated with rainfall in all year
round are favorable for rice cropping. Moreover, Vietnam was one of cradles of wet
rice growing with long tradition.
Vietnamese farmers have to deal with many difficulties. Land for rice cultivation
increased from 6 million ha in 1990 to 7.6 million ha in 2000. Then it has been
narrowed down gradually to 7.4 million ha in 2009 (GSO, 2010). On average, 73.3
thousands hectares of agricultural land was retrieved for other purposes each year.
In the last 5 years, total agricultural area retrieved in the whole country was 154,000
hectares. It reduced 7.6% land of rice cultivation. This trend will be continued
because of increasing land demand for urbanization and other purposes. By 2020,
the rice land area shall be kept at 3.8 million ha (GOY, 2009). It means that land for
rice growing will be reduced nearly a half of existing area, while as predicted by
GSO (20 10), total population of Vietnam in 2020 will be between 94 million and 98
million, increases by 10% -14% compared with the year 2009. National food
security will be a priority issue, and ability of export will be reconsidered again.
On the other hand, farm land is highly fragmented and separated as a result of
history. Average land size belonged to each household is about 1 hectares to 4
hectares. In the past, government delivered land for households with egalitarianism
in area and kind of land. Land tenure is short (50 years for perennial plants and 20
years for annual crops). Annual cropping allocated agricultural land for under the
Land Law 1993 will expire in 2013. It raises high concern of security of agricultural
land tenure for farmers.
Farmers are facing challenges of climate change causing higher sea level, deeper
and lasting flood, more intrusion of salty water on the land. Unpredictable weather
2
induces droughts, floods and frost and increases the risks of epidemic diseases.
Climate changes reduced 1.3-1.5% GDP of Vietnam, and agriculture is the most
suffered sector. Vietnam has 3,260 km of coast along the east side from the North to
the South. Mekong River Delta and Red River Delta are two agricultural areas most
severely affected by climate changes and sea level rise. These are two main rice
cultivating regions with 70% output of the whole country (GSO, 201 0). Incomes of
farmers of these regions largely come from rice production. And rice production of
these regions secures for national food and supplies remarkable grain for
international market. The one-meter rise of sea level will affect 12% area and 10%
population of Vietnam, submerge 5,000 km 2 of Red River Delta and 15,000 20,000 km2 of Mekong River Delta, corresponding to 300,000- 500,000 hectares of
Red River Delta and 1.5-2 million hectares of Mekong River Delta and thousands
hectares of Central Coastal Region. Rice yield can be reduced by 10% for each of
1°C increase in global temperature. In higher temperature condition, demand of
water for cultivation is higher and current irrigation system will be overloaded
(IPCC, 2007).
Water in agriculture is mostly used for irrigating rice farm. About 66,000 million m3
is annually used for rice production, accounts for 82% total amount of water used
national wide (KBR, 2009). It is estimated that, in 2020 agriculture still needs a
large proportion ofwater, about 72% (KBR, 2009). Water is one of most important
inputs for farming, especially rice production. But irrigation system in Vietnam
needs to be developed more completely.
In addition, capital for production is one of the troubles for farmers. Farmers have
many difficulties when accessing formal credit. Many peasants have not high value
assets to serve as collateral to commercial banks, and they can only borrow 20
million VND for each hectare of land. Proportion of credit for agriculture and rural
areas in total credit is rather low, 22.8% (SBV, 2009). Commercial banks are less
interested in agricultural sector, because this sector involves with high risk and low
3
profitability. Another reason is that commercial banks can not be able to cover rural
areas, monitor and retrieve loan. In addition, administrative costs of lending in this
area are higher. So a large number of farmers are borrowing from informal credit
funds at higher interest rate.
Farmers also concern about the increasing costs of production and inputs such as
fertilizer, pesticide, insecticide and fuel. Annual fertilizer production of Vietnam is
about one million of tons, and consumption amounts above 2.5 million of tons for
the period from 2004-2007 (FAOSTAT, 2009). Vietnamese farmers are heavily
dependent on imported fertilizer, the imported volume accounts for over 40%
domestic demand. In 20 I 0 aggregate supply of domestic fertilizer was 2.59 millions
of tons. Meanwhile aggregate demand was 7.7 millions of tons each year. It is
estimated that, annual expenditure on imported fertilizers is about I.2 billion of
VND, with total quantity of over 3 million tons (GSO, 20 I 0).
Other problem is the increased migration of farm labor to cities to earn higher
incomes in industry sector. It reduces not only the quantity but young, strong and
educated labor force of rural sector. There was a considerable decrease in rural
population in total from 8I %-I988 to 70.4% in 2009 (GSO, 2009). Besides, a major
portion of farmers have not attended in any education level. Illiteracy limits farmers
to take over and apply new technical practices in farming.
Apparently, resources allocated to rice production are becoming scarcer and natural
condition is not convenient as it was in the past. This fact raises a question for
farmers and policy makers on how to minimize resources used in production
.
process and maximize the rice quantity. It has been an attention of agricultural
economists in the world for a long time ago. Maximizing efficiency will help
producers come closer to potential output level given current technology level and
the same input level.
4
1.2 Research Objectives
Objectives of this research are to find the way to improve the efficiency of rice
cultivating. By that way Vietnamese rice farmers are also able to increase the
output, export and then increase their income. The analysis will
(a) Find out the current level of technical efficiency of rice farms in Vietnam,
the factors influencing technical efficiency.
(b) Give the government to focus on essential policies to support Vietnamese
farmers to increase efficiency by improving technical components or
enhancing technology adoption.
1.3 Research Questions and Hypotheses
There were many studies in elements effecting on technical efficiency in developing
countries. Land status, credit approach, irrigation methods, chemicals usages,
extension services and characteristics of household head were common factors
which had been proved to be significant related to efficiency level of farming (Hi en,
2003; Rios, 2005; Tijani, 2006; Singh, 2007; Kompas, 2009, etc.). In this research,
the author is concerned about the effects of land policy, irrigation situation and
credit condition and characteristics of household head on technical efficiency. The
paper does not examine the effects of input usages on technical efficiency as some
author did. The reason is the input factors are used as independent elements in
stochastic frontier production function. It not should be analyzed again in technical
efficiency model. So, this study focuses on three problems and will answer these
questions:
a. How does agricultural land policy influence technical efficiency?
b. How do irrigation manners influence technical efficiency?
c. Does credit accessibility influence technical efficiency?
5
Land title was used as proxy to assess effect of tenure security on technical
efficiency (Rios, 2005). Impact of land fragmentation on technical efficiency was
evaluated by the average land size of farm in each province (Kompas, 2009).
Irrigation technique was examined by Rios (2005), and Am or (20 10). Msuya
(2008), and Raphael (2008) investigated the effect of accessibility to agricultural
credit on technical efficiency. Based on the concerning issues and studied from
previous papers, this research will test these hypotheses:
a. Time of land use right, the ratio of titled land in total cultivated area, the
average size ofland parcels significantly affect the farm's efficiency level.
b. The proportion of land irrigated by machines, manual and naturally
significantly affects the farm's efficiency level.
c. Credit accessibility significantly affects the farm's efficiency level.
1.4 Research Methodology
The research applies two-step maximum likelihood to investigate the factors
influencing technical efficiency of Vietnam rice farmers. Firstly, the stochastic
frontier production function is estimated by maximum likelihood method. Then,
technical efficiency will be regressed on independent variables by OLS method.
The secondary data set came from Vietnam Household Living Standard Survey in
2008. This cross-section data includes information of 4,691 rice farming
households.
1.6 Thesis Structure
The structure of following parts in this paper is as follows: Chapter II Literature
Review presents findings of factors influencing on technical efficiency, production
frontier, research methodologies from previous similar empirical studies. Chapter
III Research Methodology presents the method of estimating stochastic frontier
production function and technical efficiency model. Chapter IV Data Analysis
6
presents model specification, introduces data used in analysis and definition of
variables in the empirical model, presents and discusses results of data analysis.
Chapter V Conclusion and Policy Recommendation .
•
7
CHAPTER II
LITERATURE REVIEW ON TECHNICAL EFFICIENCY AND
CONCEPTUAL FRAMEWORK
This chapter explains concepts of technical efficiency, production frontier,
stochastic production frontier, and introduces approaches to measure technical
efficiency. Finally, the author suggests a conceptual framework for this study paper.
2.1 Key Concepts
2.1.1 Technical Efficiency
Technical efficiency (TE) measures the potential increase in output given a level of
inputs in output oriented manner. In other words, TE refers to the smallest set of
inputs needed to produce a given output in input oriented manner (FarrelL 1957).
The TE concept can be applied to the analysis of multi-output or single-output data
set. The technical efficiency does not refer to the average output, but the possible
maximum output obtainable from a given bundle of inputs. The technical efficiency
of a producer can be expressed as the ratio of real output to the maximum potential
output. It also describes the ability of farmers to apply good skill and knowledge in
production.
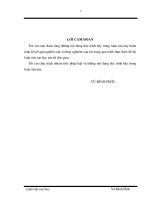
Figure 2.1 shows two total physical product curves. Those are TPP1 and TPP2. At
any given level of variable input. the TPP1 always has the higher output than TPP2
because TPP I displays the higher technical efficiency (Ellis, 1993)
8
TPP
B
TPPl
A
TPP2
D
Xl
X2
INPUT, X
Figure 2.1: Technical Efficiency
Source: Ellis (1993)
2.1.2 Production Frontier
The frontier shows the best performance observed among the farms. The frontier
production function is defined as the maximum possible output that a farm can
produce from a given level of inputs and technology (Kumbhaker and LovelL
2000).
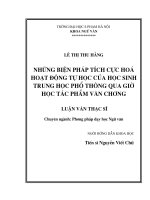
Figure 2.2 shows that the observed input-output values are below the production
frontier. With the same quantity of inputs. the output value at point B (on the
production frontier) is higher than the output value at point A. The technical
efficiency is the ratio of Y to Y* (Battese, 1991 ).
9
OUTPUT, Y
Production frontier
•
•
i
-i
•
y
Observed
Input-output values
•
•
A(x,y)
TE of firm at A=y/y"
I
i
INPUTS, X
Figure 2.2: Production Frontier
Source: Battese (1991)
2.1.3 Stochastic Production Frontier
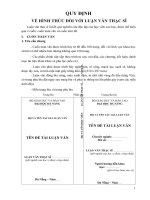
Figure 2.3 is used to illustrate the stochastic frontier production model. The
horizontal axis describes the quantity of inputs, the vertical axis describes quantity
of outputs. Consider two firms i and j. The value of the stochastic frontier output, Y
= exp
(X.~)
is on the production frontier. Output of firm i is Yi
=
exp (Xi. 13 + vi)
above the frontier, because the random error 'vi' is positive. Output of firm j is Yj =
exp (Xj. 13 + Vj), is below the frontier because the random error 'v/ is negative
(Coelli et al., 1998).
10
OUTPUT, Y
PRODUCTION FRONTIER
Yi = exp(Xi.p+Vi), if Vi> 0
Y = exp(X.p)
-~---·-------·--.
i
-----.I
I
INPUT, X
Figure 2.3: The Stochastic Frontier Production Function
Sources: Coelli. et al (1998)
2.2 Approaches to Measure Technical Efficiency
2.2.1 Data Envelopment Analysis
Two main approaches are commonly used to measure efficiency. In 1978, Chames,
Cooper and Rhodes proposed a non-parametric method, called Data Envelopment
Analysis (DEA), to measure efficiency. In this approach, there is no need to impose
functional form of the production frontier and no need to assume distribution
pattern for disturbance term. Linear programming will surround the observed points
to draw the frontier on the best performance. Then, efficiency level of each
producer is derived from the relative distance between the practical points and the
frontier. All the discrepancies between observed output and frontier are considered
as technical inefficiency, so the method is sensitive to measurement inaccuracy,
II
data heterogeneity and outliers. Moreover, hypothesis testing and confidence
intervals measures are not allowed (Horrace and Schmidt, 1996).
2.2.2 Stochastic Frontier Analysis
The second approach is parametric. Aigner and Chu (1968) proposed stochastic
frontier with the influence of the random component in the model of farming.
Aigner, Lovell and Schmidt ( 1977) disaggregated the disturbance error into data
noise and technical inefficiency. This approach is suitable to analyze agricultural
data which is influenced by the measurement errors and the effects of random
effects, such as weather conditions, diseases and so forth (Coelli et al., 1998).
Moreover, stochastic frontier approach can be used to construct the confidence
interval for parameters and to test hypothesis. So, the existing thesis applies
stochastic frontier approach to analysis technical efficiency of rice farming.
2.3 Stochastic Frontier Analysis Framework
2.3.1 Stochastic Frontier Model
Aigner et a! (1977), Meeusen and Broeck (1977) suggested the stochastic frontier
model for the estimation of technical efficiency. The technique assumes that farms
could not reach the efficiency frontier because of measurement errors, statistical
noise, any non-systematic influence and technical efficiency.
The stochastic frontier production function with two error terms can be modeled as:
(1) Yi = f(Xi:p).exp(Vi-Ui)
Where
Yi is the production of the i-th farm (i=l,2,3 ... n)
Xi is a (1 x k) vector of input quantities used by the i-th farm
P is a (k x 1) vector of unknown parameters to be estimated
s =Vi-Ui
12
V1 is a random variable and assumed to be independently and identically distributed,
~N(O, av 2). This component is representing the effects of random factors (e.g.,
measurement errors in production, weather, industrial actions, etc.). These factors
are out of the control ofthe farm.
U1 is a non-negative technical inefficiency effects that are assumed to be
independently distributed among themselves (~N(O, au2)). The distributional
parameters,
ui and Cfu2 are
inefficiency indicators.
ui indicates the average
level of
technical inefficiency. And au 2 shows the spread of the inefficiency. If Ui = 0, it is
implied that production lies on the stochastic frontier, the farm obtains its maximum
attainable output given its level of input. If U1 > 0, it is implied that production lies
below the frontier- indication of inefficiency. This one-sided error term can follow
either half-normal, exponential, or gamma distribution (Aigner, Lovell, and
Schmidt, 1977: Greene, 1980; Meeusen and Broeck, 1977).
Following Battese and Coelli (1995), the technical inefficiency effects, U1 m
equation (1) can be expressed as:
(2)
ui = zi& + wi
Where
U1 is random variable, defined by the truncation of the normal distribution, with zero
mean and variance a/, such that point of truncation is Z 1&.
Z 1 is a (1 x m) vector of farm specific variables associated with technical
inefficiency
& is a (m x 1) vector of unknown parameters to be estimated (Sharma and Leung,
1998)
Wi represents unobservable random variables, which are assumed to be identically
distributed. They are obtained by the truncation of the normal distribution with
mean zero and unknown variance cr2 , such that Ui is non-negative.
13
The technical efficiency of the i-th sample farm, denoted by TEi ts given by:
(3) TEi = exp( -Ui) = Y/f(Xi; p).exp(Vi) = Y/Yi*
Where
Yi*= f(Xi ; p)exp(Vi) is the farm specific stochastic frontier. If Yi is equal to Yi*
then TEi = 1, reflects the efficiency level of 100%. The difference between Yi and
Yi* is embedded in Ui.
2.3.2 Estimation method
Stochastic frontier production model can be estimated by Corrected Ordinary Least
Squares (COLS), Modified Ordinary Least Squares (MOLS) or Maximum
Likelihood Estimation (MLE) method.
COLS was proposed by Winsten (1957) and Gabrielsen (1975). It is not necessary
to make assumption on the distribution of technical inefficiency (Ui)· Firstly, OLS is
used to estimate parameters of frontier production model. Then it increases intercept
in the model to have all residuals negative with at least one is null.
MOLS was suggested by Richmond (1974). It requires assumption about
distribution of technical inefficiency component. This method does not adjust
intercept of the stochastic frontier production model but the technical inefficiency
component. The technical inefficiency and the residuals of the model are changed in
opposite direction. Reducing mean value of technical inefficiency will shift up the
production frontier.
MLE was represented by Afriat (1972), but Green (1980) and Stevenson (1980)
were the first researchers applying this method. The production frontier parameters
(p) and technical inefficiency (Ui) are estimated simultaneously.
COLS and MOLS only adjust intercept not the slopes of the stochastic frontier
model. The COLS and MOLS frontiers are parallel with the OLS frontier. They do
not bound above the observed value as close as possible (Porcelli, 2009). So, this
14
thesis applies maximum likelihood method to estimate stochastic frontier
production model.
2.4 Empirical Studies
The average technical efficiency of Vietnamese rice farmers in Kompas's study
(2002) was 59.2%. The stochastic production frontier was estimated with an
unbalanced panel data set of 60 provinces for the time from 1990 to 1999, included
540 observations. The increase in farm size and ratio of cultivated area ploughed by
tractor would be able to enhance efficiency level. Coefficients of capital (horse
power), labor (working days), land (hectare) and material inputs (tons) in stochastic
production frontier are positive. Small farm size and under developing credit
markets were found to constrain efficiency growth. The author applied one-step
maximum likelihood to estimate production and inefficiency model at the same
time. He explained the effects of determinants on technical efficiency based on the
function of technical inefficiency.
Hien et al. (2003) estimated technical efficiency of rice production in the Mekong
Delta, using stochastic frontier analysis approach. The technical inefficiency model
was estimated simultaneously with the frontier model, by the one-step maximum
likelihood method. And the technical inefficiency model was used to clarify the
determinants on technical efficiency. The author analyzed three season data sets,
and gave the general conclusion. The mean value was around 80% and the average
loss was about 700 kg/ha. In the stochastic frontier production function, quantity of
seed, active nitrogen and expense for pesticides had negative impacts on the rice
yield while the quantity of active phosphate and potassium and expense for hired
machine had positive impacts. In the technical inefficiency model, the coefficients
of education and market access (dummy variable had value of 1 for access to
market easily) were positive, the coefficients of land dummies (dummy for land size
over 3 hectares, dummy for land size from 1 to 3 hectares), variety dummy (farmers
used new gene of rice), IPM participation (Integrated pest management), sowing
15
technique (dummy for row seeding techniques), credit availability (total borrowed
amount for production) had negative signs. It means that technical efficiency was
positively affected by land size, variety, IPM adoption, sowing technique together
with availability of credit.
Rios (2005) surveyed 209 coffee farmers in Buon Don District and Cu M' gar
District, Dak Lak Province, Vietnam in 2004. First, technical efficiency was
calculated using Data Envelopment Analysis approach, then tobit regressions were
used to identify the factors correlated with technical and cost inefficiency. The
finding indicated that small farms were less efficient than large farm and the large
farms had the potentials to increase their output by almost 35%. For small farms,
higher education appears to reduce efficiency. The possible reason was that
education had created opportunities for off-farm work and thereby reduces on-farm
management extent. Access to credit and security of land tenure were not found to
be significant factors in explaining efficiency in the sample.
Johansson (2005) analyzed the relation between the farm size and technical
efficiency of Swedish dairy farms for the period 1998-2002. Maximum likelihood
estimation method was employed to estimate the stochastic frontier production
function for unbalanced-panel data. The input factors examined were fodder, seed,
fertilizer, capital, labor and energy. Total working hour of family members and
hired workers represented for labor. Energy concluded the oil and electricity. All
input factors had positive marginal impacts on production. ANOV A result showed
that the small farms were most efficient and the medium farms had lowest
efficiency level.
Tijani (2006) analyzed cross sectional data of 2002/2003 rice farm production of
Osun State in Nigeria. The production frontier was described by a trans-log
function. There was a possibility to increase rice output by 13.4% on average. The
51% discrepancies between observed and the frontier output because of technical
16