Lab 7.1.9b Introduction to Fluke Protocol Inspector
Bạn đang xem bản rút gọn của tài liệu. Xem và tải ngay bản đầy đủ của tài liệu tại đây (535.39 KB, 18 trang )
Lab 7.1.9b Introduction to Fluke Protocol Inspector
Objective
This lab is a tutorial demonstrating how to use the Fluke Networks Protocol Inspector to analyze
network traffic and data frames. This lab will demonstrate key features of the tool that can be
incorporated into various troubleshooting efforts in the remaining labs.
Background / Preparation
The output in this lab is representative only. Output will vary depending on the number of devices
added, device MAC addresses, device hostnames, which LAN is joined, and so on.
This lab introducing Protocol Inspector will be useful in later troubleshooting labs as well as in the
field. While the Protocol Inspector (PI) software is a valuable part of the Academy program, it is also
representative of features available on other products in the market.
Options for conducting this lab.
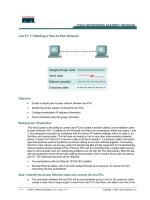
1) Use Protocol Inspector or Protocol Expert in a small controlled LAN that is configured by the
instructor in a closed lab environment as shown in the figure above. The minimum
equipment should include a workstation, a switch, and a router.
2) Perform the steps in a larger environment such as the classroom or the school network to
see more variety. Before attempting to run PI or PE on the school LAN, check with the
instructor and the network administrator.
At least one of the hosts must have the Protocol Inspector software installed. If the lab is done in
pairs, having the software installed on both machines means that each person can run the lab steps.
However, each host may display slightly different results.
1 - 18 CCNA 1: Networking Basics v 3.0 - Lab 7.1.9b Copyright 2003, Cisco Systems, Inc.
Step 1 Configure the lab or attach a workstation to the school LAN
Option 1. If the closed lab environment is selected, cable the equipment as shown above and load
the configuration files into the appropriate routers. These files might be preloaded. If not,
obtain them from the instructor. These files should support the IP addressing scheme as
shown in the figure above and the table below.
Configure the workstations according to the specifications as in the figure shown above and table
below.
Host #1 Host #2
IP Address: 192.168.1.10 IP Address: 192.168.2.10
Subnet mask: 255.255.255.0 Subnet mask: 255.255.255.0
Default Gateway: 192.168.1.1 Default Gateway: 192.168.2.1
Option 2. If option 2, connect to school LAN, is selected, simply connect the workstation, with PI or
PE installed, directly to a classroom switch or to a data jack connected to the school LAN.
Step 2 Start Protocol Inspector EDV program
From the Start menu, launch the Fluke Protocol Inspector EDV program.
Note: The first time the program is
run, a message will appear that asks,
“Do you have any Fluke analyzer
cards or Fluke taps in your local
system?”
If using the educational version, click
on No. If answering yes or if the
following screen appears, just click
on OK without selecting any ports.
There are four main Protocol Inspector views, which include the following:
• Summary View
• Detail View
• Capture View of Capture Buffers
• Capture View of Capture Files
The program opens in the Summary View. This view shows several windows used by the tool. The
Resource Browser window in the upper left corner shows the only monitoring device that is
2 - 18 CCNA 1: Networking Basics v 3.0 - Lab 7.1.9b Copyright 2003, Cisco Systems, Inc.
available, which is the NDIS 802.3 Module (NIC) of the host. If there were Protocol Media Monitors,
they would be displayed with the associated host devices. The Alarm Browser on the left side and
Message Area at the bottom will be covered later.
The Monitor View, which is in the main window on the upper right, monitors one resource per
window in a variety of viewing options. The example below and probably the startup screen show no
information in the Monitor View window. The Stop in the upper-left corner of the Monitor View
window confirms that no monitoring is occurring.
Resource Browser
Message Area
Monitor View
NIC
Step 3 Start the Monitor / Capture process
To start the monitoring/capturing process, use the Start button or Module | Start from the menu
system. The Utilization chart should start showing activity like the graphic below:
3 - 18 CCNA 1: Networking Basics v 3.0 - Lab 7.1.9b Copyright 2003, Cisco Systems, Inc.
The word Arm should appear where Stop had been before. If opening the Module menu, notice that
Stop is now an option while Start is muted. Do not stop the process yet. Restart it again if it is
stopped.
The tabs at the bottom of the window show the resulting data in a variety of forms. Click on each and
note the result. Transmit (Tx), Alarms, and Alarm Log will be blank. The following is the Received
(Rx) frames, which indicates that Broadcast and Multicast frames are being received, but they may
not show any Unicasts.
Using the console connection to the router, ping the monitoring host (192.168.1.10 or 192.168.2.10),
and notice that Unicast frames appear. Unfortunately, the errors shown in the third column will not
appear in the lab exercise unless a traffic generator like the Fluke Networks OptiView product has
been added.
4 - 18 CCNA 1: Networking Basics v 3.0 - Lab 7.1.9b Copyright 2003, Cisco Systems, Inc.
The Description tab
reveals the MAC address,
manufacturer, and model
of the NIC. It also shows
which Error Counters are
on.
Take a few minutes to
become familiar with the
tabs and the scroll
features of the window.
Step 4 View Details
To go to the Detail View window click on the Detail View button in the toolbar or double click
anywhere on the Monitor View chart. This will open a second window that should look something like
the following, after maximizing the Utilization / Errors Strip Chart (RX) window.
Note: If necessary, activate all toolbars on the View menu.
5 - 18 CCNA 1: Networking Basics v 3.0 - Lab 7.1.9b Copyright 2003, Cisco Systems, Inc.
Initially, the chart output is the same as before. However, there are many more toolbar and menu
options than in the Summary View. Before looking at these features, confirm that the Chart and
Table tabs show the same information that was seen earlier.
Like all Windows compliant programs, placing the mouse over a button brings up a screen tip briefly
identifying the purpose of the button. As the mouse moves over the buttons, notice that some are
muted. This means that the feature is not appropriate under the current circumstances. In some
cases, it is not supported in the educational version.
Note: There is a complete display of the toolbars and what they do in the Appendix at the end of
this lab.
Click on the Mac Statistics
button to see the Rx frame table data displayed in another format.
The result should be obvious. Maximize the resulting window. The one piece of new information is
the Speed, which shows the NIC transmission rate.
Click on the Frame Size Distribution
button to see a distribution of the size frames being
received by the NIC. Placing the mouse over any bar will display a small summary like the one
shown below. Maximize the resulting window.
Try the Pie, Bar, and Pause buttons in the upper-left corner. Note that the Pause stops the
capture, so click on it again to resume the capture. Look at both the Table and Chart tab displays as
well.
With the sample configurations, the student should be getting mainly small frames, because the only
thing happening is routing updates. Try using the extended Ping feature from the router Console
connection, and specify 100 pings with a larger packet size.
If maximizing each new display, return to any previous view by using the Window menu. The student
can also Tile the windows. Experiment with the Window menu features and then close any unwanted
views.
Click on the Protocol Distribution
button to see a distribution of the protocols being received
by the NIC. Placing the mouse over any bar will display a small summary panel. Maximize the
resulting window.
6 - 18 CCNA 1: Networking Basics v 3.0 - Lab 7.1.9b Copyright 2003, Cisco Systems, Inc.
Try each of the buttons and tabs to see the results. The Net button shows only network protocols.
The 323 button refers to the H323 Voiceover IP protocols. Look at the Frm (frame) and the Abs Bts
(absolute bytes) and Rel Bts (relative bytes) to see the results. Remember that the Pause button
stops the capture.
Click on the Host Table
button to see the MAC stations and related traffic.
Notice the Spanning Tree, AppleTalk, and OSPF traffic. Be sure to look at the Table tab to see the
actual values.
Click on the Network Layer Host Table
button to see the network (IP/IPX) stations and
related traffic.
7 - 18 CCNA 1: Networking Basics v 3.0 - Lab 7.1.9b Copyright 2003, Cisco Systems, Inc.