Optimization of condition for pectin extraction from pomelo peel using response surface methodology
Bạn đang xem bản rút gọn của tài liệu. Xem và tải ngay bản đầy đủ của tài liệu tại đây (352.96 KB, 8 trang )
<span class='text_page_counter'>(1)</span><div class='page_container' data-page=1>
<i>DOI: 10.22144/ctu.jen.2020.007 </i>
<b>Optimization of condition for pectin extraction from pomelo peel using response </b>
<b>surface methodology </b>
Nguyen Thi Lan Phi1,2*, Nguyen Duong Phuoc Tuan2,3, Tan Hoang Nam2,3 and Pham Van Hung2,3
<i>1<sub>Department of Food Technology, International University, Ho Chi Minh city, Vietnam </sub></i>
<i>2<sub>Vietnam National University, Ho Chi Minh city, Vietnam </sub></i>
<i>3<sub>Department of Food Technology, University of Technology, Ho Chi Minh City, Vietnam</sub></i>
<i>*Correspondence: Nguyen Thi Lan Phi (email: ) </i>
<b>Article info. </b> <b> ABSTRACT </b>
<i>Received 27 Nov 2019 </i>
<i>Revised 01 Mar 2020 </i>
<i>Accepted 31 Mar 2020</i>
<i><b> The objective of this study was to optimize extraction condition of pectin </b></i>
<i>from the pomelo peel based on the ultrasound-assisted extraction method </i>
<i>using response surface methodology. The effect of four independent </i>
<i>varia-bles: solid/liquid ratio (1/30, 1/40, 1/50 g/mL), pH values of citric acid (pH </i>
<i>1.5 - 2.5), sonication time (30 - 50 min) and extraction temperature (60 - </i>
<i>80o<sub>C) on the yield of pectin extracted from Da Xanh pomelo pomace was </sub></i>
<i>analyzed using Box-Behnken design. The high coefficient of determination </i>
<i>value (R2<sub> = 0.9299) indicated that the experimental data were fitted to a </sub></i>
<i>second order polynomial equation using multiple regression analysis. The </i>
<i>model was highly significant because the model F-value was 11.37 with </i>
<i>low p-value (p < 0.0001). Therefore, the model could be employed to </i>
<i>opti-mize the extraction process. Optimal experimental extraction condition for </i>
<i>the highest pectin yield from pomelo peel (12.4%) was obtained with the </i>
<i>solid/liquid ratio of 1/49.5 g/mL, pH of citric acid of 1.5, sonication time </i>
<i>of 47 min and temperature of 78o<sub>C. The results obtained from validation </sub></i>
<i>experiments were consistent with the predicted data. </i>
<i><b>Keywords </b></i>
<i>Pectin, pomelo peel, response </i>
<i>surface methodology, </i>
<i>ultra-sound-assisted extraction </i>
Cited as: Phi, N.T.L., Tuan, N.D.P., Nam, T.H. and Hung, P.V., 2020. Optimization of condition for pectin
extraction from pomelo peel using response surface methodology. Can Tho University Journal of
<i>Science. 12(1): 50-57. </i>
<b>1 INTRODUCTION </b>
<i>Pomelo (Citrus grandis L.), a member of the genus </i>
Citrus, belongs to the family Rutaceae (Paudyal and
Haq, 2008). Inside the thick crust of the fruit is the
spongy white peel layer, which is considered as a
good source of pectin, accounting for up to 30% of
<i>the total fruit weight (Quoc et al., 2015). Hot and </i>
humid climate is the best condition for the growth of
pomelo. As a result, pomelo can be found mostly in
</div>
<span class='text_page_counter'>(2)</span><div class='page_container' data-page=2>
ap-The highest concentration of pectin in the cell wall
can be found mostly in the middle lamella, primary
cell and secondary walls with a gradual decrease
from the primary cell wall toward the plasma
mem-brane (Jarvis, 1984). Pectin is widely used as a
func-tional ingredient in food industry as gelling,
stabi-lizing and thickening agent because of their ability
to form gels and coagulation products such as jams,
jellies, fruit juice, ice-cream, yogurts, and several
fermented dairy products.
Response surface methodology (RSM) is a
collec-tion of mathematical and statistical techniques that
describe the behavior of a data set with the objective
of making statistical previsions based on the fit of a
polynomial equation to the experiment data. The
main objective of RSM is to simultaneously
opti-mize the levels of these variables, determine the
op-timum operational conditions to obtain the desirable
<i>response (Bezerra et al., 2008). Box-Behnken </i>
de-signs (BBDs) are a class of rotatable or nearly
rotat-able second-order designs based on three level
<i>in-complete factorial designs (Ferreira et al., 2007). </i>
The efficient analysis of the first and second order
coefficients of the mathematical model is obtained
by choosing points from the three level factorial
ar-rangements based on the BBDs. In BBDs, the
exper-imental points are located on a hyper sphere
<i>equi-distant from the central point (Bezerra et al., 2008). </i>
Studies involving pectin extraction methods are
<i>nu-merous (Methacanon et al., 2014; Venzon et al., </i>
2015). In traditional extraction methods, pectin is
extracted using organic or inorganic acids at low pH
under high temperature, which is environmental
un-friendly and expensive. Recently,
ultrasound-as-sisted extraction method has been used as an
effec-tive method for extraction from with increased
yield, saved energy and reduced extraction time
<i>(Bagherian et al., 2011). However, little information </i>
of application of ultrasound-assisted extraction
method for pectin extraction from pomelo peels.
Therefore, the objective of this study was to
opti-mize conditions of the ultrasound-assisted
extrac-tion method and citric acid as solvent for extracting
pectin from the pomelo peel using response surface
methodology. The extraction conditions were
opti-mized to investigate the effect of four independent
variables: solid/liquid ratio, pH values of citric acid,
sonication time and sonication
temperature on the yield of pectin extracted from Da
Xanh pomelo pomace.
<b>2 MATERIALS AND METHODS </b>
<b>2.1 Materials </b>
The fresh pomelos named Da Xanh pomelo were
bought from the wholesale market in Dong Nai
province, Vietnam. All fruits were approximate
uni-formity of shape and size, ripeness and did not
con-tain any contaminations. After collecting and
wash-ing, the pomelo peels were peeled off, and then the
spongy white part of peels was collected by
separat-ing from the green parts of peels. The spongy white
peels were cut into small cubic pieces (1.0 × 1.0 ×
1.0 cm3<sub>) and then those pieces were subjected to a </sub>
bleaching process by heating in boiling water for 3
min. After cooling in an ice-bath, the spongy pieces
were dried in a force-draft oven at approximately
55o<sub>C overnight until the moisture content of the </sub>
peels was about 10 - 12%. The dried pieces were
then ground, sieved to get the fine powder and store
in a desiccator before transferring to the extraction
step.
<b>2.2 Ultrasound-assisted extraction of pectin </b>
<b>(UAE) </b>
The UAE was performed in an ultrasonic cleaning
bath (WUC-A10H, Daihan Co.). A mixture of
pom-elo powder and citric acid at different ratios (1/30,
1/40, 1/50 g/mL) was adjusted to different pH
val-ues (1.5 – 2.5) and exposed the ultrasound at
differ-ent temperatures (60 - 80o<sub>C) for different sonication </sub>
time (30 - 50 min). After extraction, the mixture was
filtered by filter paper to remove any insoluble
ma-terials. The filtrate was coagulated using 95%
etha-nol equal volume under 4o<sub>C for 2 hrs. Then the </sub>
co-agulated pectin was filtered and washed three times
with 95% ethanol before drying at the temperature
of 40o<sub>C for 24 hrs. </sub>
<b>2.3 Box-Behnken experimental design </b>
</div>
<span class='text_page_counter'>(3)</span><div class='page_container' data-page=3>
<b>Table 1: Symbols and coded levels of four </b>
<b>varia-bles chosen for BBD </b>
<b>Independent variables </b> <b>Coded Level </b>
<b>-1 </b> <b>0 </b> <b>1 </b>
X1 (Solid/liquid ratio) 1/30 1/40 1/50
X2 (pH) 1.5 2 2.5
X3 (Sonication time) 30 40 50
X4 (Sonication temperature) 60 70 80
Four significant independent variables, X1, X2, X3
and X4 were used in this system and the
mathemati-cal relationship of the response on these variables
was approximated by the second-order polynomial
equation:
Y% = β0 + β1X1 + β2X2 + β3X3 + β4X4 + β12X1X2 +
β13X1X3 + β14X1X4 + β23X2X3 + β24X2X4 + β34X3X4
+ β11X12 + β22X22 + β33X32 + β44X42 (1)
In which, Y is the estimated response (%); β0 is the
constant, β1, β2, β3 and β4 are linear coefficients; X1,
X2, X3 and X4 are independent variables; β12, β13,
β14, β23, β24 and β34 are interaction coefficients
be-tween the three factors; β11, β22, β33 and β44 are
quad-ratic coefficients.
<b>2.4 Optimization </b>
The optimization of the extraction process was done
by the Design-Expert software (Trial version 11,
Stat-Ease Inc., USA). After optimization, the
con-firmatory experiments were carried out under the
optimal conditions obtained by desirability function
methodology. The validity of the developed
re-sponse model was evaluated by comparing the
con-firmatory result with the value predicted from the
model.
<b>2.5 Determination yield of pectin (%Y) </b>
Pectin of the spongy white peel was extracted with
citric acid as an effectively extractable solvent
<i>ac-cording to the method of Venzon et al. (2015) with </i>
a slight modification. The dried peel powder (50 g)
was mixed with citric acid solution according to the
extraction conditions including solid/liquid ratio
(1/30, 1/40, 1/50 g/mL), pH values of citric acid (pH
1.5 - 2.5), sonication time (30 - 50 min) and
extrac-tion temperature (60 - 80o<sub>C), as shown in Table 2. </sub>
The suspension was then boiled at 90o<sub>C for 90 min. </sub>
After cooling, the suspension was filtered through
silk cloth followed by centrifugation to remove solid
residues. The obtained filtrate was mixed with pure
ethanol at a ratio of 1:2 (v/v) and kept overnight to
obtain the precipitation of pectin. Then, the
precipi-tate was separated by centrifugation and washed
extracted pectin was then ground and stored in the
desiccator until analysis.
The yield of pectin was calculated based on dry
<i>ba-sis by the equation is shown below (Venzon et al., </i>
2015):
%𝑌 =Mpectin
𝑀𝑟𝑎𝑤 × 100 (2)
Where, Mpectin is the pectin mass obtained
Mraw is the raw material utilized for extraction
<b>2.6 Statistical analysis </b>
These statistical analyses will perform using the
De-sign-Expert software (Trial version 11, Stat-Ease
Inc., USA). The modeling was started with a
quad-ratic model including linear, squared, and
interac-tion terms. Significant terms in the model for each
response were found by analysis of variance
(ANOVA), and significance is judged by the
F-sta-tistic calculated from the data. The experimental
data was evaluated with various descriptive
statisti-cal analyses such as p value, F value, determination
coefficient (R2<sub>), predicted determination coefficient </sub>
(R2
Pred.), adjusted determination coefficient (R2adj)
and coefficient of variance (C.V) to analyze the
sta-tistical significance of the model. The generated
data were applied for plotting response surfaces
af-ter fitting the data to the models.
<b>3 RESULTS AND DISCUSSION </b>
</div>
<span class='text_page_counter'>(4)</span><div class='page_container' data-page=4>
<i>Methacanon et al. (2014) also found that the higher </i>
yield of pectin was obtained by hydrochloric or
ni-tric acid at pH 2.0 as compared to that obtained at
pH 3.0. The data were then analyzed through
multi-ple regression analysis to determine the regression
coefficients for the equation concerning the
<b>relation-ship between three variables and a response. </b>
<b>Table 2: Box-Behnken experimental design </b>
<b>Run </b>
<b>order </b>
<b>Independent variables </b> <b>Response </b>
<b>Solid/Liquid ratio </b>
<b>(X1, g/mL) </b> <b>pH (X2) </b>
<b>Sonication time (X3, </b>
<b>min) </b>
<b>Sonication temperature </b>
<b>(X4, o<sub>C) </sub></b>
<b>Extraction yield </b>
<b>(%, w/w) </b>
1 1/30 1.5 40 70 8.41
2 1/50 2 40 60 9.01
3 1/40 2 30 60 3.17
4 1/50 2 30 70 7.04
5 1/40 1.5 30 70 11.45
6 1/30 2 40 80 6.04
7 1/40 2 50 80 8.57
8 1/30 2 30 70 5.17
9 1/40 1.5 50 70 11.28
10 1/30 2 50 70 6.34
11 1/40 2 40 70 5.13
12 1/40 2 50 60 3.52
13 1/40 2.5 40 80 1.97
14 1/50 2 50 70 9.34
15 1/30 2 40 60 4.85
16 1/40 2 40 70 6.03
17 1/50 1.5 40 70 11.35
18 1/40 2.5 50 70 1.61
19 1/40 2 30 80 8.22
20 1/40 1.5 40 60 11.45
21 1/50 2 40 80 9.69
22 1/40 2 40 70 4.02
23 1/30 2.5 40 70 1.22
24 1/40 2.5 40 60 0.24
25 1/50 2.5 40 70 1.24
26 1/40 1.5 40 80 13.34
27 1/40 2.5 30 70 1.11
The analysis of variance (ANOVA) was used to
evaluate the statistical significance and fitness of the
model as presented in Table 3. The results shows
that the fitness of model was highly significant
cause the p value of the developed model were
<i>be-low 0.0001 (Maran et al., 2013a). The F value and </i>
the associated p-value of the lack of fit (2.42 and
0.3281, respectively) were insignificant due to
rela-tive pure error showing that the model equation was
good for estimating the pectin yield. The goodness
of fit of model was evaluated by the determination
coefficient (R2<sub>), adjusted determination coefficient </sub>
(R2
Adj), predicted determination coefficient (R2Pred)
and coefficient of variance (C.V.%) as shown in
Ta-ble 3. The R2<sub> = 0.9299 showed that the model did </sub>
not explain only 7.01% of the total variations. The
value of R2
Adj of 0.8481 confirmed that the model
was highly significant. The higher R2
Adj resulted in
the better the degree of correlation between the
val-ues which were obtained from the experiments and
those predicted from the model. The predicted
de-termination coefficient (R2
</div>
<span class='text_page_counter'>(5)</span><div class='page_container' data-page=5>
<b>Table 3: Analysis of variance (ANOVA) for the fitted quadratic polynomial model with experimental </b>
<b>and predicted values </b>
<b>Source </b> <b>Sum of Squares </b> <b>df Mean Square </b> <b>F-value </b> <b>p-value </b>
Model 351.71 14 25.12 11.37 < 0.0001
X1-Solid/liquid ratio 20.38 1 20.38 9.22 0.0103
X2-pH 298.90 1 298.90 135.23 < 0.0001
X3- Sonication time 1.69 1 1.69 0.7635 0.3994
X4- Sonication temperature 20.25 1 20.25 9.16 0.0105
X1X2 2.13 1 2.13 0.9644 0.3455
X1X3 0.3192 1 0.3192 0.1444 0.7106
X1X4 0.0650 1 0.0650 0.0294 0.8667
X2X3 0.1122 1 0.1122 0.0508 0.8255
X2X4 0.0064 1 0.0064 0.0029 0.9580
X3X4 5.684E-14 1 5.684E-14 2.572E-14 1.0000
X12 4.79 1 4.79 2.17 0.1666
X22 0.5433 1 0.5433 0.2458 0.6290
X32 1.84 1 1.84 0.8340 0.3791
X42 5.27 1 5.27 2.38 0.1485
Residual 26.52 12 2.21
Lack of Fit 24.50 10 2.45 2.42 0.3281
Pure Error 2.03 2 1.01
Cor Total 378.24 26
R2 <sub>0.9299 </sub>
Adjusted R2 <sub>0.8481 </sub>
Predicted R2 <sub>0.6149 </sub>
Adeq Precision 11.9372
CV % 7.82
Predicted pectin yield (g/g peel powder, db) 13.3%
Confirmatory pectin yield (g/g peel powder, db) 12.7%
After multiple regression analysis was carried out
on the experimental data, the second-order
polyno-mial equation was formed based on the relationship
between the dependent variable and independent
variable as follows:
Y% = 5.06 + 1.3X1 – 4.99X2 + 0.375X3 + 1.3X4 –
0.73X1X2 + 0.2825X1X3 – 0.1275X1X4 +
0.1675X2X3 – 0.04X2X4 + 0.9479X12 + 0.3192X22 +
0.5879X32 + 0.9942X42
The p-values were used as a tool to check the
signif-icance of each factor and the interaction effects
be-tween factors on the pectin yield as shown in Table
3. The very small p-values (p < 0.05) showing that
the pectin yield was significantly affected by three
linear coefficients (X1, X2 and X4)
.
Othercoeffi-cients were not significant (p > 0.05).
The optimization of the process variables to
maxim-ize pectin yield of the pomelo peel was performed
by solving the quadratic models using the studied
experimental range of various variables. The
pre-dicted value of the responses (predict pectin yield)
for the models was 13.3% under the condition of the
solid/liquid ratio of 1:49.6 g/mL, pH of 1.53,
soni-cation time of 46.8 min, sonisoni-cation temperature of
78.3o<sub>C (Table 3). The model was experimentally </sub>
as-sessed to confirm the pectin yield of the pomelo peel
under optimal condition using the rounded numbers
of all factors. As a result, the experimental value
(confirmatory pectin yield) was 12.7% under the
ex-perimental conditions of the solid/liquid ratio of
1:49.5 g/mL, pH of 1.5, sonication time of 47 min,
sonication temperature of 78o<sub>C, which did not </sub>
sig-nificantly differ from the predicted result (Table 3).
The extraction yield of pomelo pectin obtained in
this study were significantly higher than those
ob-tained by Methacanon et al. (2014), who reported
that the pectin yield of pomelo peel was in a range
of 8.32 - 11.06%.
<b>3.2 Effect of individual variable on pectin yield </b>
<i>3.2.1 Effect of solid/liquid ratio </i>
</div>
<span class='text_page_counter'>(6)</span><div class='page_container' data-page=6>
the highest when treated at the solid/liquid ratio of
1/49.6. Thus, the plant material in presence of high
added solvent (citric acid) was efficiently absorbed
microwave energy and easily swollen, which
pro-moted the contact surface area between the plant
matrix and the solvent and released higher amounts
of pectin.
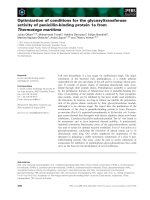
<i>3.2.2 Effect of pH </i>
The effect of pH on pectin extraction yield were
evaluated using a range of pH from 1.5 - 2.5 and the
results are given in Figs. 2a, 2d and 2e. The results
indicated that the extraction yield of pectin
signifi-cantly decreased with increasing pH values. The
previous study found that the molecular weight of
pectin was reduced at low pH and partially
solubil-ized from plant tissues without any degradation,
which was then easily recovered by precipitation
(Faravash and Ashtiani 2007). As a result, the
ex-traction at pH of 1.53 recovered the highest pectin
because the acid was considered to degrade cell wall
constituents and separate cellular contents for easier
<i>extraction. Methacanon et al. (2014) also reported </i>
that the extraction of pectin with lower pH gave
sig-nificantly higher yield than that with higher pH.
</div>
<span class='text_page_counter'>(7)</span><div class='page_container' data-page=7>
<i>3.2.3 Effect of sonication time </i>
A range of sonication time of 50 - 50 min was used
in this study to investigate the most appropriate
son-ication time for pectin extraction. As shown in Fig.
2, the extraction yield of pectin rapidly increased
when increasing extraction time. The yield was the
highest at 46.8 min and then decreased slowly (Figs.
2b, 2d and 2f). This phenomenon could be explained
by the fact that the thermal energy was accumulated
within extraction solution by the microwave energy
absorption and promoted the dissolution process of
pectin into solution until 46.8 mins and then
de-creased the yield gradually. Whereas, too long
son-ication time may lead to degradation of pectin chain
molecules, thus negatively affecting pectin
<i>extrac-tion rate (Maran et al., 2013b). </i>
<i>3.2.4 Effect of sonication temperature </i>
The extraction efficiency of pectin was improved by
increasing sonication temperature from 60 - 80o<sub>C </sub>
(Fig. 2c, e–f). The penetration of solvent into the
plant matrix was increased with increase in
soni-cation temperature. The higher temperature also
de-livered efficiently the solvent to materials through
molecular interaction with the electromagnetic field
and the energy was rapidly transferred to the solvent
and matrix, which allow to extract the pectin easily
<i>(Yan et al., 2010). Moreover, the plant cells were </i>
ruptured because of the sudden temperature rise and
increased internal pressure inside the cells of plant
sample. The pectin within the plant cells was
re-leased into the surrounding solvents because of the
destruction of sample surface by microwave
<i>irradi-ation and increased the extraction yield (Zhang et </i>
<i><b>al., 2008). </b></i>
<b>4 CONCLUSION </b>
In this study, the optimal extraction conditions for
pectin extraction were at solid/liquid ratio of 1:49.6
g/mL, pH of 1.53, sonication time of 46.8 min,
son-ication temperature of 78.3o<sub>C, corresponding with </sub>
the maximum pectin yield of 13.34% using the RSM
with the BBD. The confirmatory result obtained at
the optimized conditions was 12.73% under optimal
condition using the rounded numbers of all factors,
which was not significantly different from the
pre-dicted values. As a result, the second-order model
was adequate to describe the influence of the
se-lected variables on the extraction yields of pectin.
<b>ACKNOWLEDGMENT </b>
This research is funded by Vietnam National
Foun-(NAFOSTED) under grant number
106-NN.02-2016.72.
<b>REFERENCES </b>
Bagherian, H., Ashtiani, F. Z., Fouladitajar, A., and
Mohtashamy, M., 2011. Comparisons between
con-ventional, microwave-and ultrasound-assisted
meth-ods for extraction of pectin from grapefruit.
Chemi-cal Engineering and Processing: Process
Intensifica-tion, 50 (11): 1237-1243.
Bezerra, M. A., Santelli, R. E., Oliveira, E. P., Villar, L.
S., and Escaleira, L. A., 2008. Response surface
methodology (RSM) as a tool for optimization in
an-alytical chemistry. Talanta, 76(5): 965-977.
Canteri-Schemin, M. H., Fertonani, H. C. R.,
Waszczyn-skyj, N., and Wosiacki, G., 2005. Extraction of
pec-tin from apple pomace. Brazilian Archives of
Biol-ogy and TechnolBiol-ogy, 48(2): 259-266.
Faravash, R. S. and Ashtiani, F. Z., 2007. The effect of
pH, ethanol volume and acid washing time on the
yield of pectin extraction from peach pomace.
Inter-national Journal of Food Science and Technology,
42(10): 1177-1187.
<i>Ferreira, S. C., Bruns, R. E., Ferreira, H. S., et al., 2007. </i>
Box-Behnken design: an alternative for the
optimiza-tion of analytical methods. Analytica Chimica Acta,
597(2): 179-186.
Fox, G., 1984. Zur Wirtschaftlichkeit der Trocknung von
Apfeltrester. Confructa Studien. Schönborn, 28(02):
174-182.
Jarvis, M. C., 1984. Structure and properties of pectin
gels in plant cell walls. Plant, Cell and Environment,
7(3): 153-164.
Knee, M., Fielding, A. H., Archer, S. A., and Laborda,
F., 1975. Enzymic analysis of cell wall structure in
apple fruit cortical tissue. Phytochemistry, 14(10):
2213-2222.
Maran, J. P., Manikandan, S., and Mekala, V., 2013a.
Modeling and optimization of betalain extraction
from Opuntia ficus-indica using Box–Behnken
de-sign with desirability function. Industrial Crops and
Products, 49: 304-311.
Maran, J. P., Manikandan, S., Thirugnanasambandham,
K., Nivetha, C. V., Dinesh, R., 2013b. Box–Behnken
design based statistical modeling for
ultrasound-as-sisted extraction of corn silk polysaccharide.
Carbo-hydrate Polymers, 92(1): 604-611.
Methacanon, P., Krongsin, J., and Gamonpilas, C., 2014.
Pomelo (Citrus maxima) pectin: Effects of extraction
parameters and its properties. Food Hydrocolloids,
35: 383-391.
</div>
<span class='text_page_counter'>(8)</span><div class='page_container' data-page=8>
<i>Quoc, L. P. T., Huyen, V. T. N., Hue, L. T. N., et al., </i>
<i>2015. Extraction of pectin from pomelo (Citrus </i>
<i>max-ima) peels with the assistance of microwave and </i>
tar-taric acid. International Food Research Journal, 22:
1637-1641.
Talmadge, K. W., Keegstra, K., Bauer, W. D., and
Al-beraheim, P., 1973. The structure of plant cell walls
I. The macromolecular components of the walls of
suspension-cultured sycamore cells with a detailed
analysis of the pectic polysaccharides. Plant
physiol-ogy, 51(1): 158-173.
Venzon, S. S., Canteri, M. H. G., Granato, D., et al.,
2015. Physicochemical properties of modified citrus
pectins extracted from orange pomace. Journal of
Food Science and Technology, 52(7): 4102-4112.
Yan, M.-M., Liu, W., Fu, Y.-J., Zu, Y.-G., Chen, C.-Y.,
and Luo, M., 2010. Optimisation of the
microwave-assisted extraction process for four main
astragalo-sides in Radix Astragali. Food Chemistry, 119(4):
1663-1670.
</div>
<!--links-->