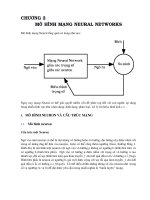
Text extraction from name cards using neural network
Bạn đang xem bản rút gọn của tài liệu. Xem và tải ngay bản đầy đủ của tài liệu tại đây (481.53 KB, 6 trang )
Text Extraction from Name Cards Using Neural Network
Lin Lin
School of Computing
National University of Singapore
Singapore, 117543
+65-6874-2784
Chew Lim Tan
School of Computing
National University of Singapore
Singapore, 117543
+65-6874-2900
Abstract-- This paper addresses the problem of text
extraction from name card images with fanciful design
containing various graphical foreground and reverse
contrast regions. The proposed method is to apply a
neural network on canny edges with both spatial and
relative features like sizes, color attributes and relative
alignment features. By making use the alignment
information, we can identify the text area from the
character level rather than the conventional window
block level. This alignment information is based on the
human visual perception theory. Some post processing
like color identification and binarization will be helpful
to get a pure binary text image for OCR.
I. INTRODUCTION
A recent application of document engineering is found
in name card scanners which readily capture name card
images followed by optical character recognition (OCR) to
build a name card database. The application provides for
document information portability, thus dispensing with the
need to carry a large number of name cards and facilitating
retrieval of name card information from the database.
While gaining its popularity, the application faces an
obstacle to its full potential due to fanciful designs that are
becoming common among name cards. Three main
problems encountered are the large variation of the text
sizes; the graphic foregrounds that include logos or
pictures; and the presence of reverse contrast text regions.
Some conventional methods cannot solve these problems
very well. This paper aims to solve these three problems.
To address the above issues, we first surveyed the
literature to find any existing methods for text extraction
from complex background for our name card scanner. The
more straightforward approaches are the thresholding
algorithms [1, 2, and 3]. In [1], several single-stage
thresholding algorithms are studied using either global or
local thresholding techniques. Multi-stage thresholding
methods are proposed in [2, 3] where a second stage
thresholding based on the result of the first stage is done to
enhance the result. Thresholding techniques are efficient
but generally they assume that the text has a darker color
than the background. For name cards that contain regions
of reverse contrast, these algorithms failed. Graphical
foregrounds are not considered in these algorithms either.
Pietikäinen and Okun [4] use edge detectors to extract
text from grey scale or color page images. In their method,
a gradient magnitude image obtained from the original
image is divided into a grid of blocks. The blocks are
classified as text block or non-text block based on the total
number of edges in the block. The method fails in
extracting larger size text and erroneously treats graphical
foreground as text because of the large amount of edges in
the texture blocks. For name cards which have a variety of
text sizes and graphical foregrounds, this method performs
poorly. The problem of reverse contrast text areas remains
unsolved.
In [5], Strouthopoulos et al propose a solution for
locating text in complex color images. An unsupervised
Adaptive Color Reduction is used to get principal colors in
the image. For each principal color, a binary image is
created and an RLSA is used to form object blocks which
are then classified as text blocks or non-text block based on
the block characteristics. All the text areas are merged in
the final output. Though the method is able to handle
complex color text with complex color backgrounds, it
recognizes only horizontal long text lines with little space
in between characters. Moreover, this method is slow when
there are many colors in the image.
Suen and Wang [6] present an edge-based color
quantization algorithm to achieve a good result for
uniform-color text in color graphics background images. It
works well provided that all text edge pixels are found
which cannot be always guaranteed due to noise during
scanning. A broken contour even of single pixel will cause
the inner part of the text to be connected with the
background resulting in text being treated as the
background. This algorithm is sensitive to many parameters
in the result that it might not work well with different types
of formats of document images.
Some neural network based methods have also been
reported. The most important and difficult part of neural
network based methods is the features to be chosen to feed
into the net. The features should represent the most
distinguishable part between text and non-text objects.
Chun et al [7] apply FFT on fixed sized overlapped line
segments to extract feature as input to the neural network.
This method works well to distinguish text of different
colors from graphical objects. But it cannot deal with texts
that have large spacing in between characters. Line
segments having fixed size will limit its applicability to a
certain range of text size only.
Li et al [8] use wavelet decomposition to extract
features. This method is a texture based method which
works well when there is no text liked graphical objects
which appears very often in name cards like logos.
Thus, the above methods fail one way or another in
overcoming the following difficulties for extracting text
from name cards:
1) Variation of background color and text color
(varying from line to line);
2) Complex graphical foregrounds like logos or
pictures;
3) Large variation of the text sizes and fonts.
Some text detection methods use non-system
determined parameters to determine the result. Thus these
methods may not suit the large variation of the text sizes
and fonts. Some neural network methods are not using the
best features to classify the text of different sizes and fonts
from those foreground graphical objects. In view of the
above, a new method is proposed in this paper which is
described in the next section.
II. PROPOSED METHOD
The underlying principle of our method is based on the
human visual perception in identifying text lines regardless
of text or background colors, foreground objects and text
size variation. Julesz [9, 10] introduced the concept of
texton in his theory on human visual perception. Julesz
defined textons as rectangular, line segments, or elliptical
blobs that have specific characteristics like, color, angular
orientation, width, length, and movement disparity.
According to Julesz’s theory, texture discrimination can be
done before the detection of textons because the
differences between textons can be detected without the
conscious effort of recognizing the textons. This
knowledge can be related to our text and non-text objects
classification.
A major distinguishing feature of a text line is its
repetitive linear occurrences of text liked objects with
similar sizes and color information against the background.
Our method aims to capture these features and use a neural
network to help to do classification systematically. In doing
so, we use contours of objects to simplify the conventional
color reduction and connected components extraction
procedure. Further, with the help of the object contours,
we can get the characteristic information of each object
with no assumption made on the relative gray scale or color
between the text and the background. Some relative
alignment information will be given by analyzing the
neighboring contours. These features are fed to the neural
network for classification.
Thus our method consists of the following steps:
1) Edge detection;
2)
Local contour characteristics analysis;
3)
Relative contours alignment analysis;
4)
Contours classification using neural network;
5)
Text area binarization.
Details of the above steps are further elaborated in the ensuing
subsections.
Figure 1. Sample name card image
Figure 2. Canny edge image
A. Edge Detection
Recent name cards often have fanciful design such that
some texts have only small color differences with the
background. In such cases, a modified canny edge detector
is used to detect the object contours. In this canny edge
detector, we use a relatively large
2=sigma
because of
textures in some name cards and also the use of rough
paper material which introduce noises during scanning.
The conventional canny edge detector uses two thresholds
1
T
and
2
T
to control the output. In our case, fixed
thresholds may lead to the result of missing low contrast
texts. In any name card, the number of texts falls within a
certain range. Based on this property, we use a percentage
threshold
8.0=p
. Thus
1
T
is identified in such a way that
the number of pixels having gradient values smaller than
1
T
is of percentage
p
to the total number of pixels.
2
T
will then be determined by
12
4.0 TT ×=
. Figure 2 shows
the canny edge image of the name card in figure 1.
B. Local contour characteristics analysis
Based on the edge image
e
, contours are identified as
the connected components of edges. For each contour, the
non-edge pixels connected with the edge pixels are
collected and the color distribution in the original image of
these pixels is computed to construct a histogram for the
contour. Four possible histograms are observed.
Figure 3. Histograms of 4 cases
In figure 3, (A) shows an ideal histogram for text or text
liked objects. We can see two clean peaks introduced by
the inner and outer color of the contour. (B) shows a
distorted diagram for character possible objects. In this
diagram, we can see one clear peak which covers about
half of the area under the histogram. This shows that one
side of the contour is distinctive while the other side is
unprominent. Small characters may give this histogram due
to the distortion at the thin strokes during scanning. Some
solid characters with complex background will also give
this type of histogram. This type of histogram is also given
by some graphical contours with one prominent side. (C) is
a typical histogram for graphical objects like pictures.
There is no dominant peak. The colors are distributed
relatively wide. (D) is a histogram with only one peak. This
only occurs on unclear textures which are hardly noticeable
by humans. Although the classification cannot rely on the
histograms only, these histograms still give some very
helpful information.
The following formulas show how we capture the
information given by the color histograms:
Let
c
n
represent the number of pixels having color
c
,
c
from 0 to 255. Then:
∑∑
==
×=
255
0
255
0
_
c
c
c
c
ncncavg
; (1)
∑∑
==
×=
cavg
c
c
cavg
c
c
ncnlavg
_
0
_
0
_
; (2)
∑∑
==
×=
255
_
255
_
_
cavgc
c
cavgc
c
ncnravg
; (3)
]255,0[),(_ ∈= cnstdstdn
c
; (4)
]_,0[),(_ cavgcnstdstdl
c
∈=
; (5)
]255,_[),(_ cavgcnstdstdr
c
∈=
. (6)
The first three are the average color of all pixels, pixels
having color smaller than the average and pixels having
color larger than the average accordingly. The next three
are the standard errors of number of pixels for all colors;
colors smaller than the average color and colors larger than
the average color. Basically these features represent the
central positions (average color) and the standard errors of
three parts: the whole histogram, left part of histogram and
right part of histogram.
Besides the features extracted from the color histogram
analysis, two additional basic spatial features i.e. width and
height are used
.
C. Relative contours alignment analysis
Local characteristics of the contours help to distinguish
text from non-text object but they are insufficient. Some
graphical objects have similar local characteristics. Some
logos, for example, are just the same as characters from the
local texture point of view. Text strings have repetitive
linear occurrences of characters as a distinguishable feature
from graphical objects. We call this feature as relative
contours alignment information. To represent this relative
information, we need to find the connection between
similar neighboring contours.
We first define a similarity
SIM
of two contours
1
C
and
2
C
based on a certain feature
F
.
F
is one of the
features defined in equations (1) – (6). Take
cavgF _=
as an example, then:
)_,_max(
)_,_min(
))(),(max(
))(),(min(
),,(
21
21
21
21
21
cc
cc
cavgcavg
cavgcavg
CFCF
CFCF
FCCSIM
=
=
(7)
then the relative similarity
RSIM
for a certain direction,
say
X
is:
),(
)(
),,,(
21
1
21
CCdisX
CsizeX
SIMXFCCRSIM ×=
(8)
sizeX
is
the contour length in the
Y
direction which
equals the height of
1
C
whereas
sizeY
equals the width of
contour.
disX
is the central distance projected onto
X
direction
.
Since only similar sized, well aligned neighboring
contours are meaningful for
1
C
,
RSIM
will only have
value when
2
)(
)(
2
1
2
1
<<
CsizeX
CsizeX
and
2
C
’s center is in
between
1
C
’s top and bottom, if we find similarity of
2
C
from
X
direction.
The total similarity value of
1
C
on feature
F
is the
sum of relative similarities of all other contours in both
X
and
Y
direction.
There are 6 local features extracted from the histogram
analysis, correspondingly there are 6 relative total
similarity features as well. For any contour, these relative
features represent the similarity relations between
neighboring contours. Thus they provide human visual
perception information for machine to identify text area
more intelligently and more accurately. Together with the
two basic spatial features, i.e., width and height, there are
totally 14 features used for the neural network analysis.
D. Contours classification using neural network
We extract the above features which are helpful for
classification of text and non-text area. The large number
of features aggravates the difficulty of analysis the features.
In this case, a supervised learning method will be naturally
the best way to analyze these features. Theoretically, a
Backpropagation neural network can handle any nonlinear
relationship after training including the complicated inter-
relationship between the features. Making use of neural
networks will also make the features useful for all types of
images because it need not set different thresholds for
different type of images.
To train the neural network, we create a
Backpropagation neural network consisting of 14 inputs
nodes, 20 hidden nodes, and 1 output node. Since we
extract features directly on contours, it is very easy to get
representative positive and negative samples by going
through all the contours in the images. Another advantage
of using features from contours is that the variation of text
size is considered so that we don’t need to get another
training set of the same image with different image size.
After training, the features or contours that need to be
classified are fed into the neural network. If the output is
higher than a certain threshold, this contour is considered
as a text contour. Figure4 shows a classification result,
where only the contour areas that are classified as text areas
are shown.
Figure 4. Classification result
Figure 5. Binarization result
E. Text area binarization
After the text contour areas are identified, the
binarization step will be quite simple given the color
histogram of the contour. Basically the histogram
represents the inner text color and outer background color.
It is easy to locate the outer background pixel connected to
the contour by scanning from outer sides towards center.
Studying these background pixels will give us knowledge
on which part of the histogram is from background and
which from text. Then the binarization procedure will be
straight forward. A sample binarization result is given in
figure 5.
III. EXPERIMENTAL RESULTS
We have in total 250 name card images which suffer
from one or more of the problems mentioned in section 1.
20% of the name cards images are used as the training set
for neural network, while the remaining 80% are used for
testing. There are about 500 connected edges per name
card image, including small noises. Removing small noises
with area less than 10, there are still over 400 connected
edges per image. This large number is due to broken edges
from the canny edge detector, especially when detecting
edges on low contrast images with background having
unsmoothed textures. Although the closed contours of texts
are not needed in our method, too many broken edge may
cause very poor results. This large number of broken edges
will slow down the training process and introduce errors to
the neural network. The training process takes over a day to
finish. It is thankful that training process is a one time
process.
Based on the number of correct text contours identified,
the recall rate is 89% and the precision is 84%. The results
are promising and show advantage of using relative
alignment features in classifying our fanciful designed
name card images. We did some tests of using only the 8
spatial features for the neural network and confirm that the
inter-relationship of neighboring characters is crucial in
distinguishing most graphical objects from texts. Table 1
shows the recall and precision comparison of the two tests.
TABLE 1
Recall and precision rate comparison
Recall Rate Precision Rate
Using only 8
spatial features
73% 60%
Using 14 spatial
and relative
features
89% 84%
One example is given Figure 5 to illustrate the output
where the eyes and the eyebrows were mistaken as texts.
The reason is that these graphical objects fulfill the
condition of text: repetitively linear occurrences of similar
objects. Figure 6 shows another sample name card image
containing a book cover on which there are reversed texts
and graphical objects. Figure 7 - 9 show the outputs for
each process.
Figure 6. 2nd sample image
We can see that although the book cover contains non-
text objects like a picture and several lines which have
similar colors with the text inside, the result is still
promising. Only some relatively weak texts are missed
because their canny edges are relatively weak for detection.
The non-text objects are correctly classified because of the
relative alignment features introduce in our method.
Figure7. Canny edge of 2
nd
sample
Figure 8. Classification result
Figure 9. Binarization result
IV. CONCLUSION AND FUTURE
WORKS
A neural network based method is discussed in this
paper. The features used for the neural network are not
only the spatial characteristics but also the relative
alignment characteristics. The experiment shows that by
using edge information, the computation can be simplified
yet still achieves promising results. This allows us to
identify text contours with no regard to their large variation
in font sizes, text layouts and the mixture with graphic