Estimating the recreational demand for a marine park in southern sri lanka; the case of hikkaduwa marine park
Bạn đang xem bản rút gọn của tài liệu. Xem và tải ngay bản đầy đủ của tài liệu tại đây (1.74 MB, 82 trang )
MINISTRY OF EDUCATION AND TRAINING
NHA TRANG UNIVERSITY
KORALALAGE CHAMINI DINUSHIKA
Estimating the Recreational Demand for a Marine Park in
Southern Sri Lanka; the Case of Hikkaduwa Marine Park
MASTER THESIS
KHANH HOA - 2017
MINISTRY OF EDUCATION AND TRAINING
NHA TRANG UNIVERSITY
KORALALAGE CHAMINI DINUSHIKA
Estimating the Recreational Demand for a Marine Park in
Southern Sri Lanka; the Case of Hikkaduwa Marine Park
MASTER THESIS
Marine Ecosystem Management &
Climate Change
Major:
Topic allocation Decision
Decision on establishing
the
Committee:
04th of June 2017
Defense date:
Supervisors:
Prof. OSCAR
AMARASINGHE
Chairman:
Faculty of Graduate Studies:
KHANH HOA - 2017
UNDERTAKING
I undertake that the thesis entitled: “Estimating the Recreational Demand for a
Marine Park in Southern Sri Lanka; the Case of Hikkaduwa Marine Park ” is
my own work. The work has not been presented elsewhere for assessment until the time this
thesis is submitted.
03 Date 06 Month 2017Year
Author
KORALALAGE CHAMINI DINUSHIKA
iii
ACKNOWLEDGMENT
I would like to express the deepest appreciation to the Faculty / Deparment of Graduate
Studies, Nha Trang University for providing me with all facilities to broaden my vision and
knowledge on the diverse aspects of the management of coastal ecosystems and Climate
Change, and assisting me in all respects to successfully complete this thesis.
My special thanks go to Prof.Oscar Amarasinghe Faculty of Agriculture, University of
Ruhuna, Sri Lanka for the continuous support extended to my Msc study and research, and
especially for his patience, motivation, enthusiasm, and for expanding our skills through
immense knowledge. His guidance helped me at all times of conducting research work and
writing of this thesis.
A deep sense of gratitude is owed to the NORHEAD project on Climate Change, for
providing me a great opportunity of pursuing my Masters Studies in the field of Marine
Ecosystem Management and Climate Change. At the same time I would like to express my
thanks to all the teachers of this masters’ program who guided me to complete the masters’
program successfully.
Last but not the least, I would like to thank my family: my parents and to my brothers
and sister for supporting me spiritually and morally, throughout the writing this thesis.
Thank you!
03 Date 06month 2017 year
Author
KORALALAGE CHAMINI DINUSHIKA
iv
Table of Contents
UNDERTAKING ......................................................................................................................iii
ACKNOWLEDGMENT ........................................................................................................... iv
LIST OF ABBREVIATIONS ..................................................................................................vii
LIST OF TABLES...................................................................................................................viii
LIST OF FIGURES ................................................................................................................... ix
APPENDICES ........................................................................................................................... ix
Abstract ................................................................................................................ xi
CHAPTER 1 INTRODUCTION .................................................................................. 1
1.1 Objectives ...................................................................................................................................... 4
CHAPTER 2 LITERATURE REVIEW ..................................................................................... 5
CHAPTER 3: METHOD .......................................................................................................... 15
3.1 Selection of Study Area............................................................................................................... 15
3.2 Population and sample ................................................................................................................ 22
3.3 Sampling method......................................................................................................................... 22
3.4 Data collection............................................................................................................................. 22
3.4.1 Secondary sources of data .................................................................................................... 22
3.4.2 Primary sources of data ........................................................................................................ 23
3.5 Theoretical Concepts ................................................................................................................... 24
3.6 Data Analysis .............................................................................................................................. 28
CHAPTER 4 RESULTS and DISCUSSION ................................................................ 29
4.1 Selected Socio economic and Demographic characteristics of the local visitors to the Hikkaduwa
Marine Park ....................................................................................................................................... 29
4.2 Detailed Analysis of selected Socio economic and Demographic characteristics of the local
visitors to HMP. ................................................................................................................................ 29
4. 2.1. Age distribution of the local visitors .................................................................................. 29
4. 2.2 Average monthly income of local visitors to Hikkaduwa Marine Park .............................. 31
4. 2. 3 Educational standards of local visitors to HMP ................................................................. 31
4. 3 Visit Characteristics of local visitors to the Hikkaduwa Marine Park ....................................... 32
4. 3.1 Annual number of visits to the HMP by local visitors ........................................................ 32
4. 3.2. Access time to Hikkaduwa Marine Park by local visitors .................................................. 33
4. 3.3 Mode of transport to Hikkaduwa Marine Park by local visitors ......................................... 34
4.3. 4. Main recreational purpose of local visitors to visit Hikkaduwa Marine Park .................... 35
v
4. 4 Selected Socio economic and Demographic characteristics of the foreign visitors to the
Hikkaduwa Marine Park.................................................................................................................... 36
4.5. Detailed Analysis of Selected Demographic and Socio economic characteristics ..................... 36
4. 5.1 Number of foreign visitors by age class .............................................................................. 36
4. 5.2 Detailed analysis of Income of foreign visitors ................................................................... 37
4. 5.3 Educational achievements of the foreign visitors to the Hikkaduwa Marine Park.............. 38
4.6 Visit Characteristics of foreign visitors to the Hikkaduwa Marine Park..................................... 39
4. 6.1. Frequency of annual visits by foreign visitors to Hikkaduwa Marine Park ...................... 39
4. 6.2. Main purposes of visiting Hikkaduwa Marine Park by foreign visitors............................ 40
4. 6.3. Foreign visitors’ awareness of alternative sites to the Hikkaduwa Marine Park ................ 40
4. 7.1. Opportunity cost of time..................................................................................................... 42
4. 7.2. Calculation of Travel cost for multiple site visitors ........................................................... 43
4.7.3 Recreational demand of local visitors to Hikkaduwa Marine Park ...................................... 44
4. 7.4 Recreational Demand curve for local visitors to Hikkaduwa Marine Park ......................... 44
4. 8 Travel benefits ............................................................................................................................ 47
4. 9 Recreational Demand of foreign visitors to Hikkaduwa Marine Park ....................................... 51
4. 10 Impact of climate change on visitor behavior in HMP............................................................. 54
4. 11 High impact scenario affecting for visitation rate for local and foreign visitors ...................... 55
4. 12 Contribution of estimation of recreational values towards improved management of HMP ... 56
CHAPTER 5 CONCLUSION .................................................................................................. 58
CHAPTER 6 REFERENCES ................................................................................................... 62
vi
LIST OF ABBREVIATIONS
AGA
Assistant Government Agents
BV
Bequest Value
DS
District Secretariat
EV
Existence value
FE
Foreign Exchange
HMP
Hikkaduwa Marine Park
HP
Hedonic Pricing
IPCC
Intergovernmental Panel on Climate Change
ITCM
Individual Travel Cost Method
IUCN
International Union for Conservation of Nature
IUV
Indirect Use Value
LKR
Sri Lankan Rupees
MD
Multi Destination
MPA
Marine Protected Area
NARA
National Aquatic Resources Agency
NUV
Non- Use Value
PP
Primary Purpose
Rs
Rupees
SP
Stated preference
TC
Travel Cost
TEV
Total Economic Value
UNFCCC
United Nations Framework Convention on Climate Change
ZTCM
Zonal Travel Cost Method
vii
LIST OF TABLES
Table 2.1 Relationship between valuation methods and value types……………………..........9
Table 3.1 Consumer Surplus Estimates for the Whole Recreation Experience Using the
ZTCM………………………………………………………………………………………....27
Table 4.1 Selected socio economic and demographic characteristics of the local visitors to
Hikkaduwa Marine Park……………………………………………………………..……….29
Table 4.2Educational standards of local visitors to HMP………………………….………....32
Table 4.3 Mode of transport to Hikkaduwa Marine Park by local visitors…………..……….35
Table 4.4 Selected Socio economic and demographic characteristics of foreign visitors to the
Hikkaduwa Marine Park……………………………………………………………………...36
Table 4.5 Model summary and parameter estimates for local visitors’ recreational demand
curve for HMP…………………………………………………………….………………….45
Table 4.6 Independent variables and the coefficients that affect the number of visits of local
visitors to HMP……………………………………………………………………………….47
Table 4.7 Model Summary and Parameter Estimates for the local visitors travel benefits
obtained while on travelling…………………………………………………………………..48
Table 4.8 Model summary and parameter estimates for local visitors’ true recreational
demand curve for HMP………………………………………………………………….…....50
Table 4.9 Model summary and parameter estimates for foreign visitors’ recreational demand
curve for HMP …………………………………………………………………………...…. 52
Table 4.10 Independent variables and the coefficients that affect the number of visits of
foreign visitors to HMP……………………………………………………………………….53
viii
LIST OF FIGURES
Figure 2.1 Total Economic Value framework: Use and non-use values of a marine eco
system…...................................................................................................................................................6
Figure 3.1 Map of Hikkaduwa Marine Park…………………………………………………………...15
Figure 3.2 Detailed map of Hikkaduwa Marine Park………………………………………………….17
Figure 3.3 Individual travel cost model – Illustrative demand curve…………………………...........26
Figure 3.4 whole recreation experience demand curve………………………………………………..28
Figure 4.1 Percentage of local visitors to Hikkaduwa Marine Park, by Age Group…………………30
Figure 4.2 Average monthly incomes of local visitors to Hikkaduwa Marine Park…………………..31
Figure 4.3 Annual number of visits to the Hikkaduwa Marine Park by Local Visitors……………….33
Figure 4.4 Access time to HMP by local visitors……………………………………………………...34
Figure 4.5 Number of visits per year to HMP with the changing access times………………………..34
Figure 4.6 Main purpose of visiting Hikkaduwa Marine Park by local visitors……………………….35
Figure 4.7 Age distribution of foreign visitors to the Hikkaduwa Marine Park……………….............37
Figure 4.8 Average monthly income distributions of foreign visitors to Hikkaduwa Marin
Park………………………………………………………………………………………………….....38
Figure 4.9 Educational achievements of foreign visitors to the Hikkaduwa Marine Park ……………38
Figure 4.10 Frequency of annual visits by foreign visitors to the Hikkaduwa Marine Park…………..39
Figure 4.11 Main purposes of visiting the Hikkaduwa Marine Park by foreign visitors……………...40
Figure 4.12 Awareness among foreign visitors of alternative sites to Hikkaduwa Marine
Park………………………………………………………………………………………………….....41
Figure 4.13 Local visitors recreational demand curve for HMP………………………………………45
Figure 4.14 travel benefits obtained by local visitors with the distance they travelled………………..48
Figure 4.15 Recreational demand curve with net travel cost for HMP by local visitors………………50
Figure 4.16 foreign visitors recreational demand curve for HMP……………………………………..52
Figure 4.17 Local Visitors respond for a 50% reduction of the beach area due to Climate
Change………………………………………………………………………………………………....54
Figure 4.18 Foreign Visitors respond for a 50% reduction of the beach area due to Climate
Change…………………………………………………………………………………………………54
Figure 4.19 The most important climate change scenario affecting visitation rate – Local visitors
…………………………………………………………………………………………………………55
Figure 4.20 The most important climate change scenario affecting the visitation rate- foreign sample
…………………………………………………………………………………………………………56
ix
APPENDICES
Appendices
1
Content
Page
Survey Form
66
x
Abstract
Hikkaduwa Marine Park (HMP) provides many environmental services and generates
a number of values. Hence maintaining the health of the marine environment and the
relevant ecosystem is of paramount importance. However, in the absence of a market
value of the HMP, management decisions are seriously affected because investment on
ecosystem sustainability cannot be justified. Hence this study was undertaken aiming
at fulfilling this need. The major objectives of the study included, estimating the
recreational demand for the Hikkaduwa Marine Park using the Travel Cost Method,
and to find out the impacts of climate change on park visitation rates and to examine
how an estimation of recreational values would contribute towards improved
management of the Park. The methodology employed consisted of a pre tested
questionnaire administered to a sample of local and foreign visitors to the HMP. Data
were analysed using simple linear regression technique with the help of SPSS
statistical software. The study estimated the total recreational value of the HMP to be
7.4 million USD per year for local visitors and 0.93 million USD for foreign visitors,
with a total of 8.3 m USD. Results revealed that there were travel benefits reaped by
the visitors, which increased with travel distance which revealed the preference of
local visitors for longer trips. Re-estimation of recreational demand for HMP using net
travel cost (Travel Cost – Travel Benefits) revealed a higher consumer surplus and the
recreational value increased from 7.4 m to 9.1 million. Further results revealed that
sea level rise is the most significant impact of climate change which would reduce the
beach area and consequently the visitation rate of both local and foreign visitors.
Therefore, when making strategic plans towards improved management of HMP, it is
very important to pay special attention to the protection of beach area. Finally as there
is no entry fee to HMP it is suggested to establish a suitable entry fee because of the
colossal recreational value of the site, while searching for donations. The huge
recreational value of the HMP also justifies a sizeable government budget allocation
towards improved management of the HMP.
Key words: Climate change, Recreational demand, Travel cost method
xi
Estimating the Recreational Demand for a Marine Park in Southern Sri
Lanka; the Case of Hikkaduwa Marine Park
CHAPTER 1 INTRODUCTION
Being an island, Sri Lanka is endowed with a rich and colossal marine environment,
which offers many opportunities for the improvement of country’s economy with an
array of marine resources and activities. Moreover, Sri Lanka’s coastal zone provides a
number of environmental services that contributes significantly towards maintaining
the sustainability of both the ecosystem and the human system, while generating high
total economic values including use and non-use values. In the context of coastal
ecosystems coral reefs are a resource of immense importance for a large number of
people, especially the coastal populations of the developing world (Berg et al, 1998).
As defined by 2005 Millennium Ecosystem Assessment, coral reefs provide benefits
under the four categories of ecosystem services. They are regulating, provisioning,
cultural and supporting services. Regulating services include protection of shores from
storm surges and waves; prevention of erosion. Provisioning services include fisheries,
building materials, etc. Supporting services include cycling of nutrients, fish nursery
habitats while tourism and spiritual appreciation are some examples for recreational
services. Since coral reef ecosystems are massive service providers it is so important to
conserve and preserve them for the long term benefits derived from them.
Tourism is the world’s largest growing industry and coral reefs add significantly to the
value of coastal tourism. In the mid-1990s, coastal tourism contributed about $20.0
million per year to the national economy of Sri Lanka (Berg et al., 1998). In 2007, a
study estimated that the average global value of coral reef recreation is $184 per visit,
at 2000 prices (Brander et al, 2006). Studies showed that, tourism and recreation
account for $9.6 billion of the total $29.8 billion global net benefit of coral reefs
(Cesar, Burke and Pet-Soede, 2003 in Conservation International, 2008). The high
biological diversity and clear waters of tropical reefs also support an abundance of
recreational activities such as SCUBA diving, snorkeling, island tours, and sport
fishing. These activities can be highly lucrative for individual economies.
Hikkaduwa coral reef is one the most beautiful coral reefs found in Sri Lanka and the
first coral reef to be declared as a marine national park. The reef was declared a marine
1
sanctuary in 1979, the first official marine protected area in the country and in 2002 it
was upgraded to the status of a Marine National Park. It is a diverse coral reef
consisting of around 60 species of hard coral along with over 170 species of reef fish.
Its golden sand, sun, snorkeling and surfing site enhance the attraction of many local
and foreign tourists. Because Hikkaduwa is close to Colombo and also because the
reefs are closer to the roads, it is frequently visited by tourists and locals who are
nature lovers. According to Nakatani et al, 1994, tourists industry in Hikkaduwa
experienced significant growth during the early 1970s to 1980s. Hikkaduwa has
become the most popular coastal resort area in the country with an estimated 294,545
guest- nights spent in Hikkaduwa in 1992 (Tantrigama, 1994).
Despite the numerous economic benefits coral reefs provide, reef ecosystems are under
threat of irrevocable decline worldwide from a suite of anthropogenic stressors. Corals
have been disappearing as a result of bleaching, disease, storm damage and a range of
human activities, including overfishing, use of destructive fishing gear, anchor damage
and pollution. At the same time, algae have increased as herbivores and grazers, such
as sea urchins and some fish species, that keep them in control, have declined through
disease and overfishing. Moreover, global climate change is also threatening reefs
through coral bleaching, disease, and ocean acidification, leading to both reef
destruction and structural degradation. In Sri Lanka, damage to coral reefs generated
erosion on the south and west coasts, which in 1998 were estimated to average 40-cm
a year. Some $30.0 million had already been spent on coastal constructions to curtail
this, and it has been estimated that the cost of replacing the coastal protection provided
by these reefs would be $246,000 to $836,000 per km (Berg et al., 1998).
According to Wilkinson et al, 1999 in Edward B et al, 2011 “The overall estimated
economic damages from lost fisheries production, tourism and recreation, coastal
protection, and other ecosystem services from the 1998 Indian Ocean coral bleaching
event have ranged from $706 million to $8.2 billion” .However, global reductions in
tourism due to recent climate change-driven coral bleaching events are estimated in the
billions (Wilkinson et al. 1999). These reasons are same with the degrading coral
ecosystem in Hikkaduwa too. Despite these reasons to meet the rapidly increasing
tourist demand many activities were taken place in Hikkaduwa ecosystem and they
2
were created problems due to the absence of proper development plans (Nakatani et al,
1994). Negative environmental and social impacts due to unplanned development
ultimately undermined the area’s attractiveness to visitors. Degradation of the coral
reef, declining coastal water quality, depleted coral fish populations, sedimentation of
the coral reef', inadequate solid waste disposal systems, coastal erosion, inadequate
anchorage facilities for fishing boats are pointed out as problems which affect marine
ecosystem and recreational activities in Hikkaduwa, needing immediate management
attention .
Usually the value of goods and services traded in the market are reflected by their
prices. A central problem in estimating the value of natural resources is that many of
their services are not commonly traded in competitive markets. Even though marine
reserve areas provide many services they cannot be sold or bought in a competitive
market. Most environmental resources are considered public goods and are considered
as ‘non-rival’ in consumption and ‘non-excludable’ in provision (Begg et al. 1987).
Hence such resources have often been undervalued and at worst been treated as free
goods leading to their overuse (Brander et al 2006).Therefore, a sound knowledge of
the value of these services is very much important in making correct resource
management decisions.
Since Hikkaduwa Marine Park provides many environmental services and generate a
number of values, the health of the marine environment and ecosystem must be
maintained (even improved). Normally the government budget allocation for the
management of marine parks is quite limited. Under such circumstances, the other
alternative way of securing funds to manage the part would be to generate additional
revenue from the park. Since at present no entry fee is charged for the Hikkaduwa
marine park, introducing an entry fee would be a good strategy. Unless the value of the
system is not known management strategies of this nature cannot be adopted. It is
towards this direction that the present study is undertaken. Assuming that recreational
values represent the major share of the total economic value of the Hikkaduwa Marine
Park, this study aims at making an assessment of the recreational value of the park.
3
1.1 Objectives
The major objective of the study is to estimate the recreational value of Hikkaduwa
Marine Park aiming at improved management of this site.
The more Specific Objectives of the study are,
i. To estimate the recreational demand for the Hikkaduwa Marine Park using the
Travel Cost Method
ii. To find out the impacts of climate change on park visitation rates
iii. To examine how an estimation of recreational values would contribute towards
improved management of the Park.
4
CHAPTER 2 LITERATURE REVIEW
Ensuring the environmental sustainability is one of the Millennium Development
Goals (United Nations, 2015). Terrestrial and marine protected areas in many regions
have increased substantially since 1990. But overexploitation of marine fish stocks led
to declines in the percentage of stocks within safe biological limits, down from 90 per
cent in 1974 to 71percent in 2011.It is quite clear that attempts should be made to
protect these ecosystems from overexploitation and degradation. Possession of
precision data is therefore a must in this regard, to take correct policy decisions. Large
data gaps remain in several development areas. Poor data quality, lack of timely data
and unavailability of disaggregated data on important dimensions are among the major
challenges. As a result, many national and local governments continue to rely on
outdated data or data of insufficient quality to make planning and decisions.
Strengthening data generation and the use of better data in policymaking and
monitoring are becoming increasingly recognized as fundamental means for
development (United Nations, 2015).
In taking actions to ensure environmental sustainability we need to know the value of
the natural resources. Various valuation techniques have been developed to assess the
environmental resources. The Total Economic Value (TEV) concept was first
introduced in the 1980s in an essay entitled “Towards the measurement of total
economic value” by Peterson and Sorg (1987). The total economic value of marine
protected areas comprises both its use and non-use value components.
Remoundou et al., 2009 cited in Shammi A and Tai S Y, 2013 explains that “Use
value denotes a set of benefits resulting from direct use of the resources by individuals.
However, non-use values consist of the values that a person attaches to environmental
goods and services although they themselves do not use it. Use Values can be divided
into Direct Use Values and Indirect Use Values. Direct Use Values include both
extractive uses and non- extractive uses. Examples for extractive values from a marine
reserve are fisheries, pharmaceuticals, etc. Recreation, tourism, research and education
are some examples for non-extractive uses from a marine reserve area. Indirect use
value (IUV) refers to different kinds of important ecosystem functions that are vital to
the survival of marine resources. Act as habitat for different fish species and control
5
coastal erosion are some of the examples for indirect use values from a marine reserve
area”.
“Benefits that can be generated without any physical use are denoted as Non-use
values (NUV). Non-use values can be categorized in to Option, Bequest and Existence
Values. Optional Value is based on how much individuals are willing to pay today for
the option of preserving the asset for future (personal) direct and indirect use”
(Shammi A and Tai S Y, 2013).
Bequest Value, while excluding individuals’ own use values, is the value that people
derive from knowing that others (perhaps their own offspring), will be able to benefit
from the resource in the future. Bequest value (BV) consists of the knowledge that
future generations may benefit by preserving important marine ecosystems
(McConnell, 1983). Existence value (EV) is defined as what people are willing to pay
to protect the marine ecosystems even if it does not render any benefit but simply
because it exists. Some economists (Feenberg and Mills, 1980) prefer the resource
valuation methodology used for nonmarket goods be based on observed consumption
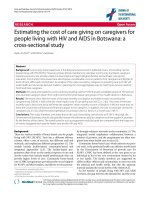
behavior. Total Economic Value framework and some examples for the values
generated by a marine ecosystem are presented in figure 2.1
Total economic value
Non-use value
Use value
Direct use
Extractive
Capture
fisheries
Non
extractive
Recreation
Tourism
Research
Education
Aesthetic
Indirect use
Biological support for
Flora
Coral reefs
Fisheries
Sea birds
Turtles
Physical Protection
Marine ecosystem
Beaches
Land forms
Coastal extension
Global life support
Carbon and
Calcium store
Option
Bequest
Future use
Future
generation
use
Existence
Coral reef
habitats
Endangered
species
Conservation and
preservation of marine bio
diversity
Figure 2.1 Total Economic Value framework: Use and non-use values of a marine eco system
Source: Adapted from Spurgeon et al, 1992 and Munasinghe and Lutz, 1993.
6
According to the literature there are three main families of valuation techniques. They
are direct market based approaches, revealed preference approaches, and stated
preference approaches.
(1) Market-based techniques use evidence from markets in which environmental
goods and services are traded, markets in which they enter into the production
functions for traded goods and services, or markets for substitutes or alternative
resources.
(2) Revealed preference methods estimate demand for an ecosystem good or
service through statistical analysis of individuals’ willingness to incur the costs
associated with benefiting from the good or service. Values of certain cultural
ecosystem services, notably recreation and aesthetic enjoyment, are often
assessed using these methods, but revealed preference techniques may also be
applied to any ecosystem service that involves incurring a measurable cost
(Luke et al., 2010). These methods only measure use values. There are two
main methods:
(a) Travel cost method (TC), which is mostly relevant for determining
recreational values related to biodiversity and ecosystem services. It is
based on the rationale that recreational experiences are associated with a
cost (direct expenses and opportunity costs of time). The value of a
change in the quality or quantity of a recreational site (resulting from
changes in biodiversity) can be inferred from estimating the demand
function for visiting the site that is being studied (Bateman et al., 1993).
(b) Hedonic pricing (HP) approach utilizes information about the implicit
demand for an environmental attribute of marketed commodities. For
instance, houses or property in general consist of several attributes, some
of which are environmental in nature, such as the proximity of a house to
a forest or whether it has a view on a nice landscape. Hence, the value of
a change in biodiversity or ecosystem services will be reflected in the
change in the value of property (either built-up or land that is in a (semi-)
natural state). By estimating a demand function for property, the analyst
can infer the value of a change in the non-marketed environmental
benefits generated by the environmental good (Luke et al., 2010).
7
(3) Stated preference methods are based on surveying representative samples of a
population in order to estimate willingness to pay for hypothetical changes in
ecosystem service provision. SP techniques are very widely applicable, used
for example for biodiversity, and are the most commonly used techniques to
capture non-use values (UNEP-WCMC, 2011).
(a) Contingent valuation uses a direct question of willingness to pay for a
specified change. Uses questionnaires to ask people how much they
would be willing to pay to increase or enhance the provision of an
ecosystem service, or alternatively, how much they would be willing to
accept for its loss or degradation.
(b) Choice experiments estimate implicit values from choices between
options with different specified characteristics. It attempts to model the
decision process of an individual in a given context (Hanley and Wright,
1998; Philip and MacMillan, 2005). Individuals are faced with two or
more alternatives with shared attributes of the services to be valued, but
with different levels of attribute (one of the attributes being the money
people would have to pay for the service).
According to the literature some valuation methods are more appropriate than others
for valuing particular ecosystem services and for the elicitation of specific value
components. Table 2.1 shows the links between specific methods and value
components.
8
Table 2.1 Relationship between valuation methods and value types
Approach
Method
Price-based
Market Prices
Avoided cost
Market
valuation
Cost- based
Productionbased
Revealed preference
Stated preference
Replacement cost
Mitigation/ Restoration cost
Production function
approach
Factor income
Travel cost method
Value
Direct and indirect
use
Direct and indirect
use
Direct and indirect
use
Direct and indirect
use
Indirect use
Indirect use
Direct (indirect
use)
Direct and indirect
use
Use and non-use
Hedonic pricing
Contingent valuation
Choice modelling/ Conjoint
Analysis
Use and non-use
Contingent ranking
Use and non-use
Deliberative group valuation Use and non-use
Source: UNEP-WCMC (2011)
Travel Cost Method:
Travel cost method is one of the methods which use to estimate the economic value of
environmental goods and services. It is generally used to calculate the economic value
the recreation sites.
Individual and Zonal TC methods
As discussed above travel cost method stated that the main costs of outdoor recreation
are the travel and time costs incurred to get to the recreation site. TCM is used to
derive the demand function for visits to a site and the area between the demand curve
and the price line gives the consumer surplus for that site. The TCM has been widely
used in the past for the values of recreational activities (Bennett,1996; Haab and
McConnell, 2003)The main advantage of the travel cost approach is that it is based on
actual choices rather than the stated preference (willingness to pay) in a hypothetical
situation (Shammi A and Tai S Y, 2013).
9
In individual travel cost method, use a more detailed survey data of individual visitor
to a particular site to estimate the recreational demand while in zonal travel cost
method mostly secondary data are used to estimate the recreational demand of that
particular site as a whole. The individual travel cost models are generally preferred
over the zonal travel cost model. The zonal travel cost model is statistically inefficient
since it aggregates data from a large number of individual observations into a few
zonal observations (Georgiou et al., 1987 in Sukanya das, 2013).
An advancement of the travel cost model was substantiated in 1947 by Harold
Hotelling, in reply to a request from the National Park Service on how to measure
benefits (Arrow and Lehmann, 2005). Following that, Clawson first estimated the
recreational demand by initiating the idea of TCM (Clawson, 1959; Clawson and
Knetsch, 1966) to estimate demand for a recreation site and measure the consumer
surplus (Bockstael, et al., 1986). According to Shammi A and Tai S Y, 2013, the travel
cost method possesses one of the most debatable weaknesses, which is accounting for
the opportunity cost of travel time, conducting multi-purpose sites and multidestination trips.
TCM has some limitations when valuing marine protected areas. TCM fails to give
true welfare measures because it is based on the traditional Marshallian demand curve
(Mitchell and Carson, 1989). Moreover, most of the visitors may be ‘meanderers’ or
multi-purpose or multi-site visitors that would cause distortions in the regression
analysis (Hanley and Spash, 1993).
Multi-destination trips:
Single destination trip involves the individual going directly to the recreation site, and
then returning directly to his or her home. Therefore all out-of-pocket cost and travel
time are used to visit the site in question for the recreation activity being modeled. A
multi-destination trip is such that an individual has another destination on the way to
the recreation site, nearby the recreation site or on the way back home. In this case we
cannot interpret the entire trip cost as the price paid for visiting any one particular site
(John et al, 2000). If these multi-destination observations are treated in the same way
as single destination trips, Haspel and Johnson, 1982 in John et al, 2000 claim that the
10
TCM will overestimate the benefits of a trip to the particular study site. To get rid of
this problem Smith and Kopp, 1980 suggested is to identify such individuals from
survey questions or statistical analyses and drop them from the sample. But then it will
underestimate the total recreational benefits of the site. Moreover to minimize this
problem Gum and Martin, 1975 have made a suggestion to identify the cost share of
each destination. Another way of dealing with these multi destination individuals is
separate travel cost by directly asking the people what share of their travel cost is
allocated to each destination, or dividing up total trip cost by length of stay at each
destination. Mendelssohn et al. (1992) have suggested treating multi-destination
visitors as demanding a bundle of sites. It is this bundle of sites that is valued. Parsons
and Wilson (1997) in their study treated the incidental visits to other recreation sites as
complements to the study site, and include multi destination trips in the demand
estimation. These multi-destination (MD) trips are distinguished from single
destination or primary purpose (PP) trips by a dummy variable in the regression. The
dummy variable and its interaction with price capture the shift and rotation of the
demand function, respectively.
Travel Time
According to Chae et al., 2011 the opportunity cost of travel time, which represents the
value of the time taken for travelling, is a sensitive issue in recreational demand
studies. While most travel cost studies have considered the opportunity cost of travel,
these have been applied in different ways such as using a fraction of wage rate,
excluding leisure time when calculating travel cost etc… (e.g. Cesario, 1976;
McConnell, 1992; etc.). There is no consistently agreed rule as to how these costs
should be applied. Cesario and Knetsch (1976) suggested that the opportunity cost of
travel time would be some proportion of the wage rate and used 60% of the wage rate
in a recreation analysis.
Cesario (1976) provided an early cogent discussion of the incorporation of the value of
time into travel cost models. Despite the decades of research into the value of time
Randall’s (1994) observation that “the cost of travel time remains an empirical
mystery” remains valid and estimating the value of travel time (or, in most cases,
11
rather the opportunity cost of time) remains a frequently discussed problem in the
literature on TCM (e.g., Hanley and Barbier 2009, Garrod and Willis 1999).
Regarding the value of on-site time, McConnel (1992) argued that the opportunity cost
of on-site time should be included in the price variable. McConnel concluded that
accounting for on-site time presents such a difficult problem that no systematic method
had been developed, either conceptually or empirically. Smith, Desvousges and
McGevney (1983) suggested that cost would be some proportion k of each individual’s
wage rate.
Cesario’s (1976) suggestion that commuter’s travel time values of 25–50% of an
individual’s wage rate was widely adopted. Using a fraction of wage rate has remained
probably the most common approach, with the compromise value of 33% being the
most broadly accepted level (Hellerstein and Mendelsohn 1993, Garrod and Willis
1999, Gürlük and Rehber 2008).
In a further development, Feather and Shaw (1999) used shadow wages (the values of
extra units of leisure time) as the opportunity cost of travel time and compared this
with previous approaches (using a fraction of wage rate and hedonic wage equations).
Climate change impacts on the visitation rates of visitors to HMP
Climate change has been defined as “a change in the state of the climate that can be
identified (e.g. using statistical tests) by changes in the mean and/or the variability of
its properties and that persists for an extended period, typically decades or longer” by
The Intergovernmental Panel on Climate Change (IPCC, 2007). IPCC definition of
Climate Change refers to any change in climate over time whether due to natural
variability or as a result of human activity and that is quite dissimilar in the usage of
the United Nations Framework Convention on Climate Change (UNFCCC), where
climate change refers to “a change of climate that is attributed directly or indirectly to
human activity that alters the composition of the global atmosphere and that is in
addition to natural climate variability observed over comparable time periods” (IPCC,
2007). Both natural and anthropogenic drivers cause climate change. Sea level rise,
global warming, changes in precipitation patterns, increase in extreme climate events
are some of the climate change impacts identified. Sri Lanka being an island is
12
susceptible to these identified climate change impacts. IPCC’s Forth Assessment
Report (AR4) in 2007 projected a global average temperature increase in the range of
0.3- .4 0C at the end of the 21st century (IPCC, 2007). Not only that these impacts of
climate change surely make negative influence on environmental processes but also
many socio economic activities of the country are vulnerable to these bad impacts.
Sea level rise is also a result of warmer climate. It may cause many negative
consequences to the marine eco systems including flooding, salinization of fresh
water, damage to infrastructure and beach erosion, According to Cruz et al, 2007 the
current sea level rise rate in coastal areas of Asia is reported to be 1-3 mm per year
which is marginally greater than the global average. With the increase of global
warming sea level rise is accelerated. It will cause socio economic problems to coastal
regions and coastal eco systems specially with the coastal erosion and inundation. Sri
Lanka being a country with beautiful low lying beaches attracts many local and
foreign visitors. It creates many employment opportunities around HMP which is
situated in south down of Sri Lanka.
Despite the popularity of the marine protected areas as a management tool, increasing
evidence shows that many fail to achieve conservation objectives. Although several
MPAs exist in Sri Lanka, most are not managed, and resource extraction and habitat
degradation continue unabated. At present the declaration and management of many
MPAs is carried out without adequate consideration of the ecology, socio economic
realities, or long term management sustainability. MPAs vary from large fishery
reserves and multiple use parks to small strict conservation zones and sanctuaries
depending on habitat, resource available for management and conservation objectives
(Nishan et al, 2007).
Cabinet approval had been granted to the Ministry of Fisheries in 1980 to declare
Hikkaduwa harbor area as a marine sanctuary and it was not preceded. Then in 1982
under the Inter Ministerial Committee on Marine Parks and Sanctuaries formed by
National Aquatic Resources Agency (NARA) Hikkaduwa was declared as a marine
sanctuary in order to conserve coral reefs in the near shore. However the absence of
proper management and anthropogenic activities caused the reef degrade. Glass
bottom boat anchoring on the live corals, reef walking by visitors and glass bottom
13
operators, coral and shell collection, effluent discharges from hotels, ornamental fish
collection, sedimentation due to coastal erosion, coastal construction and river runoff
are few reasons which resulted in coral reef degradation. In 1985 De Silva and
Rajasuriya proposed a management strategy and some recommendations such as
displaying colorful boards which indicates the sanctuary area and its regulations,
licensing glass bottom boats through local government authorities and zonation of the
reef area. Further management actions taken by the management authorities were not
succeed. For an example, attempt was taken to stop fishing with in the sanctuary by
the Department of Wild life Conservation in 1993 and it was not succeeded due to
conflicting interests and legislations. More over the guards assigned by the Department
of Wild life Conservation to protect the reef from destructive actions were not
successful in preventing major causes to damage the coral reef (Rajasuriya et al,
1995).
There is lack of proper management plan to HMP yet. Literature shows that earlier
management efforts were failed due to lack of information on the value of recreation
site which did not enter the cost/ benefit analysis. There is lack of literature on the
estimation of the value of the recreation site even. Rajasuriya et al, 1995 highlighted
the need of research to develop economic models to determine the value of reef
resources and how they can be used in a sustainable and it recommends to carry out
awareness program on the value of the reef adjacent area and the coral sanctuary
which is now treat as a marine park to educate its stakeholders. Hence there is a need
to estimate the recreation value of HMP to implement a proper management plan.
14