Sams Microsoft SQL Server 2008- P6
Bạn đang xem bản rút gọn của tài liệu. Xem và tải ngay bản đầy đủ của tài liệu tại đây (1.33 MB, 50 trang )
ptg
231
Tablix (New in 2008) = Table, Matrix, List
13
FIGURE 13.11
Simple Tablix design.
To properly color the entire row (or column), you can use the following expression in
the
BackgroundColor
property of the innermost group, where
RowGroup1
is the name of
the row group:
=IIF(Not InScope(“RowGroup1”), “LightGrey”, “White”)
Because a cell in a Tablix contains one or more report items, you format the result by
formatting those items. For example, a cell that presents textual information contains a
Textbox report item. By setting properties and formatting text in a Textbox report item,
you can manipulate the rendering outcome.
For example, you can conditionally hide row data by setting the
Hidden
property of each
cell to
True
. Chapter 14 shows an example of this.
We frequently use several properties of a Tablix in our work. To set these properties, select
the entire Tablix by either clicking the Tablix’s corner handler or selecting the Tablix from
the drop-down list on the Properties window. The frequently used properties are as follows:
. Filters: A set of filter expressions for a Tablix. Filters limit data displayed by a
Tablix much like the
WHERE
clause limits results of a query. Whereas in most of the
cases you want to actually leverage a
WHERE
clause to improve performance and
reduce unnecessary network traffic, you still need to have a filter (for example, in
situations when you can’t change a data set).
. FixedColumnHeaders and FixedRowHeaders: When set to
True
, these keep
column and row headers displayed when the user scrolls through Tablix.
From the Library of STEPHEN EISEMAN
Please purchase PDF Split-Merge on www.verypdf.com to remove this watermark.
ptg
232
CHAPTER 13 Working with Report Items
. GroupsBeforeRowHeader: Skips the specified number of column groups before
displaying row headers. Tablix will display columns of data and then row headers.
. LayoutDirection: A direction of column expansion. Left to right (
LTR
, default) or
right to left (
RTL
).
. NoRowsMessage: When a data set returns no results, SSRS renders this message
rather than an empty data region.
. OmitBorderOnPageBreak: Determines the border display when a report item
spans multiple pages.
. RepeatRowHeaders and RepeatColumnHeaders: When
True
, SSRS will repeat
column and row headers for a Tablix that spans multiple pages.
. SortExpressions: A set of sort expressions for a whole Tablix. You can also define
sort expressions for a group.
Practical Application of Report Items
It is time to put your knowledge to practical use. By now, you have sufficient knowledge
to put fairly complex reports together. Let’s create a Sales Order summary report.
Adventure Works’s management requested a report that displays selected properties of an
order header (ship and bill to addresses, contact information, and billing summary) and
selected properties of an order’s line items (product name, unit price, order quantity, and
line total). Adventure Works requires each report to have a company logo. To meet these
requirements, let’s complete the following steps:
1. Create a new report. For the purpose of this exercise, we will reuse the
AdventureWorks shared data source that we created in earlier chapters. From the
Report Data window, select New, Data Source. Name the data source
AdventureWorks
, select the Use Shared Data Source Reference option and choose
AdventureWorks. (Yes, both data sources can have the same name.)
2. In the Report Data window, right-click the AdventureWorks data source and select
Add Dataset. Name the data set
Order_Header
.
Order_Header
will contain data
selected from a join between
SalesOrderHeader
,
Address
, and
StateProvince
tables.
3. To have a more complete picture of an order and include both shipping and billing
addresses, you need to include
Address
and
StateProvince
tables twice in the
Order_Header
data set. Create aliases for the first set of
Address
and
StateProvince
tables as
BillToAddress
and
StateProvinceBill
, and use
ShipToAddress
and
StateProvinceShip
aliases for the second set of tables. To create an alias for a table,
right-click a table in a Graphical Query Designer, select Properties from the shortcut
menu, and fill the Alias field as needed. Alternatively, you can edit the query text
directly.
4. Create an alias for each field you want to include on a report. You can prefix fields
with
Ship
or
Bill
for tables related to shipping and billing addresses, respectively.
For our sample, we have included the following fields from
SalesOrderHeader
table:
From the Library of STEPHEN EISEMAN
Please purchase PDF Split-Merge on www.verypdf.com to remove this watermark.
ptg
233
Practical Application of Report Items
13
OrderDate
,
TaxAmt
,
SubTotal
,
Freight
,
TotalDue
,
Comment
,
ShipDate
. We also
included the following fields from
Address
(and
StateProvince
) tables:
AddressLine1
,
City
,
PostalCode
, and
StateProvinceCode
(this is from
StateProvince
table). Based on whether the address is shipping or billing, we have
prefixed aliases for the fields with Ship or Bill, correspondingly.
5. Create an
Order_Detail
data set. This data set contains data selected from a join
between
SalesOrderHeader
. (This table will provide a cross-reference between
SalesOrderNumber
and
SalesId
,
SalesOrderDetail
, and
Product
tables.) The fields
that we have selected for our sample are
SalesOrderDetail.OrderQty
,
SalesOrderDetail.UnitPrice
,
SalesOrderDetail.LineTotal
,
Product.Name
.
6. To retrieve a specific order, let’s use parameter
@SalesOrderNumber
in the
WHERE
clause of both data sets:
WHERE
SalesOrderHeader.SalesOrderNumber = @SalesOrderNumber).
The resulting queries are as follows:
Order_Header
SELECT Sales.SalesOrderHeader.OrderDate, Sales.SalesOrderHeader.TaxAmt,
Sales.SalesOrderHeader.SubTotal, Sales.SalesOrderHeader.Freight,
Sales.SalesOrderHeader.TotalDue, Sales.SalesOrderHeader.Comment,
Sales.SalesOrderHeader.ShipDate, BillToAddress.AddressLine1 AS
BillAddressLine1,
BillToAddress.City AS BillCity, BillToAddress.PostalCode AS BillPostalCode,
StateProviceBill.StateProvinceCode AS BillStateProvinceCode,
ShipToAddress.AddressLine1 AS ShipAddressLine1,
ShipToAddress.City AS ShipCity, ShipToAddress.PostalCode AS ShipPostalCode,
StateProviceShip.StateProvinceCode AS ShipStateProvinceCode
FROM
Sales.SalesOrderHeader
INNER JOIN Person.Address AS BillToAddress ON
Sales.SalesOrderHeader.BillToAddressID =
BillToAddress.AddressID AND
Sales.SalesOrderHeader.ShipToAddressID = BillToAddress.AddressID AND
Sales.SalesOrderHeader.BillToAddressID = BillToAddress.AddressID AND
Sales.SalesOrderHeader.ShipToAddressID = BillToAddress.AddressID
INNER JOIN Person.StateProvince AS StateProviceBill ON
BillToAddress.StateProvinceID = StateProviceBill.StateProvinceID
INNER JOIN Person.Address AS ShipToAddress ON
Sales.SalesOrderHeader.BillToAddressID = ShipToAddress.AddressID AND
Sales.SalesOrderHeader.ShipToAddressID = ShipToAddress.AddressID AND
Sales.SalesOrderHeader.BillToAddressID = ShipToAddress.AddressID AND
Sales.SalesOrderHeader.ShipToAddressID = ShipToAddress.AddressID AND
Sales.SalesOrderHeader.BillToAddressID = ShipToAddress.AddressID AND
Sales.SalesOrderHeader.ShipToAddressID = ShipToAddress.AddressID AND
From the Library of STEPHEN EISEMAN
Please purchase PDF Split-Merge on www.verypdf.com to remove this watermark.
ptg
234
CHAPTER 13 Working with Report Items
StateProviceBill.StateProvinceID = ShipToAddress.StateProvinceID
INNER JOIN Person.StateProvince AS StateProviceShip ON
BillToAddress.StateProvinceID = StateProviceShip.StateProvinceID AND
ShipToAddress.StateProvinceID = StateProviceShip.StateProvinceID
WHERE
Sales.SalesOrderHeader.SalesOrderNumber = @SalesOrderNumber
Order_Detail
SELECT Sales.SalesOrderDetail.OrderQty, Sales.SalesOrderDetail.UnitPrice,
Sales.SalesOrderDetail.LineTotal, Production.Product.Name
FROM
Sales.SalesOrderHeader
INNER JOIN Sales.SalesOrderDetail ON
Sales.SalesOrderHeader.SalesOrderID = Sales.SalesOrderDetail.SalesOrderID
INNER JOIN Production.Product ON
Sales.SalesOrderDetail.ProductID = Production.Product.ProductID
WHERE
Sales.SalesOrderHeader.SalesOrderNumber = @SalesOrderNumber
7. Add the company logo image report item. From Windows File Explorer, drag the
image item and drop it onto the report body. Change the name to
Logo
. (Refer back
to Figure 13.1 to see the Image Properties dialog box.)
8. Add a list by dragging a List item from the Toolbox. As you remember, List is a
template for Tablix. You can take advantage of the
Dataset
property of the List item
to avoid typing scope resolution for each of the simple report items, such as
Textboxes, included on the List report item.
9. As an experiment, drag and drop the
ShipCity
field of
Order_Header
outside of the
List item. Note the value of the text box outside of the list is
=First(Fields!ShipCity.Value, “Order_Header”)
. As a comparison, drag and drop
the
ShipCity
field on the list. Note the value of the created text box is
=Fields!ShipCity.Value
. Also note that the
DataSetName
property of the list is now
set to
Order_Header
, and it was blank originally. Be careful when dropping fields
from other data sets to a list. If you do so, BIDS will update
DataSetName
to the data
set associated with the last drop, potentially invalidating the scope resolution for
other items.
10. Add a report heading. Drag and drop a text box from the Toolbox. Enter the follow-
ing expression as a value:
=”Sales Order Number” & “ - “ &
First(Fields!SalesOrderNumber.Value, “Order_Header”)
. This expression concate-
nates the constant
”Sales Order Number - SO#####”
and the value of the
SalesOrderNumber field. To highlight the heading of the report, increase the font
size and change the text box background.
11. Add and arrange data fields in the page header by dragging and dropping data set
fields on the list: Street, City, State, and Zip from both billing and shipping
addresses. Second, add billing summary fields. Add Textbox items to title values that
From the Library of STEPHEN EISEMAN
Please purchase PDF Split-Merge on www.verypdf.com to remove this watermark.
ptg
235
Chart Repor t Item (Improved in 2008)
13
were added, such as a text box stating Ship To Address. Change the heading for
information sections to bold font.
12. Add lines to help separate informational pieces as necessary. Note that not all the
web browsers support overlapping controls, such as lines. If you need to cross lines,
you might need to have several lines bordering each other.
13. Add a table to display details of an order. Drag and drop a Table item from the
Toolbox. The default table has three rows and three columns. Drag and drop the
Order_Detail
fields to the Detail area of the table, and note how the heading is
changed to the name of the field.
14. To summarize line-item charges, right-click the detail row and select Insert Row,
Outside Group Below from the context menu. This row becomes a footer of the table.
15. In the rightmost cell of the row, enter the following summarization expression:
=Sum(Fields!LineTotal.Value)
.
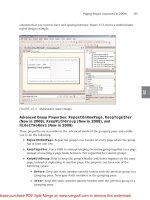
The resulting design-time view of the report should look similar to Figure 13.12.
Chart Report Item (Improved in 2008)
A Chart report delivers a graphic presentation of data from a single data set. Chart has
comprehensive functionality and has similar capabilities to an Excel chart, including a
variety of chart types, 3D effects, trend lines, and more.
FIGURE 13.12
Design picture of the Sales Order Summary repor t.
From the Library of STEPHEN EISEMAN
Please purchase PDF Split-Merge on www.verypdf.com to remove this watermark.
ptg
236
CHAPTER 13 Working with Report Items
Microsoft significantly overhauled chart capabilities in SSRS 2008 and added the following:
. New chart types, such as bar/column cylinder, pyramid, funnel, polar, radar, stock,
candlestick, range column, range bar, smooth area, smooth line, stepped line, box
plot, Pareto, and histogram.
. Secondary axes support.
. Calculated series functionality that allows you to select 15 commonly used calcula-
tions, including statistical analysis, moving averages, and financial indicators.
. More control over common chart elements like
Legends
,
Titles
,
Axes
(such as
custom axis intervals, reverse direction, set alternating bands on a chart [interlaced
lines]), and
Labels
(such as automatic label interval to avoid collisions, customizable
rotation angles, font size, and text-wrap properties for axis label calculations).
. New interface and new, more appealing chart design.
. Support of multiple chart areas, multiple legends, and multiple titles on the same
chart.
The Chart control used in this release of Reporting Services is licensed from Dundas
Software (www.dundas.com). You can obtain an add-on pack for Reporting Services from
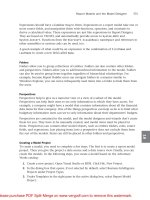
Dundas Software. Figure 13.13 shows a design-time view of a chart after you click the
design surface of the chart. Note the three drop areas: Series, Category and Data.
Unlike the previous version, the Chart Properties dialog box no longer provides compre-
hensive control over a chart’s properties. A chart’s context menu provides an interface to
access properties for various chart components. To access this menu, right-click a chart to
display a shortcut menu. This shortcut menu enables you to access various components of
a chart (see Figure 13.14).
Chart Data (Value)
A chart requires at least one set of data values associated with it. You can simply drag and
drop a field to the Design area (it has a Drop Data Fields Here note) of a chart. The data
determines the y-axis value. For example, for a column chart, the data determines the
height of a column.
Data is considered static. For a column chart, it means that a single data file added to a
chart (and no series) results in a single column providing a sum of all values and a single
legend. If you add one more data fields to a chart, SSRS shows a second column and adds
a second legend.
In most charts, we group data by a series or a category. In this case, you must use an
aggregate expression for a data value. This is similar to grouping in a Tablix where non-
aggregate expressions are syntactically allowed. However, the result contains the last value
of a field rather than a summary value for a group and, therefore, produces an unexpected
result. Report Designer automatically adds an aggregate function, but changes are allowed.
To verify or change the data value expression, you can right-click a field you added and
select Series Properties from the context menu.
From the Library of STEPHEN EISEMAN
Please purchase PDF Split-Merge on www.verypdf.com to remove this watermark.
ptg
237
Chart Repor t Item (Improved in 2008)
13
Data field
Minor gridlines
appear here
when set up
Category field
Axis label categoryAxis label categoryAxis label categoryAxis label categoryAxis label category
Data Point label appears like this when set up
Minor tick marks appear between major tick marks when set up
Major tickmark
Major tickmarkMajor tick mark
Major gridline
Major gridlineMajor gridline
Legend
98.5
Axis label value
Series
Data Point marker will be here when set up
FIGURE 13.13
Design-time picture of a chart.
Chart can display only numeric data. You can convert formatted strings (such as
”123.123”
) to numbers either in a query or using SSRS expressions.
Different chart types handle
Null
(or empty) values from a data set differently: In an X-Y
graphic chart, you will have gaps for empty values, for example, and a nonlinear chart
(such as pie, doughnut, funnel, or pyramid) simply skips the display of
Null
values. You
can eliminate
Null
values in a query or through expressions.
Alternatively, you can use the chart’s empty-point-handling capability:
1. On the chart’s design surface, click the series that contains
Null
values. BIDS
displays properties for the series in the Properties pane.
2. Expand the EmptyPoint node and set the Color property.
3. In the EmptyPoint node, expand the Marker node.
4. Under the Marker node, set the MarkerType property.
From the Library of STEPHEN EISEMAN
Please purchase PDF Split-Merge on www.verypdf.com to remove this watermark.
ptg
238
CHAPTER 13 Working with Report Items
FIGURE 13.14
Chart context menu.
NOTE
Some chart types handle empty points automatically, by either connecting across a
missing point or simply skipping a display of a missing value altogether.
Table 13.6 provides partial RDL of Chart Data. From this point forward in this book, the
section surrounded by the
<ChartData>
tag is abbreviated as
{CHART DATA}
.
TABLE 13.6
Partial Set of Tags for Char t Data RDL
Element Explanation
<ChartData>
Begin the Chart Data section.
<ChartSeriesCollection>
Collection of series. Each series in a collection has
associated data points and describes how those
points look on a chart.
<ChartSeries Name=”Standard-
Cost”>
<ChartDataPoints>
<ChartDataPoint>
<ChartDataPointValues>
<Y> =Sum(Fields!Standard-
Cost.Value)
Names comes from a data field associated with a
series, the value from the
StandardCost
field.
From the Library of STEPHEN EISEMAN
Please purchase PDF Split-Merge on www.verypdf.com to remove this watermark.
ptg
239
Chart Repor t Item (Improved in 2008)
13
Chart Series
Data series are optional and when added create series labels that are placed in the legend
of the chart. Series groups are dynamic. A chart that uses series groups displays a chart
element for each series group for each category. For example, a column chart with sales
data displays a column for each year returned by a series group expression.
Following is the RDL that describes series. From this point forward, the section surrounded
by the
<ChartSeriesHierarchy>
tag is abbreviated as
{CHART SERIES}:
<ChartSeriesHierarchy>
<ChartMembers>
<ChartMember>
<Group Name=”Chart4_SeriesGroup1”>
<GroupExpressions>
<GroupExpression>=Fields!Name.Value</GroupExpression>
</GroupExpressions>
</Group>
<Label>=Fields!Name.Value</Label>
</ChartMember>
</ChartMembers>
</ChartSeriesHierarchy>
TABLE 13.6
Continued
Element Explanation
<ChartDataLabel>
<Label>
=Sum(Fields!ProductID.Value,
“ProductCostHistory”)
Each point on chart can have a label. It is common to
see an actual value next to a data point.
<ChartMarker>
Allows formatting a marker. A marker is a graphical
highlight of a data point on a graph. On a line chart, a
marker enables you to highlight the difference
between a connector line and the actual data.
<Type>Line</Type>
Chart type. In this case, it is
Line
.
<ChartEmptyPoints>
Describes how to handle empty or null data in a
series.
<ValueAxisName>Primary
<CategoryAxisName>Primary
Axes and series association.
From the Library of STEPHEN EISEMAN
Please purchase PDF Split-Merge on www.verypdf.com to remove this watermark.
ptg
240
CHAPTER 13 Working with Report Items
Chart Category
Chart Category Groups is the optional mechanism of grouping data that provides the
labels for chart elements.
For example, in a column chart, Country Name fields placed in the Category region gener-
ate country labels for x-axes (United States, Italy, and so forth).
You can nest categories. Multiple categories nest x-axes labels. For example, in a column
chart with sales data, the first category group could be a county, and the second category
group could be TerritoryId. The column chart would display groupings of products by
TerritoryId on the x-axis.
Following is the RDL that describes a category grouping. From this point forward, the
section surrounded by the
<ChartCategoryHierarchy>
tag is abbreviated as
{CHART
CATEGORY}
:
<ChartCategoryHierarchy>
<ChartMembers>
<ChartMember>
<Group Name=”Chart4_CategoryGroup1”>
<GroupExpressions>
<GroupExpression>=Fields!StartDate.Value</GroupExpression>
</GroupExpressions>
</Group>
<Label>=Fields!StartDate.Value</Label>
</ChartMember>
</ChartMembers>
</ChartCategoryHierarchy>
Chart Areas
The Chart area contains the plotting area of a chart and axes related items such as axes
labels and axes titles. A single chart may have multiple areas, but contains only one area
by default. A data series could be connected to only one area through the
ChartArea,
Name
property. When you add a new series, BIDS automatically assigns
ChartArea, Name
=
Default
. You will need to change
ChartArea, Name
property to associate series with a
different Chart area.
While you can combine most of the charts types (like line and column) on a single Chart
area, for some (such as bar, polar, and shape) you may need to add a new area to accom-
modate them. Table 13.7 provides a partial list of a chart area’s RDL elements.
From the Library of STEPHEN EISEMAN
Please purchase PDF Split-Merge on www.verypdf.com to remove this watermark.
ptg
241
Chart Repor t Item (Improved in 2008)
13
Chart’s RDL
A rudimentary chart is described by the following structure:
Chart Name=”chart1”>
{CHART SERIES}
{CHART CATEGORY}
{CHART AREAS}
{CHART LEGENDS}
{CHART TITLES}
{CHART DATA}
{LOCATION}
<DataSetName>DataSet1</DataSetName>
</Chart>
A real-life chart has additional elements in its RDL. These elements describe graphical
presentation properties for a chart.
Reporting Services supports the following chart types: area, bar, column, line, polar, range,
scatter, and shape. Table 13.8 provides a description of each type and each type’s variants.
<ChartAreas>
<ChartArea
Name=”Default”>
The
Chart Area
is a plotting area of a chart and
axes-related items.
<ChartCategoryAxes>
<ChartAxis Name=”Primary”>
Describes the x-axes of a chart (primar y and
secondary).
<ChartAxisTitle>
Title
explains the meaning of the x-axes. For
example, in the case of countries, it may simply
state
Countries
.
<ChartMajorGridLines>
<ChartMinorGridLines>
Properties of major and minor gridlines: style of
gridline line, visibility.
<ChartMinorTickMarks>
<ChartMajorTickMarks>
Properties of tick marks. A tick mark extends the
gridlines through an axis. It is similar to marks on a
ruler.
<Angle>-35</Angle>
<LabelsAutoFitDisabled>true</
LabelsAutoFitDisabled>
Properties of labels for each axis.
LabelsAutoFit
ensures that labels do not overlap. When
AutoFit
is disabled, you can rotate a label yourself so that
it does not overlap.
<ChartValueAxes>
<ChartAxis Name=”Primary”>
Describes the y-axes of a chart (primar y and
secondary) .
TABLE 13.7
Partial List of Elements for a Char t Area’s RDL
Element Explanation
From the Library of STEPHEN EISEMAN
Please purchase PDF Split-Merge on www.verypdf.com to remove this watermark.
ptg
242
CHAPTER 13 Working with Report Items
Best Practices
Chart design best practices can be summed up as this: Make a picture that is worth a thou-
sand words. With that in mind, a report designer wants to make sure that a chart is
simple, meaningful, and efficient. A good chart:
. Includes relevant data (excludes irrelevant). For example, it does not make sense to
chart daily values if your business client wants to see quarterly aggregations of data.
Of course, as needed, you can allow your customer to drill through the data to deter-
mine whether a spike in the revenue is a result of the entire quarter or a single week
when a company had a successful marketing campaign.
TABLE 13.8
Chart Types
Chart
Type
Variants Description
Area Area, smooth area, stacked area, 100%
stacked area, and 3D variations
Displays data as a set of points
connected by a line, with a filled-in
area below the line.
Bar Bar, stacked bar, 100% stacked bar, and
3D variations
Displays data as sets of horizontal
bars.
Column Column, stacked column, 100% stacked
column, and 3D variations
Displays data as sets of vertical
columns. Includes information about
hybrid column/line charts.
Line Line, smooth line, stepped line, and line
with markers
Displays data as a set of points
connected by a line.
Polar Polar, radar, and 3D radar Displays a series as 360-degree points
grouped by category. Values are
displayed by the length (the farther, the
greater value).
Range Range, smooth range, range column,
range bar, stock, candlestick, error bar,
and boxplot.
Displays data as a set of lines with
markers for high, low, close, and open
values.
Scatter XY
Bubble, 3D bubble
Displays data as a set of points in
space.
Displays data as a set of symbols
whose position and size are based on
the data in the chart.
Shape Pie, exploded pie, doughnut, exploded
doughnut, funnel, pyramid, and 3D varia-
tions.
Displays data as percentages of the
whole.
From the Library of STEPHEN EISEMAN
Please purchase PDF Split-Merge on www.verypdf.com to remove this watermark.
ptg
243
Practical Application of a Chart
13
. Is clear to read and does not have overlaps. All labels, including axes and data point,
are spaced appropriately and do not overlap. You either minimize the number of
data points or format labels appropriately to avoid overlaps.
. Clearly marks empty values to avoid unclear gaps: Is this value zero or missing?
. Displays series of data and not a single value. A Gauge report provides better graphi-
cal representation of a single value.
Practical Application of a Chart
Let’s apply the knowledge from this chapter to create a report.
To create a report that displays sales by country and by year, including graphical presenta-
tion of sales data, complete the following steps.
1. Similar to steps presented in the “Practical Application of Report Items” section of
this chapter, add a new report with a data set based on the following query:
SELECT
SUM(SOH.TotalDue) AS Sales,
DATENAME(yyyy, SOH.OrderDate) AS Year,
A.Name AS CountryName
FROM
Sales.SalesOrderHeader AS SOH
INNER JOIN Sales.SalesTerritory AS ST ON SOH.TerritoryID = ST.TerritoryID
INNER JOIN Person.CountryRegion AS A ON ST.CountryRegionCode =
➥A.CountryRegionCode
GROUP BY
ST.Name, DATENAME(yyyy, SOH.OrderDate), A.Name
ORDER BY
ST.Name, Year
2. Drag and drop a Chart item onto a report. Note the drop areas: Drop Data Fields
Here, Drop Category Fields Here, and Drop Series Fields Here. Leave default chart
selection (Column chart) and click OK to accept. Feel free to experiment with other
chart types.
3. Drag and drop the Sales field onto the Data area, the CountryName field onto the
Category area, and the Year field onto the Series area.
4. Set the chart’s title to
Sales By Country
, the category (x) axes title to
Country
, and
the value (y) axes to
USD$
.
Click the y-axis label (you might need to click twice depending on the original
state of a chart) to select it. Right-click the selection and choose Axis Properties
from the context menu. Click the Number tab. This tab allows you to format axis
From the Library of STEPHEN EISEMAN
Please purchase PDF Split-Merge on www.verypdf.com to remove this watermark.
ptg
244
CHAPTER 13 Working with Report Items
labels. Choose appropriate formatting. We have chosen the options shown in
Figure 13.15.
5. Click the x-axis label to select it. Right-click and select Axis Properties from the
context menu. A Category Axis Properties dialog box will display. Click the Labels
tab. Notice the Enable Auto-Fit selections (see Figure 13.16). You can experiment with
options and disable Auto-Fit, choosing instead to rotate labels by a specified angle.
6. Preview the results. Suppose we manage U.S. sales and by looking at the chart we see
that somehow 2004 was a bad year as compared to 2003. We also see that this was
the case across all counties. Is this a global recession or another anomaly? Let’s
design a chart that shows us the monthly breakdown of the U.S. sales.
7. Drag and drop another Chart item onto a report. In this chart, we will present only
U.S. sales aggregated on a monthly basis.
8. Add a new data set based on the following query. Note that the query is essentially
the same as the earlier query, but with an added
Month
field and
HAVING
clause for
the United States (changes in bold):
SELECT
SUM(SOH.TotalDue) AS Sales,
DATENAME(yyyy, SOH.OrderDate) As Year,
MONTH(SOH.OrderDate) AS Month,
A.Name AS CountryName
FROM
FIGURE 13.15
Number tab of the Axis Properties dialog box.
From the Library of STEPHEN EISEMAN
Please purchase PDF Split-Merge on www.verypdf.com to remove this watermark.
ptg
245
Practical Application of a Chart
13
FIGURE 13.16
Labels tab of the Axis Properties dialog box.
Sales.SalesOrderHeader AS SOH
INNER JOIN Sales.SalesTerritory AS ST ON SOH.TerritoryID = ST.TerritoryID
INNER JOIN Person.CountryRegion AS A ON ST.CountryRegionCode =
➥A.CountryRegionCode
GROUP BY ST.Name, DATENAME(yyyy, SOH.OrderDate),
MONTH(SOH.OrderDate), A.Name
HAVING MAX(ST.CountryRegionCode) = ‘US’
ORDER BY ST.Name, Year, Month
9. Drag and drop the Sales field onto the Data area, and both the Year and Month
fields onto the Category area.
10. Format axis labels and change titles appropriately.
11. Preview the results. Now we can see that 2004 has only partial data available (six
months specifically). It also looks like overall sales are increasing. Let’s add a trend
line to be sure.
12. In the Drop Data Fields Here area, right-click the Sales series and select Add
Calculated Series from the context menu. BIDS then opens a Calculated Series
Properties dialog box.
NOTE
If you happen to add fields to the Drop Series Fields Here area, BIDS will hide the Add
Calculated Series option from the context menu.
From the Library of STEPHEN EISEMAN
Please purchase PDF Split-Merge on www.verypdf.com to remove this watermark.
Download at WoweBook.com
ptg
246
CHAPTER 13 Working with Report Items
13. Select Exponential Moving Average and use 12 periods to better see annual trends.
Also check Start from First Point to see the trend line starting from the beginning of
the graph and not 12 periods after.
14. Click the Border tab and set the line width to 3 points. This will make the trend line
easier to view. Click OK to close and preview. You should see something similar to
Figure 13.17.
Gauge Report Item
A Gauge report is a great tool to graphically display key performance indicators (KPIs). In
the previous version of SSRS, you had to use a workaround and display various images,
depending on the state of the KPI. (For example, for a thermometer, you had to display
four images of a thermometer depending on what quartile the temperature value was in.)
You can still use the same technique in this version, especially if there is no gauge avail-
able to satisfy your needs. For example, because a smiley-face gauge is not available, you
would instead display an image of a smiley face when the company is meeting its revenue
targets and a sad face when it is not.
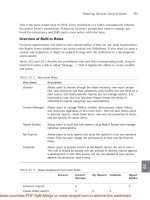
Figure 13.18 shows a design view of a gauge.
SSRS includes linear and radial charts. You select a gauge type when you add a Gauge item
to your report. Because a gauge consists of multiple components, you cannot change the
type of gauge after it has been added to a report. However, you can manipulate individual
FIGURE 13.17
Chart at work.
From the Library of STEPHEN EISEMAN
Please purchase PDF Split-Merge on www.verypdf.com to remove this watermark.
ptg
247
Gauge Report Item
13
Gauge frame
Range
Scale
Major tick mark
Minor tick mark
Data/value drop zone
Pointer cap
Pointer
Scale label
FIGURE 13.18
Design view of a gauge.
components of a gauge to “change” its type. For example, on a radial gauge, you can set
StartAngle=0
and
SweepAngle=360
to convert to a full circle scale.
By default, a gauge has one scale and one pointer. You can add scales and pointers and
associate between scales and pointers. There are four types of pointers: marker, bar, ther-
mometer, and needle. A needle pointer is available only for a radial chart.
To display values using a gauge, follow these steps:
1. Drag and drop a field onto the surface of a gauge.
2. Create a pointer and drag and drop a field to a pointer placeholder.
Upon drop completion, you might notice that a gauge uses
Sum()
aggregation for the
numeric fields and
Count()
for non-numeric fields.
Table 13.9 lists some of the more commonly leveraged properties of a gauge.
TABLE 13.9
Gauge Properties
Property Action
MaximumValue
and
MinimumValue
Ending and beginning value of the scale
StartValue
and
EndValue
Move, expand, and contract the gauge’s range
StartWidth
Convert the beginning of the gauge range to a pointy or fat
shape
From the Library of STEPHEN EISEMAN
Please purchase PDF Split-Merge on www.verypdf.com to remove this watermark.
ptg
248
CHAPTER 13 Working with Report Items
You can add multiple gauges to a gauge panel. A panel is a container for gauges.
Chapter 17, “Working with Multidimensional Data Sources,” includes an example of a
gauge in use.
Report Body Versus Page Header/Footer
The report body can contain any SSRS items, including data regions. The page header and
footer can only contain independent report items, such as Textbox, Line, and Rectangle.
More complex page header and footer functionality can be implemented with Tablix and
the
RepeatOnNewPage
property.
To add a page header or footer, right-click the Design area surrounding a report and select
Add Page Header or Add Page Footer from the context menu. To remove, right-click the
Design area surrounding a report and select Remove Page Header or Remove Page Footer
from the context menu. Add and remove menu entries depending on whether a page
header (or footer) is already visible. BIDS does not keep track of report items from a
removed page header/footer. You effectively delete all the items from a removed page
header/footer. You can, however, use an undo action (Edit, Undo) to restore a recently
removed page’s header/footer (together with original items).
Normally, you use page headers and footers to display page-related data, such as page
number (
=Globals.PageNumber
). Other expressions that you may use in page header (or
footer) include the following:
. Aggregation of data from a single page,
=Sum(ReportItems!TextboxSales.Value)
. This
is possible because the
ReportItems
collection contains all the text boxes on a page.
. Aggregation of data from a data set,
=Sum(Fields!Sales.Value,”DataSet1”)
.
Both page footer and page headers have
PrintOnFirstPage
and
PrintOnLastPage
proper-
ties, which are visible in the Properties window when you click the page header (or
footer). Those properties control whether a header or footer is rendered on the first and
last pages and are pretty much self-explanatory.
Summary
Report items are the presentation elements within SSRS.
Data regions function as a repetitive display of rows, groups of rows, or columns from a
data set associated with a region. Data regions include Tablix (Table, Matrix, List), Chart,
and Gauge. Data regions cannot be included in page headers or page footers.
Other report items are used for display purposes and are commonly called independent
report items. These items include Line, Rectangle, Textbox, and Image.
From the Library of STEPHEN EISEMAN
Please purchase PDF Split-Merge on www.verypdf.com to remove this watermark.
ptg
249
Summary
13
Data regions and independent report items support navigation; see Chapter 16 for more
information.
Containers can include other reporting items. Items placed in a container become the
container’s children, and the container becomes the parent. Tablix, Rectangle, Report
Body, Page Header, and Page Footer are containers.
In the following chapter, you build on this knowledge by learning how to group, sort, and
aggregate data within a given scope of a data region. By learning how to use report items
and group data effectively, you will be able to create advanced reports in no time.
From the Library of STEPHEN EISEMAN
Please purchase PDF Split-Merge on www.verypdf.com to remove this watermark.
ptg
This page intentionally left blank
From the Library of STEPHEN EISEMAN
Please purchase PDF Split-Merge on www.verypdf.com to remove this watermark.