Photoluminescence emission of cu doped zns microstructures synthesized by thermal evaporation
Bạn đang xem bản rút gọn của tài liệu. Xem và tải ngay bản đầy đủ của tài liệu tại đây (574.31 KB, 7 trang )
VNU Journal of Science: Mathematics – Physics, Vol. 34, No. 2 (2018) 1-7
Photoluminescence Emission of Cu Doped ZnS
Microstructures Synthesized by Thermal Evaporation
Nguyen Van Nghia1,2,*, Nguyen Duy Hung1
1
Advanced Institute of Science and Technology (AIST),
Hanoi University of Science and Technology, (HUST), 01 Dai Co Viet, Hanoi, Vietnam
2
Thuy Loi University, 175 Tay Son, Dong Da, Hanoi, Vietnam
Received 10 August 2017
Revised 05 September 2017; Accepted 15 November 2017
Abstract: Cu doped ZnS microstructures were prepared by the thermal evaporation method using
ZnS powder and CuCl2.2H2O powder as precusor materials. The microstructures was characterized
by using X-ray diffraction (XRD) analysis. The XRD studies indicated that there are two phases
(ZnS and ZnO) at the undoped sample, but most of the samples are only having wurtzite
(hexagonal) phase of ZnS after doping. The photoluminescence emission and photoluminescence
excitation of ZnS and Cu2+ doped ZnS microstructures have been studied. The photoluminescence
excitation spectra of ZnS microstructures is presented around 374 nm. By doping of Cu2+ ion, the
absorption wavelength is shifted towards the lower wavelength being an evidence for an increasing
band gap. The emission spectrum of pure ZnS has a green emission band centred at around 520
nm. By doping Cu2+ ion, the peak of the green band in the luminescence spectra were transferred
to 516 nm and appeared a strong blue peak at 440 nm. The reasons of these will be discussed in
this paper.
Keywords: ZnS:Cu2+ microstructures, photoluminescence, thermal evaporation.
1. Introduction
Owning the largest band gap among II – VI semiconductor, zinc sulfide (ZnS), a direct transition
semiconductor, is a famous material with diverse luminescence properties [1,2], Especially in doping
the transition metals or rare earth elements [3–7]. Curently, it is used in many fields such as liquid
crystal displays, light emitting diodes (LEDs), cathode ray tube (CRT) equipments and flat panel
displays (FPDs) [8, 9].
_______
Corresponding author. Tel.: 84-984915472.
Email:
https//doi.org/ 10.25073/2588-1124/vnumap.4221
1
2
N.V. Nghia, N.D. Hung / VNU Journal of Science: Mathematics – Physics, Vol. 34, No. 2 (2018) 1-7
Recently, Mn-doped and Cu-doped ZnS structures have received much researchers’ attention
because the properties are closely related to the concentration of metal-doped [10–13]. The reason
is that these metals can change the energy band and form luminescence centrals with different
energy levels.
There are several approaches that have been conducted for the synthesis of pure ZnS and Cudoped ZnS and controlled their morphology as soon as luminescence properties. In 2008, Datta et al
have prepared Cu-doped ZnS nanorods by sovolthermal process. They exhibited that the wurtzite ZnS
nanorods gradually phase transformed to cubic structure and photoluminescence intensities of UV and
near IR bands changed with increasing the dopant concentration [14]. In 2012, Manuspiya et al have
synthesized ZnS and metal (Mn, Cu)-doped-ZnS via wet chemical [15]. They found that ZnS, Mndoped-ZnS and Cu-doped-ZnS generated blue, yellow and green color, respectively. Recently, in
2016, Shang et al also found that the optical emissions of ZnS nanostructures can be selectively
modified through the control of Cu ion dose and subsequent heat treatment [16]. An increase of Cu
dopant content will lead to an apparent red-shift of the intrinsic band-gap emission in the UV range
and the broadening of defect-related emission in visible range.
In this research work, we present the synthesis of ZnS and Cu-doped ZnS microbelts by a thermal
evaporation method. There are two peaks in the PL spectra at around 440 nm (blue) and 518 nm
(green) at the same time when ZnS is doped by Cu with the rate of 10%mol. Different from ref. [14],
phase of Cu-doped ZnS structures is wurtzite. The crystal structure, optical and surface morphological
properties are all studied in detail.
2. Experiment
The Cu2+ doped ZnS microstructures were synthesized on Si/SiO2 substrates by thermal vapor
deposition in a conventional horizontal quartz tube furnace. A mixing of high-purity ZnS and
CuCl2.2H2O powders as the precursor materials were placed into an alumina boat and positioned at the
center zone of the horizontal tube furnace. The ratio of CuCl2.4H2O and ZnS powder is weighed with
0, 10, 50 and 100 mol%. Si/SiO2 substrates with size of 0.5 x 0.5 cm were placed in the low
temperature zone at about 15 cm downstream from the aluminum boat. A haft of the quartz tube
containing the aluminum boat and Si/SiO2 substrates was setup outside the tube furnace until the
furnace was heated to deposition temperature. The quartz tube was pumped down to pressure of
1×10⁻³ Torr and heated to 600 oC, then the high-purity argon was introduced into the tube and the
mechanical rotary pump was turn off. The flow rates of Ar were controlled by a mass flow meter at
120 sccm. The temperature of the furnace was raised continually to growth temperature at a ramping
rate of 10 oC/min. The deposition temperature was set up at 1100 oC. When temperature of the furnace
increased to deposition temperature, the part of quartz tube containing the aluminum boat and Si/SiO2
substrates was pushed into the furnace to grow microbelts. During synthesis the furnace temperature
was maintained at growth temperature for 30 min, after that the furnace was allowed to cool naturally
to room temperature.
The morphology was examined by a field emission scanning electron microscopy (FESEM, JSM7600F, Jeol). The composition was determined by the energy dispersive x-ray spectroscopy (EDX,
Oxford Instruments X-Max 50) attached to the FESEM. The phase structure, crystallinity and
preferred orientation of as-synthesized microstructures were characterized by an X-ray diffraction
(XRD) (X-ray Siemens D5000) using Cu Kα radiation (λ=1.5406 Å) operated at 40 mA tube current.
The XRD patterns were collected in the range of 20 ° ≤ 2θ ≤ 70 ° with a step of 0.05 and collection
time for each data point was set at 4 seconds. The photoluminescence spectra (PL) and
N.V. Nghia, N.D. Hung / VNU Journal of Science: Mathematics – Physics, Vol. 34, No. 2 (2018) 1-7
3
photoluminescence excitation spectra (PLE) were recorded on Horiba Jobin–Yvon Nano-Log
spectrometers using a Xenon lamp (450 W) as an excitation source.
3. Results and discussion
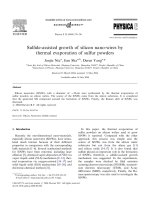
Figure 1. FESEM images and EDS of ZnS microstructures rate of Cu and ZnS is 0 mol% (a,b), 10 mol% (c,d),
50 mol% (e,f) and 100 mol% (g,h).
4
N.V. Nghia, N.D. Hung / VNU Journal of Science: Mathematics – Physics, Vol. 34, No. 2 (2018) 1-7
To study the morphology of the structures, FESEM were employed. Fig. 1 shows a series of
FESEM images of the structures grown on Si/SiO2 substrates. A typical FESEM image shows that
undoped ZnS microbelts is high density with several microns to about ten microns in widths and
several tens to more than one hundred of microns in lengths (Fig. 1a). These microbelts are quite
smooth, and their orientations are random. Making clusters and structures as microsheets is the trend
that can be seen clearly for Cu-doped ZnS with 10%mol. When ZnS is doped with Cu at 50%mol, the
microsheets become larger than the undoped microbelts and the density of them is low. However, for
Cu-doped ZnS with 100%mol, all of the material turned into cluster and no microbelts or microsheets
were seen. The corresponding EDS spectra reveal that the undoped microbelts mainly contain Zn, S
and O elements and the atom ratio of undoped ZnS is 53.0, 44.8 and 3.3 at%. The origin of O atom
may come from reaction between ZnS and O2 existing in furnace tube which was not pumped to low
enough pressure or origin from ZnS powder (precusor material). By doping Cu2+ with 10%mol, the Cl
and Cu components appear with atom ratio of 6.1 and 1.2%, respectively. At 50%mol of Cu content,
the atom ratio of Cu in the microsheets go up to 1.6%. However, the Cu component increases rapidly
to 40.8%, and the Si component appears with atom ratio of 3.0% at the doping content of 100%mol.
The Cl composition maybe come from CuCl2.2H2O precursor, while Si composition is attributed to
Si/SiO2 substrate due to thin material located in it.
XRD measurement was performed in order to determine the crystalline phase of the
microstructures. It is clear from Figure 2 that all of microstructures doped or undoped Cu are matched
to the structure of wurtzite (JCPDS 05-0492). In detail, the XRD pattern of the microbelts without
doping shows a peak at 27.87o corresponding to (111) plane of cubic phase (JCPDS card no. 05-0566)
while all of other peaks are wurtzite phase of ZnS. When the precursor material is mixed with 10
mol% of Cu, the peak of cubic phase disappears and the intensity of all peaks corresponding to wurzite
phase increases. However, when the concentration of Cu goes up to 40 mol%, the intensity of all peaks
decreases and becomes very weak at 100 mol%. This proves that crystal quality of ZnS is changed
through doping with Cu2+ ions.
Figure 2. XRD pattern of Cu doped ZnS microstructures grown on Si/SiO2 substrates.
N.V. Nghia, N.D. Hung / VNU Journal of Science: Mathematics – Physics, Vol. 34, No. 2 (2018) 1-7
5
In order to investigate the optical properties of the samples, the PL spectra of ZnS and ZnS:Cu2+
microstructures were measured at room temperature using a 280-nm excitation wavelength (Figure 3).
For the undoped sample, PL spectrum shows a emission band in visible region at around 520 nm. The
study groups of Zhang and Changxin Guo have reported that the green emission at 520 nm from ZnS
nanowires and nanobelts originates from Au impurity [17]. In 2016, the other group found that the
emergence of the green emission is directly related to the formation of the ZnO layer and the imperfect
surface/interface between the newly formed ZnO and the ZnS backbone [18]. In our situation, from
EDS analysic and XRD pattern, no phase relative Au was seen from the microbelts, so this green peak
may come from radiative centers of ZnS and ZnO [13, 19, 20]. The ZnS:Cu microsheets show more
peaks, at 440 nm and 518 nm for 10 mol% being different from undoped sample. At higher content of
Cu with 50 mol%, there are only one blue peak at around 443 nm with very high intensity. However,
at the sample doped with 100%mol of Cu, the intensity of blue emission band went down significantly
and there are two new peaks at 346 nm and 510 nm beside a blue peak at 440 nm. From the PL spectra
and Refs [21–23], the blue emission bands are attributed to the surface defects such as sulfur vacancy
or sulfur interstitial lattice defects. Meanwhile, the green emissions may be assigned to the surface
defects such as oxygen vacancies [13].
Figure 3. PL spectra of undoped and Cu2+ doped ZnS microstructures.
In order to further investigation about the effect of Cu on the radiative centers of ZnS microbelts,
the PLE spectra of the products which monitored at the emission wavelength of 440 nm are shown in
Fig. 4. At undoped sample, the spectra show that the microbelts are absorbed strongly at around 374
nm which are corresponded with the bandgap of ZnS, ZnO or ZnOS [24]. When the contents of Cu are
10% and 50% mol, the absorption edge transfers to short wavelength at around 362 nm and 359 nm,
respectively. At the same time, there are some very strong peaks at around 332 nm and 340 nm
corresponding to the fundamental absorption of ZnS [25]. The absorption related to the band to band
transition of ZnO or ZnOS reduces from 374 nm to 359 nm when the content of Cu2+ increases. This
result shows that the emission of the radiative centers of ZnS microstructures are modified by Cu 2+
6
N.V. Nghia, N.D. Hung / VNU Journal of Science: Mathematics – Physics, Vol. 34, No. 2 (2018) 1-7
ions and the emission at blue emission is originated from defects of Zn and S in the ZnS crystal.
However, at content of Cu is 100%mol, the absorption peak comes back at around 369 nm. The reason
may be that at very high content, Cu2+ ions have a trend making clusters, so the emission centers return
to ZnS host.
Figure 4. PLE spectra of undoped and Cu2+ doped ZnS microstructures.
4. Conclusion
The undoped and Cu doped ZnS microstructures on Si/SiO2 substrates have been successfully
synthesized by a thermal evaporation method. The undoped ZnS microbelts shows a broad band
emission at visible region at around 520 nm which related to radiative centers of ZnS and ZnO. By
doping Cu with various concentration, the emission band of radiative centers related to S and O in the
ZnS microbelts separated into blue and green emission, respectively. The green emission band
dominates as the doped Cu concentration is high enough and then to be quenched at the doping of
100%mol. Thus, the emission of radiative centers of ZnS can be controlled by Cu concentration doped
into ZnS microstructures.
References
[1] H. Hiramatsu, H. Ohta, M. Hirano, and H. Hosono, Heteroepitaxial growth of single-phase zinc blende ZnS films
on transparent substrates by pulsed laser deposition under H2S atmosphere, Solid State Commun., 124 (2002)
411.
[2] K. Ichino, K. Ueyama, H. Kariya, N. Suzuki, M. Kitagawa, and H. Kobayashi, Photoluminescence study of ZnS /
ZnMgS single quantum wells, Appl. Phys. Lett., 74 (1999) 3486.
[3] W. Jian, J. Zhuang, W. Yang, and Y. Bai, Improved photoluminescence of ZnS:Mn nanocrystals by microwave
assisted growth of ZnS shell, J. Lumin., 126 (2007) 735.
N.V. Nghia, N.D. Hung / VNU Journal of Science: Mathematics – Physics, Vol. 34, No. 2 (2018) 1-7
7
[4] W. Q. Peng, G. W. Cong, S. C. Qu, and Z. G. Wang, Synthesis and photoluminescence of ZnS:Cu nanoparticles,
Opt. Mater. (Amst)., 29 (2006) 313.
[5] L. Wanjari, D. P. Bisen, N. Brahme, I. Prasad Sahu, and R. Sharma, Effect of capping agent concentration on
thermoluminescence and photoluminescence of copper-doped zinc sulfide nanoparticles, Luminescence, 30
(2015) 655.
[6] R. K. Tamrakar, UV-irradiated thermoluminescence studies of bulk CdS with trap parameter, Res. Chem.
Intermed., 41 (2015) 43.
[7] D. Li, B. L. Clark, D. A. Keszler, P. Keir, and J. F. Wager, Color control in sulfide phosphors: Turning up the
light for electroluminescent displays, Chem. Mater., 12 (2000) 268.
[8] J. Bang, B. Abrams, B. Wagner, and P. H. Holloway, Effects of coatings on temporal cathodoluminescence
quenching in ZnS:Ag,Cl phosphors, J. Appl. Phys., 95 (2004) 7873.
[9] P. D. Rack and P. H. Holloway, The structure, device physics, and material properties of thin film
electroluminescent displays, Mater. Sci. Eng. R Reports, 21 (1998) 171.
[10] L. Luo, H. Chen, L. Zhang, K. Xu, and Y. Lv, A cataluminescence gas sensor for carbon tetrachloride based on
nanosized ZnS, Anal. Chim. Acta, 635 (2009) 183.
[11] B. Dong, L. Cao, G. Su, W. Liu, H. Qu, and D. Jiang, Synthesis and characterization of the water-soluble silicacoated ZnS:Mn nanoparticles as fluorescent sensor for Cu2+ ions, J. Colloid Interface Sci., 339 (2009) 78.
[12] N. Üzar, S. Okur, and M. Ç. Arikan, Investigation of humidity sensing properties of ZnS nanowires synthesized
by vapor liquid solid (VLS) technique, Sensors Actuators, A Phys., 167 (2011) 188.
[13] H. Tang, B. J. Kwon, J. Kim, and J. Y. Park, Growth modes of ZnS nanostructures on the different substrates, J.
Phys. Chem. C, 114 (2010) 21366.
[14] A. Datta, S. K. Panda, and S. Chaudhuri, Phase transformation and optical properties of Cu-doped ZnS nanorods,
J. Solid State Chem., 181 (2008) 2332.
[15] S. Ummartyotin, N. Bunnak, J. Juntaro, M. Sain, and H. Manuspiya, Synthesis and luminescence properties of
ZnS and metal (Mn, Cu)-doped-ZnS ceramic powder, Solid State Sci., 14 (2012) 299.
[16] L. Y. Shang, D. Zhang, and B. Y. Liu, Influence of Cu ion implantation on the microstructure and
cathodoluminescence of ZnS nanostructures, Phys. E Low-Dimensional Syst. Nanostructures, 81 (2016) 315.
[17] J. Hu, G. Wang, C. Guo, D. Li, L. Zhang, and J. Zhao, Au-catalyst growth and photoluminescence of zinc-blende
and wurtzite ZnS nanobelts via chemical vapor deposition, J. Lumin., 122–123 (2007) 172.
[18] D. Q. Trung, N. Tu, N. D. Hung, and P. T. Huy, Probing the origin of green emission in 1D ZnS nanostructures,
J. Lumin., 169 (2016) 165.
[19] T. Mitsui, N. Yamamoto, T. Tadokoro, and S. Ohta, Cathodoluminescence image of defects and luminescence
centers in ZnS/GaAs (100), J. Appl. Phys., 80 (1996) 6972.
[20] G. H. Yue et al., Hydrothermal synthesis of single-crystal ZnS nanowires, Appl. Phys. A Mater. Sci. Process., 84
(2006) 409.
[21] S. Wageh, Z. S. Ling, and X. Xu-Rong, Growth and optical properties of colloidal ZnS nanoparticles, J. Cryst.
Growth, 255 (2003) 332.
[22] A. Goudarzi et al., Low-Temperature Growth of Nanocrystalline Mn-Doped ZnS Thin Films Prepared by
Chemical Bath Deposition and Optical Properties, Chem. Mater., 21 (2009) 2375.
[23] W. W. G. Becker and A. A. J. Bard, Photoluminescence and photoinduced oxygen adsorption of colloidal zinc
sulfide dispersions, J. Phys. Chem., 78712 (1983) 4888.
[24] N. Xuan, Fabrication and Photoluminescence Properties of ZnS Nanoribbons and Nanowires, 52 (2008) 1530.
[25] Y. Y. Bacherikov et al., Structural and optical properties of ZnS:Mn micro-powders, synthesized from the charge
with a different Zn/S ratio, J. Mater. Sci. Mater. Electron., 28 (2017) 8569.