Giải pháp tăng cường công tác quản trị nguồn nhân lực tại công ty cổ phần nam việt thái nguyên
Bạn đang xem bản rút gọn của tài liệu. Xem và tải ngay bản đầy đủ của tài liệu tại đây (5.16 MB, 184 trang )
HEAVY METAL POLLUTION OF WATER AND SEDIMENTS IN
THE RIVERS OF HANOI, VIETNAM, AND ITS EFFECTS ON
THE QUALITY OF AGRICULTURAL SOIL AND CROPS
Nguyen Thi Lan Huong
2008
HEAVY METAL POLLUTION OF WATER AND SEDIMENTS IN
THE RIVERS OF HANOI, VIETNAM, AND ITS EFFECTS ON
THE QUALITY OF AGRICULTURAL SOIL AND CROPS
By
Nguyen Thi Lan Huong
A dissertation submitted in partial fulfillment of
the requirements for the degree of
Doctor of Philosophy
Department of Bioproduction and Environmental Sciences
Kyushu University
Fukuoka, Japan
2008
ii
Acknowledgements
First of all, I am extremely grateful to my advisor Prof. Masami Ohtsubo for
accepting me as his PhD student and his patience, guidance and support during my
study.
I am deeply thankful to thanks Associate Prof. Loretta Li (University of British
Columbia, Canada) for her counsel and many valuable suggestions towards
accomplishing this dissertation.
I would also like to Associate Prof. Shin-Ichiro Wada and Associate Prof.
Takahiro Higashi (Kyushu University, Japan) for their many helpful comments
towards the writing of this thesis.
I also wish to express my gratitude to Dr Motohei Kanayama and Ms. Akiko
Nakano for their assistance with ordering supplies and helping me in the laboratory
procedures.
I am very grateful to Ministry of education, culture, sports, science and
technology, Government of Japan for providing the scholarship for this study.
At last but above all, I am greatly indebted to my parents, husband, son and
friends for their love, encouragement, and endless support.
i
TABLE OF CONTENTS
ABSTRACT ..................................................................................................................... X
LIST OF FIGURES ........................................................................................................ V
LIST OF TABLES ....................................................................................................... VII
CHAPTER 1
INTRODUCTION ............................................................................................................ 1
1.1 STATEMENT OF THE PROBLEM....................................................................... 1
1.2 SCOPE OF OBJECTIVES ...................................................................................... 8
1.3 RESEARCH CONTRIBUTIONS ........................................................................... 9
1.4 ORGANIZATION OF THESIS .............................................................................. 9
1.5 REFERENCES ....................................................................................................... 10
CHAPTER 2
ASSESSMENT OF WATER QUALITY AND ITS SUITABILITY FOR THE TO
LICH AND KIM NGUU RIVERS IN HANOI CITY .............................................. 14
2.1 INTRODUCTION ................................................................................................. 15
2.2 METHODOLOGY................................................................................................. 16
2.2.1 Materials ......................................................................................................... 16
2.2.2. Methods .......................................................................................................... 17
2.3 RESULTS AND DISCUSSION ............................................................................ 17
2.3.1 Chemical properties of water ........................................................................ 17
2.3.2. Heavy metal pollution assessment................................................................ 19
2.3.3. Suitability for Irrigation Water..................................................................... 23
2.4 CONCLUSIONS AND RECOMMENDATION ................................................. 24
2. 5 REFERENCES ...................................................................................................... 25
CHAPTER 3
HEAVY METAL CONTAMINATION OF RIVER SEDIMENTS IN
HANOI, VIETNAM ....................................................................................................... 27
3.1 INTRODUCTION ............................................................................................... 29
3.2 MATERIALS AND METHODS .......................................................................... 31
3.2.1 Materials and Field Sampling ....................................................................... 31
3.2.2 Methodology ................................................................................................... 31
3.2.2.1 Chemical and Physical Properties of Sediment .................................... 31
3.2.2.2 Semi-quantitative estimates of mineralogical composition .................. 32
3.2.2.3 Total heavy metal concentration ............................................................ 34
3.2.2.4 Selective Sequential Extraction .............................................................. 35
3.2.2.5 Batch leaching test .................................................................................. 36
3.3 RESULTS AND DISCUSSION ............................................................................ 37
3.3.1 Sediment Quality............................................................................................. 37
3.3.2 Mineral Identification .................................................................................... 37
3.3.3 Clay Mineralogical Characterization ........................................................... 39
3.3.4 Impact of Industrial Activities on the Quality of Sediment .......................... 40
3.3.5 Correlation between Organic Matter and Heavy Metal Concentration in Sediment
................................................................................................................................... 42
ii
3.3.5 Distribution of Heavy Metal in Sediment Fractions .................................... 44
3.3.6 Leachibility and Mobility of Heavy Metals in the Sediments ...................... 48
3.4 CONCLUSIONS AND RECOMMENDATION ................................................. 55
3.5 REFERENCES ....................................................................................................... 56
CHAPTER 4
IMPACT OF RIVER POLLUTION ON AGRICULTURAL SOILS AND
VEGETABLES IN A SUBURBAN AREA OF HANOI, VIETNAM........................... 60
4.1 INTRODUCTION ................................................................................................. 62
4.2 MATERIALS AND METHODS .......................................................................... 64
4.2.1 Irrigation Water, Sampling Site and Soil Samples ....................................... 64
4.2.2 Methods ........................................................................................................... 66
4.2.2.1 Chemical and Physical Properties of Agricultural Soils ...................... 66
4.2.2.2 Heavy Metal Concentration.................................................................... 66
4.2.2.4 Absorption Isotherm................................................................................ 66
4.2.2.5 Batch Leaching Test ................................................................................ 67
4.3 RESULTS AND DISCUSSION ............................................................................ 68
4.3.1 Properties of Agricultural Soil ...................................................................... 68
4.3.2 Heavy Metal Concentration of Soil ............................................................... 70
4.3.3 Mobility of Heavy Metal ................................................................................ 71
4.3.4 Adsorption Isotherm ....................................................................................... 75
4.3.5 Leaching Heavy Metals from Contaminated Soils ....................................... 82
4.3.6 Fractionated Heavy Metals and Potential Leachability .............................. 85
4.3.7 Heavy Metal Concentration in Vegetable ..................................................... 87
4.3.8 Soil Plant Transfer Coefficients .................................................................... 89
4.4 CONCLUSIONS .................................................................................................... 91
4.5 REFERENCES ....................................................................................................... 93
CHAPTER 5
HEAVY METAL CONTAMINATION OF SOIL AND RICE IN
WASTEWATER-IRRIGATED PADDY FIELD IN A SUBURBAN AREA OF
HANOI VIETNAM ........................................................................................................ 97
5. 1 INTRODUCTION................................................................................................. 99
5. 2 MATERIALS AND METHODS ....................................................................... 101
5.2.1 Materials and Sampling Site ........................................................................ 101
5.2.2. Methodology ................................................................................................ 101
5.2.2.1 Chemical and Physical Properties of Soil ........................................... 101
5.2.2.2 Determination of Total Metal Concentration ...................................... 102
5.2.2.3. Selective Sequential Extraction (SSE) of Heavy Metals .................... 102
5.2.2.4. Absorption Isotherm............................................................................. 102
5.2.2.5 Leaching Test......................................................................................... 102
5.3. RESULTS AND DISCUSSION......................................................................... 103
5.3.1 Properties of the Paddy Soil ........................................................................ 103
5.3.2 Heavy Metal Concentration in the Soil ....................................................... 105
5.3.3 Heavy Metal Association with Soil Fractions ............................................ 108
5.3.4 Heavy Metal Adsorption Capacity of Paddy Soils ..................................... 111
5.3.5 Potential Leachability of Heavy Metals ...................................................... 117
5.3.6 Fractionated Heavy Metals and Potential Leachability ............................ 120
5.4 CONCLUSIONS .................................................................................................. 127
iii
5.5 REFERENCES ..................................................................................................... 128
CHAPTER 6
CONCLUSIONS AND RECOMMENDATIONS ................................................... 133
6.1 CONCLUSIONS .................................................................................................. 133
6.2 RECOMMENDATIONS FOR THE FUTURE WORK .................................... 136
APPENDIX.................................................................................................................... 138
iv
LIST OF FIGURES
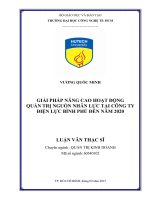
Figure 1.1 Study area....................................................................................................................................................7
Figure 2.1 Location of sampling sites and factories ..........................................................................................16
Figure 2.2 Relationship between total and water-soluble concentration and metal retained in
suspended solid ...................................................................................................................................20
Figure 3.2. The XRD patterns of the <2µm clay fraction of SD10, representing sediment
sample of the To Lich and Kim Nguu Rivers in Hanoi. Spacing is in nm.
Treatments: a, Mg-saturation and glycerol-solvation; b, Mg-saturation and airdrying; c, K-saturation and air-drying; d, K-saturation and heating at 5000C...................39
Figure 3.3. Correlation between organic matter content and total heavy metal concentration
organic fraction concentration ........................................................................................................43
Figure 3.4 Heavy metal extracted via SSE from sediment samples ..........................................................46
Figure 3.5 Average percentage of the respective heavy metal concentrations for each fraction
of the sediments at all sampling sites, the variation of metal concentration due to
the sampling sites is also indicated ................................................................................................47
Figure 3.6 Changes in the concentration of leached heavy metals by repeated washings with
de-ionized water and the solutions of
nitric acid, acetic acid and EDTA.......................................................................................................49
Figure 3.7 Correlation between leached metal concentration and total metal concentration for
the sediment samples subjected to leaching with water, acid and EDTA .........................51
Figure 3.8 Average of the ratio of leached metal concentration to total metal concentration for
the sediment samples subjected to leaching with water, acid and EDTA.
Variation in the ratio from average is also indicated for the respective metal types
and leaching solutions .......................................................................................................................51
Figure 3. 9 Relationship between metal concentration of fraction and leached metal
concentration of using different leaching solutions of sediment samples ..........................53
Figure 3.10 Correlation between organic matter content and the ratio of leached metal
concentration to total metal concentration for the sediment samples subjected to
leaching with different types of solution......................................................................................54
Figure 4. 2 Heavy metal extracted via SSE from soil samples ......................................................................73
Figure 4.3 Average percentage of the respective heavy metal concentrations for each fraction
of the soil samples, the variation of metal concentration due to the sampling sites
is also indicated ...................................................................................................................................74
Figure 4.4 (a) Characteristics of Cd, Cr and Cu adsorption of Agricultural soil .......................................76
Figure 4.4 (b) Characteristics of Ni. Pb and Zn adsorption of Agricultural soil........................................77
Figure 4.5 (a) Freundlich and Langmuir adsorption isotherm models ........................................................80
for Cd, Cr and Ni of agricultural soil. .................................................................................................80
Figure 4.5 (b) Freundlich and Langmuir adsorption isotherm models.......................................................81
for Ni, Pb and Zn of agricultural soil ...................................................................................................81
v
Figure 4.6 Changes in the concentration of leached heavy metals by repeated washings with
de-ionized water and the solutions of nitric acid, acetic acid and EDTA...........................83
Figure 4.7 Correlation between leached metal concentration and total metal concentration for
the soil samples subjected to leaching with water, acid and EDTA....................................84
Figure 4.8 Average of the ratio of leached metal concentration to total metal concentration for
the soil samples subjected to leaching with water, acid and EDTA....................................84
Figure 4.9 Comparison of leached metal concentration for different treatments with
sequentially fractionated heavy metal concentration in soil samples. .................................86
Figure 4.10 Correlation between total heavy metal concentrations in the soils and vegetables ...........90
Figure 5.1 Location of soil and rice grain sampling....................................................................................... 102
Figure 5.2 XRD patterns for the < 2µm clay fractions of the soil sample (S8). Spacing is in
nm; Treatments a: Mg-saturation and glycerol – solvation, b: Mg-saturation and
air-drying, c: K-saturation and air-drying, d: K-saturation and heating at 500oC. ....... 106
Figure 5.3 The metal concentration of soil samples following by distances from the road................ 106
Figure 5.4 Heavy metal extracted via SSE from soil samples. ................................................................... 109
Figure 5.5 Average percentage of the respective heavy metal concentrations for each fraction
of the soil samples, the variation of metal concentration due to the sampling sites
is also indicated ................................................................................................................................ 110
Figure 5.6 (a) Characteristics of Cd, Cr and Cu adsorption of paddy soil ............................................... 113
Figure 5.6 (b) Characteristics of Ni, Pb and Zn adsorption of paddy soil ................................................ 114
Figure 5.7(a) Freundlich and Langmuir adsorption isotherm models ...................................................... 115
for Cd, Cr and Cu of paddy soil ...................................................................................................... 115
Figure 5.7(b) Freundlich and Langmuir adsorption isotherm models...................................................... 116
for Ni, Pb and Zn of paddy soil....................................................................................................... 116
Figure 5.8 Changes in the concentration of leached heavy metals by repeated washings with
de-ionized water and the solutions of nitric acid, acetic acid and EDTA........................ 118
Figure 5.9 Correlation between leached metal concentration and total metal concentration for
the soil samples subjected to leaching with water, acid and EDTA................................. 119
Figure 5.10
The average of the ratio of leached metal concentration to total metal
concentration for soil samples subjected to leaching with water, acid and EDTA ...... 119
Figure 5.11 Comparison of leached metal concentration for different treatments with
sequentially fractionated heavy metal concentration in soil samples ............................... 121
Figure 5.12 Comparing between heavy metals leaching capacity by different solutions of
sediment and soils ........................................................................................................................... 124
Figure 5.13 Comparing between leaching capacity of heavy metals of different solutions of
sediment and soils ........................................................................................................................... 125
Figure 5.14 Correlation between heavy metal concentration in soil and rice grain .............................. 126
vi
LIST OF TABLES
Table 2.1 Chemical properties in the water of the To Lich and Kim Nguu Rivers .................................18
Table 2.2 Correlation coefficient between chemical properties of water....................................................18
Table 2.3 Heavy metal concentration in water from the To Lich and Kim Nguu Rivers .....................20
Table 2.4 Heavy metal concentration in suspended solid (g/kg)...................................................................22
Table 2.5 Information on the industry in the areas of the water sampling sites and the total
heavy metal concentrations of water ............................................................................................23
Table 3.1 Sediment sample location and relationship between the types of industry and metal
concentration in the sediment .........................................................................................................33
Table 3. 2 Chemical and physical properties of sediment samples ..............................................................38
Table 3.3 Mineral contents (%) in the <2 µm clay fraction of sediment samples....................................40
Table 4.1 Chemical and physical properties of soil samples taken at different from the canal ............69
Table 4.2 Mineral contents (%) in the <2 mm clay fraction of soil samples .............................................70
Table 4.3 Total heavy metal concentration of soil samples (mg/kg)............................................................71
Table 4.4 Distribution coefficient Kd (ml/g) for agricultural soil..................................................................78
Table 4.5 Total heavy metal concentration in vegetable (mg/kg) .................................................................88
Table 4.6 The range of transfer coefficients of metals and their suggested coefficient range...............88
Table 5.1 Chemical and physical properties of soil samples ....................................................................... 104
Table 5.2 Relative mineral contents in the <2µm clay fractions ............................................................... 104
Table 5.3 Total heavy metal concentration in soil samples.......................................................................... 107
Table 5.4 Distribution coefficient Kd (ml/g) for soil...................................................................................... 112
Table 5. 5 Total heavy metal concentration of rice grain (mg kg-1) and transfer coefficient ............ 126
Appendix
Table 1. Concentration of sequentially fractionated Cd of Sediments (mg kg-1)................................... 138
Table 2. Concentration of sequentially fractionated Cr of Sediments (mg kg-1).................................... 138
Table 3. Concentration of sequentially fractionated Cu of Sediments (mg kg-1).................................. 138
Table 4. Concentration of sequentially fractionated Ni of Sediments (mg kg-1)................................... 139
Table 5. Concentration of sequentially fractionated Pb of Sediments (mg kg-1) .................................. 139
Table 6. Concentration of sequentially fractionated Zn of Sediments (mg kg-1) ................................... 139
Table 7. Concentration of sequentially fractionated Cd of Agricultural soil (mg kg-1) ........................ 140
Table 8. Concentration of sequentially fractionated Cr of Agricultural soil (mg kg-1)........................ 140
Table 9. Concentration of sequentially fractionated Cu of Agricultural soil (mg kg-1) ........................ 140
Table 10. Concentration of sequentially fractionated Ni of Agricultural soil (mg kg-1) ...................... 141
Table 11. Concentration of sequentially fractionated Pb of Agricultural soil (mg kg-1) ..................... 141
vii
Table 12. Concentration of sequentially fractionated Zn of Agricultural soil (mg kg-1)..................... 141
Table 13. Concentration of sequentially fractionated Cd of Paddy soil (mg kg-1) ................................ 142
Table 14. Concentration of sequentially fractionated Cr of Paddy soil (mg kg-1) ................................. 142
Table 15. Concentration of sequentially fractionated Cu of Paddy soil (mg kg-1) ................................ 142
Table 16. Concentration of sequentially fractionated Ni of Paddy soil (mg kg-1) ................................. 143
Table 17. Concentration of sequentially fractionated Pb of Paddy soil (mg kg-1) ................................. 143
Table 18. Concentration of sequentially fractionated Zn of Paddy soil (mg kg-1)................................ 143
Table 19. Adoption Isotherm of Cd of Sediment ........................................................................................... 144
Table 20. Adoption Isotherm of Cr of Sediment ............................................................................................ 145
Table 21. Adoption Isotherm of Cu of Sediment ........................................................................................... 146
Table 22. Adoption Isotherm of Ni of Sediment ............................................................................................ 147
Table 23. Adoption Isotherm of Pb of Sediment ............................................................................................ 148
Table 24. Adoption Isotherm of Zn of Sediment............................................................................................ 149
Table 25. Adoption Isotherm of Cd of Agricultural soil............................................................................... 150
Table 26. Adoption Isotherm of Cr of Agricultural soil................................................................................ 150
Table 27. Adoption Isotherm of Cu of Agricultural soil............................................................................... 151
Table 28. Adoption Isotherm of Ni of Agricultural soil................................................................................ 151
Table 29. Adoption Isotherm of Pb of Agricultural soil ............................................................................... 152
Table 30. Adoption Isotherm of Zn of Agricultural soil ............................................................................... 152
Table 31. Adoption Isotherm of Cd of Paddy soil.......................................................................................... 153
Table 32. Adoption Isotherm of Cr of Paddy soil........................................................................................... 154
Table 33. Adoption Isotherm of Cu of Paddy soil.......................................................................................... 155
Table 34. Adoption Isotherm of Ni of Paddy soil........................................................................................... 156
Table 35. Adoption Isotherm of Pb of Paddy soil .......................................................................................... 157
Table 36. Adoption Isotherm of Zn of Paddy soil .......................................................................................... 158
Table 37. Leached concentration of Cd by different solutions of 5 times washing of Sediment
(mg kg-1)............................................................................................................................................. 159
Table 38. Leached concentration of Cr by different solutions of 5 times washing of Sediment
(mg kg-1)............................................................................................................................................. 159
Table 39. Leached concentration of Cu by different solutions of 5 times washing of Sediment
(mg kg-1)............................................................................................................................................. 160
Table 40. Leached concentration of Ni by different solutions of 5 times washing of Sediment
(mg kg-1)............................................................................................................................................. 160
Table 41. Leached concentration of Pb by different solutions of 5 times washing of Sediment
(mg kg-1)............................................................................................................................................. 161
Table 42. Leached concentration of Zn by different solutions of 5 times washing of Sediment
(mg kg-1)............................................................................................................................................. 161
viii
Table 43. Leached concentration of Cd by different solutions of 5 times washing of
Agricultural soil (mg kg-1)............................................................................................................. 162
Table 44. Leached concentration of Cr by different solutions of 5 times washing of
Agricultural soil (mg kg-1)............................................................................................................. 162
Table 45. Leached concentration of Cu by different solutions of 5 times washing of
Agricultural soil (mg kg-1)............................................................................................................. 163
Table 46. Leached concentration of Ni by different solutions of 5 times washing of
Agricultural soil (mg kg-1)............................................................................................................. 163
Table 47. Leached concentration of Pb by different solutions of 5 times washing of
Agricultural soil (mg kg-1)............................................................................................................. 164
Table 48. Leached concentration of Zn by different solutions of 5 times washing of
Agricultural soil (mg kg-1)............................................................................................................. 164
Table 49. Leached concentration of Cd by different solutions of 5 times washing of Paddy
soil (mg kg-1) ..................................................................................................................................... 165
Table 50. Leached concentration of Cr by different solutions of 5 times washing of Paddy soil
(mg kg-1)............................................................................................................................................. 165
Table 51. Leached concentration of Cu by different solutions of 5 times washing of Paddy
soil (mg kg-1) ..................................................................................................................................... 166
Table 52. Leached concentration of Ni by different solutions of 5 times washing of Paddy soil
(mg kg-1)............................................................................................................................................. 166
Table 53 Leached concentration of Pb by different solutions of 5 times washing of Paddy soil
(mg kg-1)............................................................................................................................................. 167
Table 54. Leached concentration of Zn by different solutions of 5 times washing of Paddy
soil (mg kg-1) ..................................................................................................................................... 167
ix
ABSTRACT
Heavy metal pollution is one of the most topical environmental problems. Many
communities have become increasingly aware of and concerned by heavy metal
pollution in relation to their everyday lives. Industrial, agricultural and domestic wastes
are continuously discharged heavy metals into water-bodies. Encouraging wastewater
reuse in agricultural has important economic and environmental benefits, such as
conserving water and utilizing nutrients. However, using untreated wastewater also
poses certain environmental and health risks, including environmental health risks to
users and consumers of products utilizing wastewater.
Hanoi has experienced rapid economical growth and urban expansion in the last
decades. Wastewater from households and industries are discharged into the To Lich
and Kim Nguu Rivers which today function mainly as the sewage and drainage systems
of Hanoi. In peri-urban areas of Hanoi, water from those rivers also serves as the source
of water and nutrients for food production in lakes, ponds and heavily irrigated fields.
However, inappropriate city planning and wastewater management for both industry
and household has caused various environmental problems including the heavy metal
pollution of surface water, sediments, soils and crops. This research work has
concentrated to evaluate heavy metal pollution of the water and sediment in the To Lich
and Kim Nguu Rivers and its effects on the quality of agricultural soil and crops in
Hanoi, Vietnam.
The To Lich and Kim Nguu Rivers, laden with untreated waste from industrial
sources, serves as a source of water for irrigating vegetable farm. In order to assess the
water quality of stream water in the To Lich and Kim Nguu Rivers and the suitability of
water quality for irrigation, the chemical properties and heavy metal concentrations of
the eight surface water samples were determined. The results showed that water from
x
the rivers was heavily polluted with organic matter and heavy metals such as Pb, Cu,
Zn, Cr, Cd and Ni. Dissolved oxygen, chemical oxygen demand, and total suspended
solids, and the concentrations of all heavy metals exceeded the Vietnamese standard for
surface water quality in all investigated sites. The concentrations of some heavy metals
such as Cu, Cd, Cr and Ni were over the internationally recommended WHO maximum
limits for irrigation water. A wide variation in heavy metal concentration of water due
to metal types is the result of wastewater discharged from different industrial sources.
In order to assess the heavy metal contamination in the To Lich and Kim Nguu
Rivers, twelve sediment samples from above river system were taken and analyzed the
chemical, physical, heavy metal concentration, selective sequential extraction and
leaching test. The present study shows that sediments in the To Lich and Kim Nguu
Rivers are heavily polluted with heavy metals (220 to 475 mg/kg for Cu, 260 to 665
mg/kg for Pb, 250 to 535 mg/kg for Zn, 2.5 to 40 mg/kg for Cd, 505 to 655 mg/kg for
Cr, and 48 to 165 mg/kg for Ni). Metal concentrations in sediments were indicated to
be closely related to the type of manufacturing plants located along the rivers. The
heavy metals were bound with sediment particles through phases such as exchangeable,
carbonate, oxide, organic matter and residual. The percentage of each phase was
different among metal types; the organic matter and the oxide were predominant for the
group of Cu, Pb and Ni and the group of Zn and Cd, respectively, and each phase was
almost equal for Cr. Total heavy metal concentration in the sediment was correlated
with organic matter content for Cu, Pb and Ni while no correlation was found for Cd,
Zn and Cr. The EDTA caused high heavy metal leachability compared to water, acetic
acid and nitric acid. Average potential leachability decreased in the order: Cd > Ni > Cr
> Cu = Zn > Pb. The leachability exhibited a tendency of decreasing with increasing
organic matter for heavy metals other than Cr and Zn.
xi
In order to identify the impact of waste-water irrigation on the level of
heavy metals in the agricultural soils and vegetables, and to predict their potential
mobility and bioavailability, eight soil samples were collected from the locations of
different distance from the canal at agricultural field in Tam Hiep, Thanh Tri, Hanoi.
The concentrations of all heavy metals in the study site was much higher than the
background level in that area, and exceeded the permissible level of the Vietnamese
standard for Cd, Cu, Ni, Pb and Zn. The concentrations of Zn, Ni and Pb in the surface
soil exhibited marked decreases with distance from the road. The results of selective
sequential extraction procedure indicated that dominant fractions were oxide, organic
and residual for Ni, Pb and Zn, organic and oxide for Cr, oxide for Cd, and organic for
Cu. The different heavy metals had different adsorption isotherms. The q (metal
sorption concentration) value was 121 times for Cd, 12 times for Cr, 22 times for Cu,
59 times for Ni, 26 times for Pb and 21 times for Zn concentration found on the site.
The absorption capacity of heavy metals in soil followed the order of Cu > Cr > Ni >
Pb > Zn > Cd. Leaching tests for water and acid indicated that the ratio of leached
metal concentration to total metal concentration in the soil decreased in the order: Cd >
Ni > Cr > Pb > Cu > Zn, and for the EDTA treatment was in the order: Cd > Ni > Cr >
Zn > Cu > Pb. The EDTA treatment gave higher leaching than other treatments. By
leaching with water and acid, all heavy metals were released fully from exchangeable
fraction, and some heavy metals were fully from carbonate and oxide fractions. The
concentrations of Cd, Cu, Ni, Pb and Zn in the vegetables exceeded the Vietnamese
standard. The transfer coefficient for the metals was in the order: Zn > Ni > Cu > Cd =
Cr > Pb.
The present study also deals with the heavy metal contamination of paddy soil
and rice grain subjected to the irrigation water polluted with wastes from various
xii
industrial plants in Hanoi. The retention and potential mobility of heavy metals were
assessed based on the contents of total and fractionated heavy metals in the soil and
their leachability. Heavy metal contents in rice grain were also determined. Eleven soil
samples were collected from the locations of different distance from the edge of road in
Hoang Liet, Thanh Tri, Hanoi. The concentrations of all heavy metals in the study site
was much higher than the background level in that area, and exceeded the permissible
level of the Vietnamese standard for Cd, Cu, Pb and Zn. The concentrations of Zn, Ni
and Pb in the surface soil exhibited marked decreases with distance from the road. The
results of selective sequential extraction procedure indicated that dominant fractions
were oxide, organic and residual for Cd, Ni, Pb and Zn, and organic and residual for Cr,
and organic for Cu. The different heavy metals had different adsorption isotherms. The
q (metal sorption concentration) value was 121 times for Cd, 12 times for Cr, 22 times
for Cu, 59 times for Ni, 26 times for Pb and 21 times for Zn concentration found on the
site. The absorption capacity of heavy metals in soil followed the order of Cu > Cr > Ni
> Pb > Zn > Cd. Leaching tests for water and acid indicated that the ratio of leached
metal concentration to total metal concentration in the soil decreased in the order: Cd >
Ni > Cr > Pb > Cu > Zn, and for the EDTA treatment was in the order: Cd > Ni > Cr >
Zn > Cu > Pb. The EDTA treatment gave higher leaching than other treatments. By
leaching with water and acid, all heavy metals were released fully from exchangeable
fraction, and some heavy metals were fully from carbonate and oxide fractions. The
concentrations of Cu, Ni, Zn in the rice grain met the WHO standard while those of Cr
and Pb exceeded the permissible level of the standard. The transfer coefficient for the
metals was in the order: Zn > Ni > Cu > Cd = Cr > Pb.
To reduce the pollutants discharged from plants, countermeasures by the
government and the technological improvement of wastewater treatment in
xiii
manufacturing processes are needed. In these cases, EDTA should be used to remove or
minimize heavy metals from contaminated sediments and soils.
Key words: Heavy metal, Water quality, Sediment, Agricultural soil, Vegetable,
Rice grain, Selective Sequent Fraction, Leachability, Industrial effluent.
xiv
CHAPTER 1
INTRODUCTION
1.1 STATEMENT OF THE PROBLEM
Heavy metal pollution is one of the most topical environmental problems.
Many communities have become increasingly aware of and concerned by heavy metal
pollution in relation to their everyday lives. Industrial, agricultural and domestic
wastes are continuously discharged heavy metals into water-bodies. Encouraging
wastewater reuse in agricultural has important economic and environmental benefits,
such as conserving water and utilizing nutrients. However, using untreated wastewater
also poses certain environmental and health risks, including environmental health
risks to users and consumers of products utilizing wastewater (Venditti et al., 2000).
Sediment is the result of deposition of solid material from the water. Under
certain hydrodynamic conditions, suspended solids settle along the bottom of
watercourses or lake to form sediment. Sediment may act as sources as well as sinks
for certain heavy metals, and have the capacity to accumulate heavy metals and other
contaminants over time (Rickert et al., 1977). Forstner and Muller (1981) showed that
sediments in coastal regions near industrial and urban areas are typically polluted by
heavy metals, which are usually present in amounts several times higher than their
natural background levels. The accumulation of heavy metals in the sediment is
mainly a result of biogenuos and lithogenuos formations. Contaminated sediments are
soils, sand, organic matter, or minerals that accumulate on the bottom of a water body
and contain toxic hazardous materials that may adversely affect human health by
being incorporated in to food chain (Klank et al., 2006)
1
Nguyen Thi Lan Huong
The associations of heavy metals with suspended solid and bed sediment, and
the dynamic nature of the stream environment, have generated interest in the past
three decades in determining the accumulation and concentrations of the key heavy
metals in sediments (Yousef et al., 1994). Most of the heavy metals are absorbed on
suspended particulate matter that can be transported into the sediment by flocculation
and sedimentation. Sediments are an integral but ambiguous part of water systems. At
the sediment-water
interface, particularly
with the oxide zone, enhanced
mineralization processes occur. These microbial catalyzed reactions may change both
the minerals on which heavy metals are bound and their speciation and therefore also
the mobility of the heavy metals (Mark et al., 1982). By providing the substrate for
organisms and interacting with the overlying water; sediments play an essential role to
the aquatic ecosystem and highly accumulate heavy metals concentrations (Rickert et
al., 1977; Klank et al., 2006).
Heavy metal pollution in soils has attracted an increasing attention around the
world in past decades. Soil may be contaminated by heavy metals from both natural
and anthropogenic sources. Sources of anthropogenic metal contamination in soils
include urban and industrial wastes; mining and smelting of non ferrous metals and
metallurgical industries (Bermond, 2001). Regulatory authorities’ emphasized aspects
of water quality, government agencies have recently given greater attention to soil,
recognizing its role as a repository of much pollution, as a transmitter of undesirable
materials to the groundwater and a supplier of contaminants to crops (Salemaa et al.,
2001). There is a growing concern that many soils in Japan and central Europe either
have become or will soon be overloaded with toxic metals at the current
anthropogenic input (Olive, 1997).
2
Nguyen Thi Lan Huong
Although heavy metals naturally occur in the earth’s crust, they tend to
accumulate in soil at toxic level because of irrigation application of sewage sludge
that contains heavy metal as well as contamination caused by industry, fast growing
populations and increasing urbanization, and often non-existent or ineffective
wastewater treatment facility (Bohn et al., 1985; Chen et al., 2007). Heavy metals are
highly persistent in soil with residence time in the order of thousands of years. The
main mechanisms by which heavy metals are retained in soil are adsorption including
ion exchange, precipitation, co-precipitation and organic biding (Nolan et al., 2005).
Once on the soil, heavy metals will undergo streaming over the soil and retention or
leaching through floor horizons. In this case, they may be more or less mobile and
then either become more soluble or carried by water into the soil. Excessive
accumulation of heavy metals can have deleterious effects on soil fertility, affect
ecosystem functions and constitute a health risk to animals and human beings (Mc
Grath, 1987).
Plants are importance component of ecosystems as they transfer heavy metals
from a biotic into biotic environments. In polluted areas, the effect of industrial
effluents on soils and the use of municipal and industrial wastewater for irrigation
crops are well documented, and also the transfer of toxic heavy metals from soils to
plants is of great concern (Chojnacka et al., 2005; Nolan et al., 2005). One important
dietary uptake pathway could be through plants irrigated with contaminated
wastewater. The primary sources of heavy metals from the environment to plants are:
air, water and the soil (Hamilton, 1995). Soils irrigated by wastewater accumulate
heavy metals in the surface soil. When the capacity of the soil to retain heavy metals
is reduced due to repeated use of wastewater, soil can release heavy metals into
ground water and soil solution available for plant uptake (Alloway, 1995).
3
Nguyen Thi Lan Huong
Many studies have shown that soil significantly affected the uptake of heavy
metals by many varieties of plants in different sites and the concentrations of heavy
metals in the plants were correlated with the total metal concentrations in the soils.
Furthermore, many physicochemical characteristics of soils such as pH, organic
matter content, and cation exchange capacity, can impact the heavy metal
accumulation and affect the availability of heavy metals for uptake by plants
(Mandaokar et al., 1994; Alloway, 1995). Moreover, the uptake and accumulation of
heavy metal by plants are dominantly dependent on the available rather total heavy
metal in the soil.
The consumption of polluted plants is one of the major pathways for heavy
metals entering the human bodies. It is known that serious systemic health problems can
develop as a result of excessive accumulation of dietary heavy metals in human body
(Olive, 1997). Heavy metals are extremely persistent in the environment; they are
nonbiodegradable and nonthermo-degradable and thus readily accumulated to toxic
levels (Brigden and Santillo, 2004). Heavy metals are harmful to human health because
of their toxicity. Cadmium (Cd) is highly toxic and accumulative, and kidney in human
and animals is targeted by cadmium toxicity. Other diseases include skeletal disorders
such as osteoporosis or osteomalacia (softening of the bones) as well as the
development of hypertension (high blood pressure) and heart disease (Brigden and
Santillo, 2004). Lead (Pb) is one of the most toxic elements naturally occurring on
Earth. High concentration of lead can cause irreversible brain damage, seizure and
coma, and death if not treated immediately. The kidney is also targeted by Lead toxicity
and impaired at moderate to high level of lead concentrations. Other signs/symptoms of
lead toxicity include gastrointestinal disturbances-abdominal pain cramps constipation
anorexia, weight loss-immunosuppression (Brigden and Santillo, 2004).
4
Nguyen Thi Lan Huong
Hanoi City, Vietnam, lies in the Red River Delta, borders the hilly provinces
of Vinh Phu and Bac Thai to the north, the provinces of Ha Bac and Hai Hung to the
east, and the province of Ha Tay to the south and the province of Ha Tay and Vinh
Phu to the west. The city of Hanoi is situated from longitude 20o25' to 21o2' north and
from latitude 105o15' to 106o03' east. It is situated in a tropical area having a strong
monsoon influence. Hanoi is endowed with all the four seasons: spring, summer,
autumn and winter. Climate in Hanoi can be divided into two distinct seasons: the dry
and the rainy seasons. The dry season starts from October to April. This is the period
characterized by spells of cold wind and drizzles. The rainy season starts in May and
ends in September, there are many torrential rains and fierce sunshine in this period.
Currently, Vietnam is going through a period of industrialization and
modernization and according to the economic development strategy up to 2020, and
Hanoi, as the capital city, is a central part of this development. During this period of
high economic growth, the process of transforming a rural economy into an
industrialized one will impose pressure on the exploitation of natural resources and
increase the amount of environmental hazards. It is well known that in low-income
countries with insufficient resources for investment in wastewater treatment and a
lack of capacity to enforce legislation, the farmers should use the untreated
wastewater for their agri- and aqua cultural production.
In Hanoi City, there are a great number of industries which could be the
source of pollution for the city’s atmospheric, aquatic and terrestrial: 274 enterprises
and factories, 540 service establishments, 450 production cooperation and 3,350
production establishments. Most of them are concentrated in Thuong-Dinh industrial
zone, and Van-Dien and Hai-Ba-Trung area (Marcussen et al., 2006), and some are
located in residential areas. Most manufacturers were established in the 1950s with
5
Nguyen Thi Lan Huong
assistance from China and the former Soviet Union. Their plants are old, and do not
equip with appropriate wastewater treatment facilities. Exhaust emissions from motor
vehicles are also a major source of pollutants. There are various environmental
regulations and standards in Vietnam, but the implementation of these is lacking
(Environmental Information Office, Hanoi, 2001).
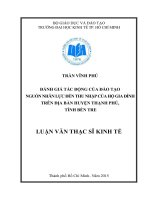
There are two rivers in Hanoi City (Fig. 1.1), the To-Lich and Kim-Nguu
Rivers. The To-Lich River with 17 km in length originating in West Lake flows
through Thuong-Dinh industrial zone to Van-Dien, joining to the Kim-Nguu River.
Industrial and non-industrial urban wastewater flowing into the To-Lich River
amounts to 290,000 m3/day, which accounts for two third of the wastewater produced
in the city (Marcussen et al., 2006). The industry that discharges the wastewater
includes 33 plants, and major ones are Gold-Star rubber, Thanh-Long cigarette,
Thanh-Long cigarette, Dai-Kim plastic, and a soap plant. The wastewater from these
plants is being discharged without any appropriate treatment. The irrigation water
from the To-Lich River covers 1,361 ha agricultural land in Yen-Hoa, Lang-Ha, and
Nhan-Chinh (Cau-Giay) communes, My-Dinh (Tu-Liem), Thanh-Liet (Thanh-Xuan)
and Dai-Kim (Thanh-Tri) communes.
The Kim-Nguu River with 11 km in length also flows through the densely
populated area of Hanoi City. The wastewater from the area of 6 km2 is flowing into
this river, which amounts 139,000 m3/day, being one third of the wastewater produced
in the city (Marcussen et al., 2006). The main industry that discharges wastewater is
March-8 textile, Mai-Dong mechanical engineering and Hanoi-Win. The irrigation
water from the Kim-Nguu River covers the agricultural land in Tran-Phu commune
(Hai–Ba-Trung) and Yen-So commune (Thanh-Tri); Tu-Hiep and Lien-Minh
communes (Thanh- Tri).
6
Nguyen Thi Lan Huong
t o l ic h a nd
k i m n g u u r i v e r s ma p
bu o i ma k e t
g i a y br i d g e
VIETNAM
n g a t u so
da i k im
t o l ic h r iv er
ma i d o n g br i d g e
l inh da m
ye
ak
ol
ns
y en ng uu
pu mpi n g st a t i o n
ye
n
so
la
ke
k im ng uu r iv er
e
bu o u br i d g e
: f act or y
: w a r t e r , se d i me n t
Figure 1.1 Study area
7
Nguyen Thi Lan Huong
: so i l
sa mpl i n g
sa mpl e l o c a t i o n
Wastewater from households and industries is discharged into the To Lich and
Kim Nguu Rivers which today function mainly as the sewage and drainage systems of
Hanoi. In peri-urban areas of Hanoi, water from those rivers also serves as the source
of water and nutrients for food production in lakes, ponds and heavily irrigated fields.
However, inappropriate city planning and wastewater management for both industry
and household have caused various environmental problems including the heavy
metal pollution of surface water, sediments, soils and crops.
1.2 SCOPE OF OBJECTIVES
Numerous studies have been made on the heavy metal pollution of water and
sediment in different river systems in over the world (Ricker et al., 1977; Forstner and
Muller, 1981; Mark et al., 1982; Yousef et al., 1994; Birch et al., 1996; Fukue et al.,
2006). However, there are very few empirical data for heavy metal contamination of
water and river sediment in Hanoi City, Vietnam (Ho and Egashira, 2000). Ho and
Egashira (2000) had carried out research only on heavy metal pollution of river
sediments while heavy metal pollution of water and the effects of using polluted
irrigation water to the quality of soils and crops would not have been mentioned.
The objective of this study is to evaluate heavy metal pollution of the water
and sediment in the To Lich and Kim Nguu Rivers and its effects on the quality of
soils and crops in Hanoi, Vietnam. The specific objectives of this study are as follows:
(i) To assess the water quality of the To Lich and Kim Nguu Rivers in Hanoi City
and its suitability for irrigation water
(ii) To evaluate the heavy metal pollution of sediment in the To Lich and Kim
Nguu Rivers
Nguyen Thi Lan Huong
8
(iii) To evaluate the effects of using polluted irrigation water on the quality of
soils and crops in Hanoi, City
(iv) To find out the suitable chemical leaching solutions to eliminate heavy metals
from contaminated sediments and soils
1.3 RESEARCH CONTRIBUTIONS
The following list identifies some benefits from research:
(i)
Provide obtaining information the heavy metal pollution of the water and
sediments in the To Lich and Kim Nguu Rivers. Base on these results, we could
provide some recommendations to Vietnamese government to set up some
policies to reduce discharge of waste water from factories by appropriated
wastewater treatment.
(ii) Provide a complete evaluation on the effects of using polluted irrigation water
from the To Lich and Kim Nguu Rivers on the quality of soil and crops.
(iii) Using the suitable chemical leaching solutions to eliminate heavy metals from
contaminated sediments and soils.
1.4 ORGANIZATION OF THESIS
The thesis consists of six chapters, all of them under the form of scientific papers have
already published or submitted.
Chapter 1: Presents the scope and objectives of research.
Chapter 2: Presents the results from research program to assessment the water quality
of two rivers in Hanoi City and its suitability for irrigation water.
Chapter 3: Presents the results from research program to evaluate the heavy metal
pollution from contaminated river sediment in Hanoi City.
Nguyen Thi Lan Huong
9