Asymmetric effect of oil price change on inflation: Evidence from sub Saharan Africa countries - TRƯỜNG CÁN BỘ QUẢN LÝ GIÁO DỤC THÀNH PHỐ HỒ CHÍ MINH
Bạn đang xem bản rút gọn của tài liệu. Xem và tải ngay bản đầy đủ của tài liệu tại đây (802.49 KB, 7 trang )
<span class='text_page_counter'>(1)</span><div class='page_container' data-page=1>
<b>International Journal of Energy Economics and </b>
<b>Policy</b>
ISSN: 2146-4553
available at http: www.econjournals.com
<b>International Journal of Energy Economics and Policy, 2021, 11(1), 448-458.</b>
<b>Asymmetric Effect of Oil Price Change on Inflation: Evidence </b>
<b>from Sub Saharan Africa Countries</b>
<b>Umar Tijjani Babuga</b>
<b>1,2</b><b><sub>*, N</sub></b>
<b><sub>iaz </sub></b>
<b><sub>A</sub></b>
<b><sub>hmad</sub></b>
<b><sub> M</sub></b>
<b><sub>ohd</sub></b>
<b><sub> Naseem</sub></b>
<b>1</b>1<sub>School of Business and Economics, Universiti Putra Malaysia, 43400 UPM Serdang, Selangor, Malaysia, </sub>2<sub>Department of </sub>
Economics, Yusuf Maitama Sule University, Kano. PMB 3220, Kano – Nigeria. *Email:
<b>Received:</b> 05 September 2020 <b>Accepted:</b> 13 November 2020 <b>DOI:</b> />
<b>ABSTRACT</b>
This study is aimed at investigating the asymmetric effect of oil price change on inflation for Sub Saharan Africa (SSA) countries. Based on the
findings from the dynamic heterogenous nonlinear panel ARDL estimation, a panel data representation of Shin et al. (2014), the long run asymmetric
relationship exists between both oil price increase (<i>op+</i><sub>) and decrease (</sub><i><sub>op</sub></i>−<sub>) and inflation for these countries. Nevertheless, the oil price increase tends to </sub>
exert more effect on inflation than the oil price decrease. Oil serves as a key input to the production process, therefore, changes in its price would have
a great influence on the level of inflation which at last may hamper the process of economic progress. For policy implication, the monetary authorities
shall pay more attention to the increase in oil price than the oil price decrease in designing appropriate policies of price stability as the former exerts
greater impact on inflation than the latter. The price stability as one of the key macroeconomic goals could be attained if these countries understand
the oil price-inflation relationship and then monetary measures can be adjusted to endure the effect of oil price changes especially increase in oil price
on the price level so that stability in the prices of output can be maintained.
<b>Keywords:</b> Panel Data, PMG, ARDL, Oil Price, Inflation, Asymmetry, Sub Saharan Africa
<b>JEL Classifications:</b> C33, E31, E3
<b>1. INTRODUCTION</b>
Over the past decades most research has comprehensively
emphasized on the relationship between oil price and inflation.
Basically, the price of oil can have a significant impact on inflation
as oil is serve as a key production input to firms for manufacturing
of various goods and services. Particularly, higher prices of oil can
manifest into exorbitant consumer prices via high cost of production,
in which are interpreted as level of inflation (Lacheheb and Sirag,
2019). Therefore, frequent fluctuations in oil prices can also lead to
fluctuations in consumer prices and or inflation, which may exert
hindrance towards achieving the set target of macroeconomic policy.
Thus, maintenance of inflation and price stability within a specified
reasonable set target are important macroeconomic policy objectives
every economy wishes to have as it reflects a stable and healthy
economy. Price stability can positively affect economic growth
and development while price instability can create ambiguity by
making the economic agents unable to make right and fully informed
consumption and investment decision thereby leading to inefficient
allocation of resources. Price instability also raises the cost of doing
business by raising inflation risk premia (compensation to investor
for the loss of value in the investment) in interest rates thereby
leading to fall in investments and output (Nusair, 2019).
This development shows that dealing with the issue of oil
price-inflation relationship is vital as it tells how the changes in oil price
affect the inflation in the domestic economy. For instance, the rise
in inflation in the 1970s was associated with the increase in oil
price at that particular period. Likewise, the fall in inflation in the
past years (1980s and 1990s) were also linked to the fall in the
price of oil (Leblanc and Chinn, 2004). Oil price increase exerts
delinquent issues to the central banks. A spike in the price of oil
</div>
<span class='text_page_counter'>(2)</span><div class='page_container' data-page=2>
leads to the increase in the firms’ costs and prices of their products.
Ceteris paribus, this triggers an increase in the price level and
inflation. Therefore, it is important to empirically understand the
connection between oil price changes and inflation so that the firms
can adjust their pricing guidelines to go in-line with the prevailing
inflationary condition, likewise the policy makers can also adjust
the macroeconomic policies to go in line with that (Leblanc and
Chinn, 2004). Many empirical studies in the past established that,
oil price is positively affecting inflation. For instance, Choi et al.
(2018); Nusair (2019); Salisu et al. (2017), and Sek et al. (2015).
In this context, one of the regions that engages with the concern
of oil price-inflation relationship is the Sub Saharan Africa (SSA)
countries1<sub>. Essentially, what these SSA countries have in common </sub>
is that they all import oil for their domestic use. Even though there
are some SSA countries that are net oil exporters, yet they import
most of the fuel they use. The problem of limited refining capacity is
what prompted the oil exporting countries to follow the same suite
of fuel-importation with the remaining non-oil exporting countries
apart from their oil exportation. Despite the existence of many
refineries in various SSA countries still their capacities are very
much underutilized and consequently, the vast of the continent’s
oil resources are being transported overseas to have value added
and then returned to the countries as refined petroleum products
(Rettig et al., 2013). The lack of investment, decayed infrastructures
and poor performing capacity are the factors that made it necessary
for countries across Africa to rely on oil importation to meet up
with the growing need of fuel demand. The region fuel demand is
expected to raise by about 16.3% from approximately 4.3 million
barrel per day (mbd) in 2017 to about 5 mbd by 2023 (EIA,
2019). SSA refining capacity is expected to remain low until the
investment in the sector become fruitful to yield so much profit to
attract investors. And unfortunately, that might be a difficult task as
most of the governments of these countries prefer giving subsidy
on oil products and they only pay attention to projects that provide
leadership with political capital (Oirere, 2018).
These countries are using the imported refined petroleum products
for various manufacturing activities as one of the production
inputs alongside capital and labor. As such, changes in the oil price
are affecting their firms’ cost of production and the price level
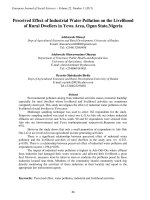
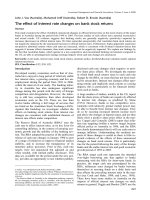
(Lacheheb and Sirag, 2019). The total refined oil consumption
by the SSA countries stands to be 51,150.43 million metric tons
(mmt) as at 1990 and raised to the tune of 109,107.7 (mmt) by
2016 (EIA, 2019), a growth of 113% within the period of 27 years.
Figure 1 shows the trend by which the oil consumption persists
for SSA countries between the period (1990 to 2016) 27 years.
As such, movement in oil price in the global market is affecting
the domestic price level in these SSA countries for the reason that
1 Sub Saharan Africa is a sub-region on African continent that geographically
lies on the southern part of Sahara. It consists of 48 countries which covers
all African countries except the northern part of the continent as presented
in Appendix I. These countries share the same race but different tribes, they
speak different languages (both native and official), some are Anglophones
while some are Francophones. Religious wise, different faiths are found
across the nations. Economically, these countries fall within the category of
middle- and lower-income countries as illustrated in Appendix II.
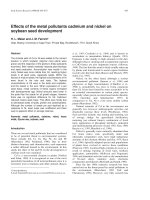
most of the economic activities rely on oil resource as source of
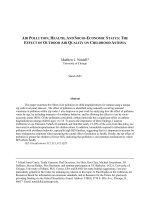
energy. Figure 2 below, shows the plot of oil price (WTI) and CPI
for the SSA countries. This indicates that the correlation of the
two variables are moderately high with a correlation coefficient
of 0.67, indicating that the two variables are in tandem with about
67 percent relationship.
It is also worth mentioning here that fluctuations in oil price affect
the economies of many countries as oil resources serve as major
production inputs to various manufacturing activities 2<sub>. As stated by </sub>
Lacheheb and Sirag (2019), changes in oil price affect production
cost and in turn production cost may put upward pressure on the
price level. If oil price rises up, the cost of production increased,
and the price level raises up too. In contrast, if the oil price falls,
the cost of production reduced too but not exactly the same way
as oil price increase triggers increase in the price level (inflation).
This is largely due to the downward price rigidity as highlighted by
Lacheheb and Sirag (2019) and Nusair (2019). This unequal effect
of oil price changes to inflation is what is referred to as asymmetric
effect, in which has been largely ignored in previous studies,
explicitly for the case of SSA countries. However, only limited
studies that have stressed on an asymmetric relationship between
oil price and inflation. For example. Nusair (2019) discovered that
there is an asymmetric relationship between oil price and inflation,
with significant oil price increase and insignificant oil price decrease
on inflation. While Salisu, Isah, Oyewole and Akanni (2017) found
that an asymmetric effect of oil price change on inflation, with oil
price increase exerting more effect than the oil price decrease.
Against this background, this study puts a step ahead in order to
better understand the nature of oil price-inflation relationship in
a more extensive manner. In view of that, this study exclusively
aimed at investigating the asymmetric effect of oil price change on
inflation for SSA countries that covers the period (1990 to 2018).
Specifically, this study inspects the short-run and long-run effects
of oil price shocks on inflation, which allows for asymmetric oil
price shocks. The empirical method employed is based on the
nonlinear panel ARDL (or PMG) method in which the asymmetric
relationship between oil price and inflation can be appropriately
examined by introducing a positive and negative partial sum
decompositions of oil price through the short-run and long-run
nonlinearities relationships.
This study provides exceptional contributions to the literature on
oil price-inflation. To the best of authors’ knowledge, this is the
first study that apply a nonlinear panel ARDL (PMG) method to
explore the asymmetric effect of oil price change on inflation for the
SSA countries where such kind of study is scanty. The study is also
imperative as these countries (SSA countries) would understand the
oil price-inflation asymmetric relationship so that emphasis should
be placed more on the particular change in oil price (either positive
or negative) that affect inflation most so that macroeconomic policy
can specifically be designed in such a way of tackling that. Using
of panel data has advantages in giving out identification that can
never be identified by either using pure time-series or pure
cross-sectional data (Law, 2018). The benefits of using panel data are as
</div>
<span class='text_page_counter'>(3)</span><div class='page_container' data-page=3>
follows: Firstly, in controlling for individual heterogeneity. These
heterogenous nature are different unobserved features of individual
groups or units that can lead to a biased estimate. Secondly, panel
data can be easily used to study the dynamics speed of adjustment
than mere cross-sectional or time-series data. Cross-sectional data
can portray nothing about dynamism while a time-series can take
a lengthy time before giving out a dynamic outcome but using this
same cross-sectional data together with the time series can give a
better dynamic picture of the data easily. Finally, panel data gives
more information data sets than cross-sectional or time series data
due to the pooling of individual units and time dimensions altogether
and come out with a larger sample size with less collinearity.
The remaining parts of the paper are organized as: section 2
reviews strand of literature on oil price-inflation. Section 3 explains
the empirical model, methodology and data; section 4 reports the
estimated results of panel unit root test, panel estimations and
the interpretations of the findings while the last section, section 5
concludes the discussion
<b>2. LITERATURE REVIEW ON THE EFFECT </b>
<b>OF OIL PRICE CHANGE ON THE LEVEL </b>
<b>OF INFLATION</b>
Fluctuations in the price of oil affect the economic activities of
countries for various purposes as oil is considered to be one of the
production inputs alongside capital and labor (Nusair, 2019). The
effect of oil price on price level may take place through supply
channel (Kilian, 2014). The effect of oil price change through the
supply channel is leading to increase in the price level and decrease
in output. Firms might be facing the dilemma of either increasing the
price of goods or cut production whenever the price of oil increased,
sometimes they are even facing the risk of both increasing the price
and reducing production when the raising oil price is too high.
Similarly, when the oil price falls, the costs of production decrease
too, the price of outputs is expected to fall if there is absence of
downward price rigidity. In the case where nominal wage rigidity
is present, this may not happen. The price might not be reduced
and even if it is going to be reduced it will be decreased by a little
amount when compared to the increase in oil price and that is
asymmetry. The oil price change is important enough to affect the
economic activities of various countries, as emphasized by (Kilian,
2014), the cost push inflations that the United States had experienced
in the 1970’s were the consequences of oil price shocks affected
macroeconomic variables including inflation. Sadorsky (2006)
considered oil as blood of a modern economy and believes that if
the increase in oil demand does exist and no development in their
supply, it will increase oil prices. The forces of supply and demand
in oil prices are significant in determining oil prices. Barsky and
Kilian (2004) employed Gordon (1984) type model to show that oil
price shocks can be inflationary by reducing industrial production
which could generate stagflation. Further, oil price shock could have
a long-term implication for economic growth.
<b>Figure 1:</b> Refined petroleum products consumption (mmt).
Source: Estimated from the data obtained from EIA. The data is for SSA Countries (1990 – 2016)
<b>Figure 2:</b> Consumer Price Index (CPI) and Nominal oil price
</div>
<span class='text_page_counter'>(4)</span><div class='page_container' data-page=4>
Obviously, majority of the past studies on oil price nexus assumed
that relationship between oil price and many economic activities
is linear, however, this may not necessarily hold because that
notion had already lost popularity since 1980s as most of the
macroeconomic variables proved the features of nonlinearity.
Hamilton (1983) demonstrated a strong correlation between oil
price changes and gross national product (GNP) growth in U.S.
data. However, his study pertained to a period in which all the
large oil price movements were upward, and thus the question
whether the correlation persists in periods of price decline was left
unanswered. Moreover, the price variable he used was somewhat
distorted by price controls in the 1970s. Mork (1989) was the
among the first to consider the asymmetric effect of oil price on
output. He investigates whether Hamilton’s results continue to hold
when the sample was extended to include the then recent oil market
collapse and the oil price variable was corrected for the effects of
price controls. Particular attention was given to the possibility of
asymmetric responses to oil price increase and decrease (<i>ROILP<sub>t</sub>+<sub>/</sub></i>
<i>ROILP<sub>t</sub></i>−<i><sub>).</sub></i><sub> Thus, Mork (1989) proposes an asymmetric definition </sub>
of oil price and distinguishes between positive and negative oil
price changes. He allowed for asymmetries in the price of oil and
derived positive and negative oil price shocks.
Empirically there is large body of researches in the literature
investigating the oil price relationship with other macroeconomic
variables including inflation. Study on oil price-inflation
relationship is vital as it tells how the changes in oil price affect
the inflation in the domestic economy and understanding that is
important as it helps the authorities in designing the appropriate
policies to control inflation in the country. Economic activities
rely on oil, hence, increase in oil price is raising the cost input
of production thereby causing the price level to rise. As such,
that highlight for the need of an in-depth analysis of oil
price-inflation nexus. Choi et al. (2018) investigate the impact of
global increase of oil price on domestic inflation on panel of 72
developed and developing countries over the period (1970-2015)
by using Impulse Response Function (IRF) by local projections.
The findings show that global oil price changes are positively
affecting domestic inflation. Sek et al. (2015) investigate the impact
of oil price changes on inflation for the two sets of countries they
categorized as low-oil-dependents (industrialized) and
high-oil-dependents (oil exporting) nations by applying a pooled mean
group (PMG) method on annual data for the period (1980-2010).
The findings indicate that oil price has a positive and significant
effect on inflation on low-oil-dependency countries (oil exporters).
Similarly, Salisu et al. (2017) examined the oil price inflation nexus
for the panel of selected oil exporting and importing countries
using a nonlinear panel ARDL method on quarterly data over the
period (2000-2014). The variables CPI was used as a measure of
inflation, London-brent as a measure of oil price and industrial
production index as a measure of GDP. The results indicate that
both increase and decrease in oil prices are positive and significant,
meaning that oil price increase is inflationary while oil price
decrease is deflationary. Nusair (2019) investigates the non-linear
effect of real oil price changes on inflation on Gulf Corporation
Council (GCC) countries using ARDL, NARDL and PMG for
the period (1970-2016). The finding indicates that increase in
real oil price is positively affecting inflation in the investigated
area while the negative oil price is either insignificant or is having
a lesser effect on inflation. It is also indicated that there is long
run and significant relation between the variables (inflation and
real oil price). Also, Lacheheb and Sirag (2019) examined the oil
price change-inflation relationship on Algeria (1970-2014) using
non-linear autoregressive distributed lag (NARDL) method.
The findings indicate that, increase in oil price has a positive
and significant effect on inflation rate in the investigated area,
whereas a decrease in oil price effect on inflation was found to be
insignificant. The reason behind that is, even though Algeria is
expected to have more revenue as oil price increases which may
raise the level of GDP, but at the same time many productions of
goods and services require oil as an input to the production process.
Therefore, production relates to the prices of refined oil and oil in
general which may translate into increase in the price level. Also,
many of the commodities that are used locally within the country
are products of other nations which affected by the increase in oil
price thereby importing them with the inflation into the country.
Again, to investigate the impact of oil price on the prices of
gasoline and natural gas, Atil et al. (2014) employed a non-linear
ARDL method on monthly data over the period (January 1997 to
September 2012). WTI was used to measure oil price, gasoline
to measure petrol and Henry Hub natural gas to measure natural
gas. The findings indicate that oil price affect gasoline and natural
gas prices positively but in a non-linear manner.
</div>
<span class='text_page_counter'>(5)</span><div class='page_container' data-page=5>
(United States, United Kingdom, France, Germany and Japan)
using a quarterly data between the period 1980 Q1 to 2001 Q4.
The results show that, oil price increase causes a modest effect on
inflation for the United States, Japan and Europe.
Another strand of literature has discovered that the relationship
between oil price increase and inflation is not even of significant
importance. Proponent about these are studies such as Basnet and
Upadhyaya (2015) that examine the effect of oil price shocks on
macroeconomic variables (including inflation) for ASEAN-five
countries employing a structural VAR (SVAR) method over the
period (1970Q1-2010Q2). The findings indicate that increase
in oil price shock has no any significant long run impact on
inflation and other macroeconomic variables incorporated in the
study. This is due to the fact that most of the effects of oil price
shocks are blended shortly into the economy as they are absorbed
within five to six quarters. Similarly, Çatik and Ưnder (2014)
employing a Markov regime-switching approach to investigate
the oil price pass through impact on inflation in Turkey utilizing
a monthly data for the period between 1997 February to 2007
May. Harmonized index of consumer price (HICP) was used as
a proxy of inflation, west texas intermediate (WTI) as proxy of
inflation and output gap was derived via using Hodrick-Prescot
formula as a difference between the actual and potential output.
The findings indicate that oil price changes do not affect inflation
in either of the inflationary regime (higher or lower inflationary
periods). Oil price affects inflation, hence oil price itself is
being affected by either change in aggregate demand or change
in aggregate supply. However, there is increasing evidence that
changes in aggregate demand is found to be more powerful in
influencing the oil price than its counterpart aggregate supply
change. For instance, Valcarcel and Wohar (2013) employed a
Bayesian Structural Vector Autoregressive (BSVAR) method to
study the various aggregate shocks on real oil price and its
pass-through effect to consumer prices. They utilized a quarterly on
United States data for the period 1948 Q1 to 2011 Q2. The findings
indicate that aggregate demand shocks have more impact on oil
price than the aggregate supply shocks and the oil price volatility
does not seem to be affecting the changes in inflation.
Overall, from the strand of literature reviewed, it has shown that
the long run relationship between oil price and inflation is in
diverse ways. Several studies came out with different findings,
some find oil price to be positively affecting inflation, some
find oil price to be negatively affecting inflation, others find oil
price to be moderately impacting inflation while others even find
no significant relation between oil price and inflation. This is
indicating there is absence of a clear consensus in the empirical
literature of oil price-inflation relationship. Again, there is scanty
of studies in the literature regarding to Sub Saharan Africa (SSA)
on oil price-inflation relationship as most of the previous studies
were conducted on advanced oil importing and other emerging
economies of the world overlooking SSA countries despite the
important role that oil plays to their economies. Equally important,
one of the limitations of a previous study by Nusair (2019) is that,
it is a bivariate model considering only oil price and inflation,
as such, the author suggested the use of multivariate model by
incorporating other relevant variables in the model to see their
impact on oil inflation. There upon, for the purpose of this study,
a multivariate model is formed with additional explanatory
variables in addition to oil price to test their relevant impact on
inflation.
<b>3. EMPIRICAL MODEL, METHODOLOGY </b>
<b>AND DATA</b>
<b>3.1. Model Specification</b>
The empirical specification is aimed at investigating the
asymmetric relationship between real oil price and inflation on
panel data for SSA countries. Thus, the study follows the works
of Sek et al. (2015); Salisu et al. (2017); Davari and Kamalian
(2018); Lacheheb and Sirag (2019) and Nusair (2019):
<i>lcpi</i> <i>lop</i> <i>lrgdpc</i> <i>lreer</i>
<i>gap</i>
<i>it</i> <i>it</i> <i>it</i> <i>it</i> <i>it</i>
<i>it</i> <i>i</i> <i>it</i>
<sub>4</sub> 1 2 4 <sub>(1)</sub>
where <i>lcpi</i>is the natural log of consumer price index, <i>lop</i> is the
natural log of real real oil price3<sub>, </sub><i><sub>lrgdpc</sub></i><sub> is the natural log of real </sub>
GDP per capita (constant 2010 US$),<i> lreer </i>is the natural log
of real effective exchange rate and <i>gap</i> is the output gap4<sub>. The </sub>
output gap is used to capture the fluctuation effects of real GDP
on inflation, and <i>η<sub>i</sub></i> is the unobserved country specific effect and
<i>Ɛ </i>is the independent and identically distributed error term, <i>i</i> is the
country index while <i>t</i> is the time index.
Based on the theory, the coefficient <i>lop</i> is expected to be positive
<i>(β<sub>1</sub>>0)</i>, signifying as real oil price increases, inflation increase
also in oil exporting countries. This is showing the positive effect
of the increase in real oil price to the price level. Meaning that
increase in real oil price is creating a rise in demand to cost of
production, there by triggering a rise in the price level, which
is inflationary (Sek et al., 2015; Salisu et al., 2017; Lacheheb
and Sirag, 2019 and Nusair 2019). Next, the coefficients <i>lrgdpc</i>
is expected to be positively signed <i>(β<sub>2</sub>>0)</i> as increase in GDP
is increasing the rate of inflation. This is since, countries make
higher income (or output) may lead to the increase in their
aggregate demand, and increase in consumption and price
levels, which is also known as inflation rate (Sek et al., 2015
and Salisu et al., 2017). For the exchange rate, the coefficients
lreer is expected to be negative <i>(β<sub>3</sub>>0) </i>as appreciation in real
effective exchange rate tends to lower inflation in the long run.
The appreciation in the local domestic currency makes domestic
goods expensive in the international market, which then lowers
demand and production thereby causing drop in the price level.
Sek et al. (2015) found that exchange rate appreciation is
negatively affecting inflation for oil exporting countries. Then,
the coefficient of output gap is expected to have a positive sign
<i>(β<sub>4</sub>>0)</i>, signifying that inflation increases when the aggregate
output is greater than potential capacity as indicated by Lacheheb
3 In order to control the effect of nominal exchange rate variations on
oil price, the WTI was transformed to real oil price by converting it to
each countries’ nominal exchange rate and then scale it to the respective
consumer price index (CPI) of each country under the study
4 It is computed as the difference between the log of real GDP and the
</div>
<span class='text_page_counter'>(6)</span><div class='page_container' data-page=6>
and Sirag (2019) and Nusair (2019) who found that output gap
is positively affecting inflation.
To account for asymmetries in the model, the approach by
Shin, Yu and Greenwood-nimmo (2014) is followed. In the
approach, the decomposition of real oil price into partial sum
decompositions of changes is simplified. In a linear symmetric
model, the positive and negative impact of oil price on inflation
are assumed to be identical whereas in the case of asymmetric
model, the positive and negative effects on inflation are assumed
to be different. The asymmetric model is trying to test whether
the oil price increase have greater effect on inflation than the oil
price decrease. Therefore equation 2 become with replacement
of real oil price with the decomposition of real oil price into
partial sum decompositions of positive and negative changes
in real oil price.
<i>lcpi</i> <i>lop</i> <i>lop</i> <i>lrgdpc</i> <i>lreer</i>
<i>outputga</i>
<i>it</i> <i>it</i> <i>it</i> <i>it</i> <i>it</i>
<sub>4</sub> <i>pp</i>1<i>it</i> <i>i</i> 2<i>it</i> 2 4
(2)
where <i>lop+<sub> and lop</sub></i>−<sub>are decomposed oil price into partial sum of </sub>
decomposition of positive and negative changes.
<b>3.2. Econometric Methodology</b>
In this study, nonlinear ARDL as proposed by Shin et al. (2014)
in a panel data form is the econometric method employed. It is in
the form of nonlinear representation of a dynamic heterogenous
panel (ARDL) estimators of Mean Group (Pesaran and Smith,
1995), Pooled Mean Group (Pesaran et al., 1999) as used by
Nusair (2019); Salisu and Isah (2017), and Salisu et al. (2017)
Abdlaziz et al., (2018 and 2020). The Pooled Mean Group
(PMG) allows short-run coefficients, speed of adjustment and
error variances to vary across panels and at the same time restrict
the long-run coefficients to be similar across the groups. The
PMG also generates consistent estimates of the mean of the short
run coefficients by taking the simple average of individual unit
coefficients. The Mean Group (MG) method of estimation assumed
that both slopes and intercepts can differ across panels/countries
that is why the long-run coefficients are not similar across panels.
The Hausman (1978) test is conducted after the estimation of
PMG and MG to get the appropriate method between the two. The
null cannot be rejected if the long run homogeneity exists, and
therefore PMG is more efficient. The choice of nonlinear panel
ARDL for this study was motivated due to the fact that it allows the
combination of I(0) and I(1) variables, it allows the estimation of
nonlinear asymmetric relationship by decomposing the variable of
interest into partial sums of decomposition of positive and negative
changes and it captures heterogeneity effects across panels. And
also, a Wald test is carried out after the MG, PMG estimations in
order to find whether the model is asymmetric. The null will be
rejected if the long run or short run asymmetry exists.
Starting with the linear symmetric model, the dynamic
heterogeneous panel regression can be incorporated into the
error-correction model using the ARDL (<i>p, q</i>) method, where <i>p</i> is the
lag of the dependent variable, and <i>q</i> is the lag of the independent
variables, the Akaike information criterion (AIC) is used for the
selection of the lag order:
<i>lcpi</i> <i>lcpi</i> <i>lop</i> <i>lrgdpc</i> <i>lreer</i> <i>gap</i>
<i>Y</i>
<i>it</i> <i>i</i> <i>i t</i> <i>it</i> <i>it</i> <i>it</i> <i>it</i>
<i>i</i>
<sub>, 1</sub> <sub>1</sub> <sub>2</sub> <sub>3</sub> <sub>4</sub>
<i>jj</i> <i>i t j</i>
<i>j</i>
<i>p</i>
<i>ij</i> <i>i t j</i>
<i>j</i>
<i>p</i>
<i>ij</i> <i>i t j</i>
<i>i</i>
<i>lcpi</i> <i>lop</i> <i>lrgdpc</i>
<sub>,</sub><sub></sub> <sub>,</sub> <sub>,</sub>
1
1
1
1
<i><sub>jj</sub>lreer<sub>i t j</sub></i><sub>,</sub><sub></sub> <i><sub>ij</sub>gap<sub>i t</sub></i><sub>,</sub><sub></sub><sub>1</sub> <i><sub>i</sub></i> <i><sub>it</sub></i>
(3)
From equation the equation (3) above, the following equation (4)
is be formed, which is specifying the nonlinear asymmetric model
with decomposed oil price into partial sum of decomposition of
positive and negative changes (oil+<sub> and oil</sub>-<sub>) as established by Shin, </sub>
Yu and Greenwood-nimmo (2014).
<i>lcpiit</i> <i>ilcpii t</i> <i>lopit</i> <i>lopit</i> <i>lrgdpcit</i> <i>lreerit</i>
<sub>, 1</sub> <sub>1</sub> <sub>2</sub> <sub>3</sub> <sub>4</sub>
5 <sub>1</sub>
1
1
1
<i>gapit</i> <i><sub>j</sub></i> <i>Y lcpiij</i> <i>i t j</i> <i>lop</i>
<i>p</i>
<i>ij</i> <i>i t j</i>
<i>ij</i>
<i>j</i>
<i>p</i>
<sub></sub>
, ( ,
<i>llop</i> <i>lrgdpc</i> <i>lreer</i>
<i>gap</i>
<i>i t j</i> <i>ij</i> <i>i t j</i> <i>ij</i> <i>i t j</i>
<i>ij</i> <i>i t</i> <i>i</i>
, , ,
,
)
<sub>1</sub> <i><sub>it</sub></i>
(4)
where <i>δ </i>is the long-run coefficient of the independent variables,
and <i>γ</i> is the parameter of speed adjustment to the long-run
equilibrium. <i>η </i>is the fixed effect and <i>Ɛ<sub>it</sub></i> is the error term. <i>i </i>and
<i>t </i>represents country and time index respectively. It is assumed
that the error term <i>Ɛ<sub>it</sub></i> in the PMG framework is distributed
independently across <i>i </i>and <i>t </i>with zero mean and variance. The
error term is also distributed independently of the regressors.
Moreover, to capture the long-run relationship between dependent
and independent variables, it is assumed that if the parameter of the
speed of adjustment is <0 (<i>γ </i>< <i>0</i>) for all <i>i</i>, then panel co-integration
is expressed as:
<i>lcpi<sub>it</sub></i> <sub>1</sub><i>lop<sub>it</sub></i><sub>2</sub><i>lrgdpc<sub>it</sub></i><sub>3</sub><i>lreer<sub>it</sub></i><sub>4</sub><i>gap<sub>it</sub><sub>it</sub></i> (5)
<i>lcpiit</i>1<i>lopit</i>2<i>lopit</i>3<i>lrgdpcit</i>4<i>lreerit</i>5<i>gapititt</i> (6)
Where 1 1 2 2 3 3
4 4 5 5
/ , / , / ,
/ <i>i<sub>i</sub>and</i> <i>i</i> / <i><sub>i</sub></i> <i>i</i>
ϕ δ γ ϕ δ γ ϕ δ γ
ϕ δ γ ϕ δ γ
− = − = − =
− = − = are the long run
coefficients of oil price positive, oil price negative, real GDP per
capita, real effective exchange rate and output gap respectively.
<b>3.3. Data and Descriptive Statistic</b>
</div>
<span class='text_page_counter'>(7)</span><div class='page_container' data-page=7>
exchange rate (constant 2010 US$) and output gap. In order
to control the effect of nominal exchange rate variations on oil
price, the WTI was transformed to real oil price by converting
it to each countries’ nominal exchange rate and then scale it to
the respective consumer price index (CPI) of each country under
the study. Output gap is computed using Hodrick-Prescott (HP)
filter, it is the difference between the log of real GDP and HP
filtered trend of the logged real GDP. The data of CPI, real GDP
per capita were obtained from the database of world development
indicators (WDI). The Real effective exchange rate is obtained
from Bruegel. The data of oil prices is obtained from U.S. Energy
Information Administration (EIA).
<b>4. EMPIRICAL RESULTS</b>
<b>4.1. Panel Unit Root Test</b>
Being that oil resources serve as the main production input to all
the SSA countries regardless of being oil importers or exporters.
Therefore, changes in price are reflecting to the changes in the
firms’ cost of production, price level and inflation. To explore the
short and long-term relationship between oil price change and
inflation for the panel of these (SSA) countries, a panel unit root
test was first conducted to ensure stationarity of the variables.
The Levin et al. (2002) LLC which assumes a common unit root
process and Im et al. (2003) IPS which assume individual unit
root process were carried out and reported in Table 2. The results
show a mixture of order integration for the variables, some are
stationary at level I(0) while others at first-difference I(1). The
test results indicate that under LLC (intercept) at level, variables
of CPI (lcpi), oil price (lop) and real effective exchange rate
(lreer) are stationary at 1%, but real GDP per capita (lrgdpc) is
not significant. Under IPS (intercept) at level, variables lcpi, lreer
are stationary at 1% while lop is significant at 5% and lrgdpc is
not significant. Under LLC (intercept and trend) variables lcpi,
lrgdpc and lreer are stationary at 1% while lop is insignificant.
Under IPS (intercept and trend) variables lcpi, lreer are significant
at 1%, lrgdpc at 10% but lop is insignificant. And then, all the
variables are stationary at first-difference for both trend and
intercept under both LLC and IPS tests are significant at 1%
level of significance. This make the data qualified in fulfilling
the requirement to go ahead with ARDL estimation that allowed
the combination of both I(0) and I(1) variables, hence the panel
cointegration estimation.
<b>4.2. Symmetric and Asymmetric Results</b>
The PMG, MG results were computed and then results were
subjected to Hausman (1978) test for making preference of the
appropriate method to take. The rejection of the null is indicating
the absence of the long run homogeneity (MG is appropriate)
while non-rejection of the null is signifying the presence of long
run homogeneity (PMG is appropriate). In this study, the Hausman
test result clearly indicates the PMG is the appropriate estimator
as the null hypothesis is not rejected as displayed in Table 3. As
such, the results from the preferred estimate, PMG are going to
be explained.
Taking a glance of Table 3 (model 1 – without asymmetry), the
PMG results indicate that inflation responds to the changes in
oil price. There is positive and significant relationship between
oil price and inflation, denoting that as real oil price increases
by 1% the inflation rises by 0.44%. This is consistent with the
findings such as Lacheheb and Sirag (2019), Nusair (2019) and
Sek et al. (2015). For the remaining control variables, real GDP
per capita is significant and negative denoting a 1% increase
in real GDP is leading to the decrease in inflation by 0.27%.
This might be attributed to the nonchalant attitude of the people
toward the manufacturing activities or nonperformance of
the manufacturing sector in these countries. the real effective
exchange rate is significant and negatively signed as expected
similar to tthe finding of Sek et al. (2015), which is showing
as real exchange rate increase by 1%, inflation will drop by
1.028%. Output gap is significant but negatively signed which is
denoting as aggregate output exceeds the potential capacity, the
rate of inflation rises. The convergence coefficient is significant
and negative as expected signifying speed of adjustment to the
long run equilibrium as 11.7% when any deviation occurs in the
short run, and the duration it takes to converge to the long run
equilibrium is 8.54 years. In the short run, the results indicate
oil price is significant but negatively affecting inflation in the
SSA countries while the output gap is positive and significantly
affecting inflation.
</div>
<!--links-->