The effects of firm’s innovation on customer’s loyalty: A case study of Saigon COOP - TRƯỜNG CÁN BỘ QUẢN LÝ GIÁO DỤC THÀNH PHỐ HỒ CHÍ MINH
Bạn đang xem bản rút gọn của tài liệu. Xem và tải ngay bản đầy đủ của tài liệu tại đây (1.06 MB, 7 trang )
<span class='text_page_counter'>(1)</span><div class='page_container' data-page=1>
The effects of firm’s innovation on customer’s loyalty:
A case study of Saigon COOP
Bui Quang Hung1<sub>, Trinh Thuy Anh</sub>2*<sub>, Nguyen Thi Thu Thao</sub>2<sub>, Nguyen Pham Kien Minh</sub>2
1<sub>University of Economics Ho Chi Minh City, Vietnam </sub>
2<sub>Ho Chi Minh City Open University, Vietnam </sub>
*<sub>Corresponding author: </sub>
ARTICLE INFO ABSTRACT
DOI:10.46223/HCMCOUJS.
econ.en.10.1.222.2020
Received: September 16th<sub>, 2019 </sub>
Revised: October 10th<sub>, 2019 </sub>
Accepted: April 20th<sub>, 2020 </sub>
Keywords:
marketing innovation,
products/service innovation,
social media innovation,
customer’s loyalty, customer
satisfactions, consumer
perceived value
Identifying how the innovation affects the customer’s
loyalty via the consumer perceived value and customer
satisfactions from products or services provided by the
Coopmart Retailers System in Ho Chi Minh City, Vietnam is the
purpose of this search. This research also draws some
suggestions for the firm’s future development. The research was
conducted through 2 phases: a qualitative pilot study and
quantitative analysis. The pilot study was conducted with 5
people who are working in Coopmart as department heads,
deputy heads, and managers with at least 10 years’ experience.
The qualitative survey will be distributed in the Ho Chi Minh
City Coopmart system’s customers with member cards where
291 valid surveys were qualified for further analysis. This
research’s insight is the impacts of innovation on the consumer
perceived value, which has few focuses from previous studies.
The outcome of the research has shown different aspects of the
innovation to the consumer perceived value and customer
satisfactions.
1. Introduction
</div>
<span class='text_page_counter'>(2)</span><div class='page_container' data-page=2>
2017). However, to be adapted to the world’s changes earning customers’ loyalty and their
interests and satisfactions from commercial markets must be carefully considered. There are times
many big corporations fail to continue their businesses smoothly or sometimes got bankrupted
when fails to achieve customers’ loyalty and satisfaction such as Nokia, Yahoo, United Airlines,
Sony and so on (Cox & Rodionova, 2017; Davies & Thompson, 2014; Hof, 2012; Minds, 2018).
Once again, it is important to earn customer satisfaction as well as customer’s loyalty to survive
the competition in the globalization era. There are times wrong decisions in a business move or
failed to innovate have shown consequences to the business despite significant good reputations
and customer satisfactions such as the Coca Cola, Blockbuster, and Compaq’s failures (Goh, 2017;
Smith, 2013). Thus, it is important to know innovation moves ensuring the catch on customer
satisfactions and their loyalties guaranteeing the firms’ future development, which is also the aims
for Coopmart as well as the main focus of this study. In this paper, we aim to evaluate the effect
of innovative activities on the consumer perceived values in addition to their satisfaction and
loyalty. Moreover, this paper tries to research the addressed questions: (1) Which factors represent
the corporation’s innovation activities? (2) How innovation factors could affect the consumer
perceived value, satisfaction, and loyalty to the corporation? Then this paper could suggest some
managerial implications for enhancing innovated activities of the corporation.
2. Literature review
2.1. Background theory: Resource-based view theory and innovation
Resource-based theory is an approach to increase the competitive advantage to get firm
performance by focusing on resources (Wernerfelt, 1984). Barney (1991) argues that the firm could
look inside the company to find the sources of competitive advantage instead of looking at a
competitive environment for it. Competitive advantage can be gained by offering clients with value,
rare, inimitable, and non-substitutable, called VRIN (Eisenhardt & Martin, 2000). Resource-based
theory is expanding in the market and forms the competitive advantage and business performance
of the firm. Thus, innovation is a way to maximize internal resources. By doing that, the company
has increased its development in terms of business, market, and customer aspects.
According to Fontana (2011), innovation aims to make the competitive advantage of firms. In
terms of competitiveness, innovation helps the firms in sustaining a pattern of continuous changes in
the company and how that offering is created and delivered. Innovation is an important factor to
achieve the business performance of firms, markets, and customers (Gamal, Salah, & Elrayyes, 2011).
2.2. Study concept
2.2.1. Innovation
</div>
<span class='text_page_counter'>(3)</span><div class='page_container' data-page=3>
both customers’ loyalty and perceived values, which also defines how innovation is addressed in
this search.
When classifying the categories of innovation, Burdon, Mooney, and Al-Kilidar (2015)
remarked Foster and Kaplan’s work on innovation’s benchmarks include “Incremental
innovation”, “Radical innovation”, and “Transformation innovation” (Burdonet al., 2015; Foster
& Kaplan, 2011). Later, 4 main dimensions that generally categorized the innovation on its specific
operating fields include “Product/service innovation, process innovation, market innovation and
organizational innovation” (Oecd, 2005; YuSheng & Ibrahim, 2019). However, these dimensions
recently updated where innovation is divided into “Product Innovation” and “Business Process
Innovation” with 6 addressed subcategories for describing Business Process Innovation (OECD &
Eurostat, 2018). In the investigating topic, the main key factors of the problem are the incremental
innovation in business process innovation with the subcategories are the updates in “marketing
and sales” and part of improvements in “production of goods and service”. In detail, the
innovation key factors in this paper include the innovations in Marketing, Products/Services, and
Social Media.
2.2.2. Customers’ satisfaction, loyalty, and consumers perceived value
Many scholars often refer satisfaction as the degree that the customers’ expectations fit
with the quality and performance of the provided products/services that they received and it is
marked as one of the most important core factors, the key of success, the marketing field’s motto,
and goal for firms’ future development (E. W. Anderson & Sullivan, 1993; Kotler & Keller, 2003;
Swan & Oliver, 1989). It is believed that customer satisfaction will have a positive effect on
repurchasing behaviors on the products or services offered by a specific provider (Chitturi,
Raghunathan, & Mahajan, 2008; Mittal & Kamakura, 2001), which was found to be the basis proof
for addressing customer’s loyalty (Mittal & Kamakura, 2001; Schneider & Bowen, 1999), and
boosting the firm’s image (Hallencreutz & Parmler, 2019; Liat, Mansori, & Huei, 2014). The key
drivers of customer satisfactions are believed as “perceived quality, perceived value, and customer
expectations” (Cronin. Jr & Taylor, 1992; Sivadas & Baker‐Prewitt, 2000) and be measured by
the developed indexes reflecting “National Customer Satisfaction dimensions” in various countries
(E. W. Anderson, Fornell, & Lehmann, 1994; Fornell, Johnson, Anderson, Cha, & Bryant, 1996).
Thus, the hypotheses for investigating the positive and direct impacts of products and services
related innovation, as well as consumer perceived values on customers’ satisfaction are proposed,
which is the level of customer’s positive emotional activities toward specific products/services or
branches in this context. This paper also tests the impact of customer satisfactions on their loyalty
to reconfirm the positive direct impact.
</div>
<span class='text_page_counter'>(4)</span><div class='page_container' data-page=4>
field. Thus, this search aims to study the effects of consumer perceived value with innovation
factors on customer loyalty, which is the insight of this research.
Customer’s loyalty is believed to have a significant tie with the customer satisfactions,
which have been tested many times (Mittal & Kamakura, 2001; Selnes, 1993), and identified as
the high level in customers’ preferable in repurchasing products/services compared to the firm’s
competitors despite the situation (Kursunluoglu, 2014; Oliver Richard, 1997). Martensen,
Gronholdt, and Kristensen (2000) addressed four keys that result in the customer’s loyalty include:
the repurchase behavior, price’s changes acceptance, high tendency level in a recommendation,
and the resistance to firms’ competitors’ offers, which is confirmed by many scholars (Auh, Bell,
McLeod, & Shih, 2007; Fečiková, 2004). Hence, the potential value from the customer’s loyalty
is limitless for the firm’s growth. In this context, loyalty is defined as the high level of customer’s
favorable in supporting a specific branch’s offered products/services besides the neglect of their
competitors’ offers.
2.2.3. The relationships among innovation, customers’ satisfaction, loyalty, and consumers
perceived value
The relationships among innovation and factors represented for customers’ purchasing
habits and behaviors have been conducted many times:
Hussain (2016) found the positive impact relationships between the service quality and
perceived value to customer satisfaction and brand loyalty, where both of them can be used to
predict the future state of customer’s brand loyalty as well as customer satisfaction. This study
also implies the prediction of brand loyalty from customer satisfaction. Moreover, Hussain’s
service quality can be identified as our study’s product/service innovation factor. Also, a strong
impact between service quality and customer loyalty is addressed in the search of Liu, Lee, and
Hung (2017) in both direct and indirect ways through customer satisfaction channels where
customer satisfaction is believed to have a strong effect on customer’s loyalty in this search.
When investigating the impacts among the perceived service quality, customer satisfaction,
revisit intentions, further recommendation, and perceived advantage in re-purchasing services,
Ažman and Gomišček (2015) confirmed the positive and non-linear in the direct impact
relationship from the service quality to the customer satisfaction and later the customer satisfaction
will impact the customer’s loyalty through the repurchase habit, word-of-mouth advertisement,
and revisit behavior. In addition to this, Luarn and Lin (2003) addressed a strong influence from
customer satisfaction and perceived values to customer’s loyalty behavior. Furthermore, YuSheng
and Ibrahim (2019)’s study clarifies the tight impacts of the service innovation on customer
satisfaction and the customer’s loyalty.
</div>
<span class='text_page_counter'>(5)</span><div class='page_container' data-page=5>
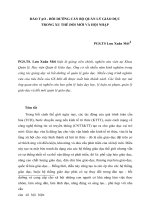
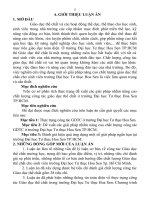
Figure 1. Proposed research model
Although many studies have been conducted before about the innovation factors, consumer
perceived value, customer satisfaction, and customer’s loyalty, however, the studies about the
details in innovation still be an insightful search for science and there are very few searches about
the impact of social media innovation to other factors. Furthermore, the impacts from innovation
factors to consumer perceived value, although been researched many times, but still not be
recorded as the main concern from scholars. Thus, the following hypotheses are developed in this
context and its proposed model is shown in Figure 1 and listed below:
Hypothesis H1: Marketing innovation has a positive direct impact on consumer perceived
value.
Hypothesis H2: Marketing innovation has a positive direct impact on customer satisfactions.
Hypothesis H3: Product innovation has a positive direct impact on consumer perceived
value.
Hypothesis H4: Product innovation has a positive direct impact on customer satisfactions.
Hypothesis H5: Social media innovation has a positive direct impact on consumer perceived
value.
Hypothesis H6: Social media innovation has a positive direct impact on customer
satisfactions.
Hypothesis H7: Consumer perceived value has a positive direct impact on customer
satisfactions.
Hypothesis H8: Consumer perceived value has a positive direct impact on customer’s
loyalty.
</div>
<span class='text_page_counter'>(6)</span><div class='page_container' data-page=6>
3. Methodology
The research was divided into two phases in which the first phase was the pilot study with
qualitative analysis by face to face interview in a group within 90 minutes with 5 employees for
the scale selection and validation for being suited with the retail’s field of study. They are working
in Coopmart system at the middle and senior management level with at least 10 years’ experience
as department heads, deputy heads, and managers. At first, there are 29 variables were suggested
for the survey, which later were revised and reduced to 27 variables, and divided into 6 factors
with measurement is described in Table 1 and used 5-point Likert scales (5 = strongly agree; 1 =
strongly disagree). The changes were made on consumer perceived value and customer satisfaction
factors. Convenient sampling was chosen to conduct the sample collected and the modified factors
are shown in Table 1 and Table 4.
Table 1
Constructed table for the survey data
Construct Measurement
Marketing Innovation
(Zuñiga-Collazos &
Palacio, 2016)
Seven items were chosen for addressing the marketing innovation
factor include updating in: marketing activities, brochure and
information, layouts for product visualizing, products on shelves, sale
off programs, customer’s service, employees’ attitudes, and service
abilities.
Products/Services
Innovation
(Daragahi, 2017)
Three items represent for this factor include new products/services
release rate, time, and high-quality products/services.
Social Media Innovation
(Samydai, Yaseen, &
Dajani, 2018)
The SMI was constructed with four items: flexibility in information
searching; sharing information via a social network; positive
feedbacks and evaluations from customers to Coopmart’s image and
service.
Perceived Value
(Yang & Peterson, 2004)
This factor is analyzed through four items: reliability, pricing policy,
and discount programs in products/services; addressing products and
customers’ support services.
Customer satisfaction
(Weng, Ha, Wang, &
Tsai, 2012)
The customer satisfaction was computed from Coopmart offered
products/services on three items: general satisfaction, customers’
attitudes when using products/services, the meets on the customers’
needs.
Customer’s Loyalty
(Luarn & Lin, 2003)
The customer’s loyalty was addressed by six items: foremost choice,
loyalty, encouragement level, proud to be a part of Coopmart, negative
information resistance, rate of suggestions for future growth.
Source: The research’s data analysis
</div>
<span class='text_page_counter'>(7)</span><div class='page_container' data-page=7>
4. Results
4.1. Sample structure
Table 2
Summarized data for statistical purpose
Construct Classification Number %
Gender Female 209 71.8
Male 81 28.2
Age
Below 20 years old 40 13.7
21-40 years old 119 40.9
41-60 years old 93 32.0
> 61 years old 39 13.4
Education
High school 46 15.8
College 68 23.4
University 135 46.4
Higher Degree 42 14.4
Major
Office staffs 146 50.2
Businessmen 68 23.4
Manufacturer 36 12.4
Others 41 14.1
Source: Data analysis result of the research
From the statistics, the majority of respondents are females who account for over 70 percent
of the survey, where approximately 75 percent of Coopmart loyal customers with ages ranging
from 21 to 60. Moreover, the total rate of college and university degree holders accumulate for
over 70 percent while in the major classification, the total rate of office staff and businessmen are
close to 75 percent.
4.2. Confirmatory Factor Analysis (CFA)
</div>
<!--links-->