Study on genetic variability, heritability, genetic advance in tomato (Solanum lycopersicum L.) - TRƯỜNG CÁN BỘ QUẢN LÝ GIÁO DỤC THÀNH PHỐ HỒ CHÍ MINH
Bạn đang xem bản rút gọn của tài liệu. Xem và tải ngay bản đầy đủ của tài liệu tại đây (155.41 KB, 7 trang )
<span class='text_page_counter'>(1)</span><div class='page_container' data-page=1>
<i><b>Int.J.Curr.Microbiol.App.Sci </b></i><b>(2017)</b><i><b> 6</b></i><b>(11): 1775-1783 </b>
1775
<b>Original Research Article </b>
<b>Study on Genetic Variability, Heritability, Genetic Advance in </b>
<b>Tomato (</b>
<i><b>Solanum lycopersicum</b></i>
<b> L.) </b>
<b>Priyanka Parappa Ligade1, Vijay Bahadur2* and Pushpa Gudadinni1</b>
1
Department of Horticulture, Naini Agricultural Institute, Sam Higginbottom University of
Agriculture, Science Technology, Allahabad, U.P., India
2
Naini Agricultural Institute, Sam Higginbottom University of Agriculture, Science Technology,
Allahabad, U.P., India
<i>*Corresponding author </i>
<i><b> </b></i> <i><b> A B S T R A C T </b></i>
<i><b> </b></i>
<b>Introduction </b>
Tomato belongs to the family solanaceae and
is native of Peru Equador region Rick.
Tomato is a typical day neutral plant and is
mainly self-pollinated, but a certain
percentage of cross-pollination also occurs. It
is a warm season crop reasonably resistant to
heat and drought and grows under wide range
of soil and climatic conditions. The ancestor
of cultivated tomato is cherry tomato
(<i>Lycopersicon esculantum var. cereasiforme). </i>
There are several species of tomato but the
fruits are edible only of two species namely
(<i>Lycopersicon </i> <i>esculantum</i> and <i>L. </i>
<i>pimpinellifolium</i>). Tomato is a major source
of vitamins and minerals. The nutrition value
of tomato per 100 g fruit weight is, Energy-18
Kcal (1%), Carbohydrates-3.9g (3%),
Protein-0.9g (1.6%), Total Fat, 0.2g (0.7%),
Folates-15µg (4%), Niacin-0.594mg (4%), Vitamin
A-833 IU (28%), VitaminC-13mg (21.5%),
Vitamin E-0.54mg (4%), Calcium10 mg
(1%), Iron 0.3mg (4%), Magnesium-11mg
(3%), ò Carotene 449àg, Carotene--101àg,
Lycopene-2573µg (20-50 mg). (USDA
National Nutrient data base, 2012-13)38.
Inheritance of quantitative characters is often
influenced by variation in other character
which may be due to pleotropic or genetic
<i>International Journal of Current Microbiology and Applied Sciences </i>
<i><b>ISSN: 2319-7706</b></i><b> Volume 6 Number 11 (2017) pp. 1775-1783 </b>
Journal homepage:
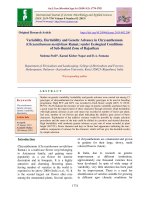
An experiment was conducted to evaluation of genetic variability present in the twenty
genotypes and observations were recorded on various yield and yield contributing
characters. Analysis of variance showed the significant variability for all the studied
characters. High values of GCV and PCV were observed for characters viz., number of
fruits per plant (55.74, 56.21), number of locules per fruit (36.44, 37.15), average fruit
weight (35.45, 35.97) fruit yield per plant (31.09,32.35) marketable fruit yield per plot
(31.10, 32.36) and which indicates the presence of high genetic variation. High heritability
coupled with high genetic advance observed for the traits viz., plant height, number of
flowers per cluster, number of fruit set per cluster, average fruit weight, number of fruits
per plant, fruit yield per plant, fruit yield per plot, fruit shape index, TSS0Brix, Ascorbic
acid, Beta carotene, Pericarp thickness, Number of locules per fruit. Which indicates
presence of additive gene action and demands for population improvement by selection
<b>K e y w o r d s </b>
Genetic variability,
Heritability, Genetic
advance, Tomato,
GCV, PCV.
<i><b>Accepted: </b></i>
15 September 2017
<i><b>Available Online:</b></i>
10 November 2017
</div>
<span class='text_page_counter'>(2)</span><div class='page_container' data-page=2>
<i><b>Int.J.Curr.Microbiol.App.Sci </b></i><b>(2017)</b><i><b> 6</b></i><b>(11): 1775-1783 </b>
1776
linkage. There, must be a thorough
knowledge of the existence genetic
variability, mode of inheritance of economic
characters, heritability, kind of gene action
and the relative magnitude of additive,
dominance and total genotypic and
phenotypic variance of the population is
essential to formulate an effective crop
improvement programme. There is a scope of
yield and quality improvement and there by
develop export potential of tomato. Hence the
present investigation carried out for genetic
variability for quantitative and qualitative
traits in genotypes of tomato. The knowledge
of genotypic and phenotypic coefficient of
variation is being useful in designing
selection criteria from variable population. In
general, it was noted that the value of
phenotypic coefficient of variation is higher
than the genotypic Coefficient of Variation
For all the traits.
<b>Materials and Methods </b>
The present investigation the experiment was
carried out at the horticulture Research Farm,
Department of Horticulture, Naini
Agricultural Institute, Sam Higginbottom
University of Agriculture, Science
Technology, Allahabad. The experimental
material comprised of twenty genotypes,
collected from source (Table 1). The
genotypes were grown in a randomized block
design with three replicates during winter
season 2016-2017. keep distance of line to
line distance 60cm. and plant to plant distance
45cm. Observations were recorded on five
randomly selected plants per treatment for
sixteen quantitative and qualitative characters
<i>viz., </i> Plant height (cm), Days to first
flowering, Days to 50 % flowering,
Flowers/cluster, Fruit set/cluster, Fruit weight
(kg), Fruits/ Plant, Fruits/Plant, Fruit yield/
Plant (g), Fruit yield/ Plot (kg), Fruit shape
index, TSS 0Brix, Ascorbic acid (Vit C)
mg/100g, Lycopene (mg/100g), ß Carotene
(mg), Pericarp Thickness (mm), Number of
Locules/ Fruit. The analysis of variance was
done as suggested by Panse and Sukhatme
The phenotypic and phenotypic coefficients
of variation were worked out according to the
Robinson <i>et al.,</i> Heritability in broad sense
and expected genetic advance on the basis of
percent of mean were worked out according
to the method advocated by (Burton and
Devane) and Johnson <i>et </i> <i>al.,</i> (1955)
respectively. The analysis of genetic
divergence was worked out by Mahalanobis
D2 statistics as per Mahalanobis method and
genotypes are grouped into different cluster
following Tocher’s method as described by
Rao.
<b>Results and Discussion </b>
</div>
<span class='text_page_counter'>(3)</span><div class='page_container' data-page=3>
<i><b>(3.12-Int.J.Curr.Microbiol.App.Sci </b></i><b>(2017)</b><i><b> 6</b></i><b>(11): 1775-1783 </b>
1777
7.78), Ascorbic acid (mg/100g)
(11.61-18.65mg), lycopene content (5.20-6.46mg)
per 100 g of pulp. Beta carotene content
(0.21-0.37mg) per 100 g of pulp, fruit shape
index (0.38-1.53), Pericarp Thickness
(1.77-5.27mm), Number of locules per fruit
(2.27-6.27), The characters under investigation were
analyzed for genotypic coefficient of variation
(GCV), phenotypic coefficient of variation
(PCV), heritability (broad sense) and genetic
advance as percent of mean (Table 2). In the
present study, magnitude of phenotypic
variances has high values than genotypic
variances for the all characters, which is an
indicator of additive effect of the environment
on expression of traits. Low range of GCV
and PCV reveals that these traits have low
sensitivity to environmental effect and it is
reducible. High values of GCV and PCV were
observed for characters <i>viz</i>., number of fruits
per plant, number of locules per fruit, average
fruit weight, fruit yield per plant, marketable
fruit yield per plot, fruit shape index, plant
height, number of fruit set per cluster,
TSS0Brix. Moderate GCV and PCV were
observed for traits <i>viz.,</i> pericarp thickness, of
flowers per cluster, Beta carotene, Ascorbic
acid. Low GCV and PCV were observed for
traits <i>viz.,</i> days to first flowering, Lycopene
content, days to 50% flowering.
<b>Table.1 </b>List of different genotypes was used in present investigation
(Source of collection from IIVR Varanasi)
<b>S.No. </b> <b>Genotype </b>
<b>Symbol </b>
<b>Name of </b>
<b>Genotypes </b>
<b>Determinate/Indeterminate </b>
<b>/ Semi Determinate </b>
<b>Source of Released </b>
<b>1 </b> G1 ArkaVikas Determinate IIHR,Bangalore
<b>2 </b> G2 Punjab Chhuhara Determinate PAU, Ludhiana
<b>3 </b> G3 Azad T-5 Determinate CSAUA&T, Kanpur
<b>4 </b> G4 Azad T-6 Determinate CSAUA&T, Kanpur
<b>5 </b> G5 EC-501574 Determinate IARI New Delhi
<b>6 </b> G6 Kashi Vishesh Determinate IIVR, Varanasi
<b>7 </b> G7 S 22 Determinate IARI New Delhi
<b>8 </b> G8 Pant T-5 Semi Determinate GBPUA&T, Pantnagar,
<b>9 </b> G9 Pant T-7 Semi Determinate GBPUA&T, Pantnagar,
<b>10 </b> G10 Hissar Lalit Semi Determinate HAU, Hissar
<b>11 </b> G11 Kashi Aman Semi Determinate IIVR, Varanasi
<b>12 </b> G12 Kashi Hemant Semi Determinate IIVR, Varanasi
<b>13 </b> G13 Kashi Sharad Indeterminate IIVR, Varanasi
<b>14 </b> G14 H-88-78-1 Indeterminate IIVR, Varanasi
<b>15 </b> G15 H-88-78-5 Indeterminate IIVR, Varanasi
<b>16 </b> G16 Ageta-32 Indeterminate IARI New Delhi
<b>17 </b> G17 Pusa Cherry Indeterminate IARI New Delhi
<b>18 </b> G18 Angoorlata Indeterminate IIVR, Varanasi
<b>19 </b> G19 Pusa Ruby Indeterminate IARI,New Delhi
</div>
<span class='text_page_counter'>(4)</span><div class='page_container' data-page=4>
<i><b>Int.J.Curr.Microbiol.App.Sci </b></i><b>(2017)</b><i><b> 6</b></i><b>(11): 1775-1783 </b>
1778
<b>Table.2 </b>Analysis of variance for yield and its components in Tomato
<b>S. No. </b> <b>Character </b>
<b>Mean sum of squares </b>
<b>Replications </b> <b>Genotypes </b> <b>Error </b>
1 Plant Height (cm) 22.73 2994.3 ** 23.14
2 Days to First Flowering 0.88 17.76** 0.92
3 Days to 50 % Flowering 0.61 11.01** 1.529
4 Number of Flowers/cluster 0.13 9.47** 0.42
5 Number Fruit set/cluster 0.10 6.15** 0.19
6 Average Fruit Weight (g) 11.77 1188.08** 12.28
7 Number of Fruits/ Plant 25.75 2511.23** 14.09
8 Fruit Yield/ Plant (kg) 0.065 1.88** 0.05
9 Marketable Fruit Yield/ Plot (kg) 5.38 152.87** 4.09
10 Fruit shape Index 0.029 0.259** 0.023
11 TSS (°Brix)) 0.050 2.861** 0.04
12 Ascorbic Acid(Vit C)mg/100g 0.33 12.00** 0.70
13 Lycopene Content (mg/100g) 0.005 0.30** 0.01
14 ß Carotene (mg) 0.00 0.005** 0.001
15 Pericarp Thickness (mm 0.02 1.66** 0.009
16 Number of Locules/ Fruit 0.04 5.52** 0.07
</div>
<span class='text_page_counter'>(5)</span><div class='page_container' data-page=5>
<i><b>Int.J.Curr.Microbiol.App.Sci </b></i><b>(2017)</b><i><b> 6</b></i><b>(11): 1775-1783 </b>
1779
<b>Table.3 </b>Range, mean, variance, coefficient of variations, heritability, genetic advance and genetic advance as % of mean for 16
characters of tomato
<b>S. No. </b> <b>Characters </b> <b>Mean </b>
<b>Range </b> <b>Coefficient of variance </b>
<b>h2 (b.s.) </b>
<b>(%) </b>
<b>Genetic </b>
<b>Advance </b>
<b>(5%) </b>
<b>Genetic </b>
<b>Advance </b>
<b>as % of </b>
<b>mean (5%) </b>
<b>Min. </b> <b>Max. </b> <b>GCV (%) </b> <b>PCV (%) </b>
<b>1.</b> <b> Plant Height (cm) </b> 116.46 78.00 171.00 27.02 27.34 97.71 64.08 55.03
<b>2.</b> <b> Days to First Flowering </b> 34.66 31.33 40.07 6.83 7.38 85.83 4.52 13.04
<b>3.</b> <b> Days to 50 % Flowering </b> 40.08 35.65 43.33 4.44 5.40 67.40 3.01 7.50
<b>4.</b> <b> Number of Flowers/cluster </b> 9.06 6.13 11.93 19.16 20.46 87.68 3.35 36.97
<b>5.</b> <b> Number of Fruit set/cluster </b> 6.34 4.33 8.87 22.23 23.31 90.93 2.77 43.67
<b>6.</b> <b> Average Fruit Weight (g) </b> 55.90 6.89 87.47 35.45 35.97 96.95 40.16 71.84
<b>7.</b> <b> Number of Fruits/ Plant </b> 51.76 27.87 164.93 55.74 56.21 98.33 58.94 113.86
<b>8.</b> <b> Fruit Yield/ Plant (g) </b> 2.52 1.14 3.99 31.09 32.35 92.33 1.55 61.54
<b>9.</b> <b> Marketable Fruit Yield/ Plot (kg) </b> 22.64 10.24 35.89 31.10 32.36 92.23 13.94 61.57
<b>10.</b> <b> Fruit shape Index </b> 0.92 0.38 1.53 30.46 34.71 77.02 0.51 55.08
<b>11.</b> <b> TSS (°Brix)) </b> 4.37 3.12 7.78 22.17 22.70 95.36 1.95 44.60
<b>12.</b> <b> Ascorbic Acid(Vit C)mg/100g </b> 14.17 11.61 18.65 13.20 14.38 84.28 3.67 24.96
<b>13.</b> <b> Lycopene Content (mg/100g) </b> 5.61 5.20 6.46 5.54 5.83 90.03 0.61 10.82
<b>14.</b> <b> ß Carotene (mg) </b> 0.26 0.21 0.37 16.68 16.94 97.03 0.09 33.85
<b>15.</b> <b> Pericarp Thickness (mm) </b> 5.35 1.77 5.27 19.36 19.32 98.30 1.52 39.54
</div>
<span class='text_page_counter'>(6)</span><div class='page_container' data-page=6>
<i><b>Int.J.Curr.Microbiol.App.Sci </b></i><b>(2017)</b><i><b> 6</b></i><b>(11): 1775-1783 </b>
1780
<b>Table.4 </b>Summary of genotypic and phenotypic coefficient of variation with heritability and genetic as percent of mean for yield and
its component in tomato
<b>Sr. </b>
<b>No. </b> <b>Components </b>
<b>Status in </b>
<b>present study </b> <b>Characters </b> <b>Supported by </b>
1 GCV and
PCV
High
Number of fruits per plant, number of locules per fruit
average Fruit Weight, fruit yield per plot, fruit yield per
plant, fruit shape index, plant height, number of fruit set
per cluster, TSS0Brix.
Supe <i>et al.,</i> (2006), Sharma <i>et al.,.</i>(2006),.
Lal <i>et al.,</i> (1991), Bharti <i>et al., </i>(2002), Brar
et al., (2000), Mohanty (2002), Kaushik <i>et </i>
<i>al.,</i> (2011), Islam <i>et al.,</i> (2012). Rahaman <i>et </i>
<i>al.,</i> (2012), Vinod Kumar <i>et al., </i>(2013), Dar
and Sharma (2011), Rani and Anitha (2011),
Golani <i>et al.,</i> (2007).
Moderate Pericarp thickness, Number of flowers per cluster, Beta
carotene, Ascorbic acid.
Manna and Paul (2012)
Low Days to first flowering, Lycopene content, days to 50%
flowering
Islam <i>et al.,</i>(2012)
2
Genetic
Advance as a
percent mean
High
Plant Height, Number of fruits per plant average fruit
weight, Number of Flowers/cluster, number of fruit
set/cluster, average fruit weight, number of fruits per
plant, fruit yield/plant, marketable fruit yield, fruit shape
index, TSS, Ascorbic acid, beta carotene, pericarp
thickness, number of locules/fruit
Haydar <i>et al., </i>(2007), Tasisa <i>et al., </i>(2011),
Ahmed <i>et al.,</i> (2006), Bharti <i>et al., </i>(2002),
Manna and Paul (2012)
Moderate Days to first flowering, lycopene content -
Low Days to 50% flowering -
3 Heritability
High
Plant Height, Days to First Flowering, Days to 50 %
Flowering, Flowers/cluster, Fruit set/cluster, Fruit Weight,
Fruits/ Plant, Fruits/Plant, Fruit Yield/ Plant (g), Fruit
Yield/ Plot, Fruit shape Index, TSS 0Brix, Ascorbic Acid
(Vit C) mg/100g, Lycopene (mg/100g),ß Carotene (mg),
Pericarp Thickness (mm), Number of Locules/ Fruit.
Phookan <i>et al.,</i> Ahmed <i>et al., </i> (2006),
Mahesha <i>et al.,</i>.Joshi and Singh,. Singh <i>et </i>
<i>al.,</i> Bharti <i>et al., </i>(2002), Dar and Sharma
(2011), Kumar <i>et al.,</i> (2004).
Moderate -
</div>
<span class='text_page_counter'>(7)</span><div class='page_container' data-page=7>
<i><b>Int.J.Curr.Microbiol.App.Sci </b></i><b>(2017)</b><i><b> 6</b></i><b>(11): 1775-1783 </b>
1781
GCV measures the amount of variation
present in a particular character but it doesn’t
provide an idea about the proportion of
heritable variation present in the total
variation therefore, heritability estimates were
calculated in the present study. In the present
study heritability estimates were high for all
the studied character as categorized (Low
<30%; Moderate 30-60%; high >60%) by
Johnson <i>et al., </i>(1955) (Table 3).
High heritability coupled with high genetic
advance observed for the traits viz., plant
height, number of flowers per cluster, number
of fruit set per cluster, average fruit weight,
number of fruits per plant, fruit yield per
plant, fruit yield per plot, fruit shape index,
TSS0Brix, Ascorbic acid, Beta carotene,
Pericarp thickness, Number of locules per
fruit. High heritability coupled with moderate
genetic advance was observed for characters
viz., days to first flowering, lycopene content.
indicates the presence of both additive and
non-additive gene action for these traits. High
heritability coupled with low genetic advance
found for only one character days to 50%
flowering, which clearly states the presence of
non-additive gene action and selection is not
rewarding for this trait. Recombination
breeding and recurrent selection may be used
for such type of traits for population
improvement.
<b>References </b>
Ahmed, N., Khan, M. I. and Gupta, A. J.
Variability and heritability in tomato
(<i>Lycopersicon esculentum</i> Mill.).<i>Envt. </i>
<i>Eco</i>, 2: 386-388 (2006).
Arun, J. and Kohli, U. K. Genetic divergence
for qualitative and quantitative in
tomato, <i>Indian J. Agric. Sci., </i> 73(2):
110-113 (2003).
Basavaraj,S. N., Hosamani, R. M. and Patil,
B. C. Genetic variability and genetic
divergence in tomato (<i>Solanum </i>
<i>lycopersicon </i>[Mill] Wattsd.). <i>Karnataka </i>
<i>J. Agric. Sci</i>., 23(3): 536-537 (2010).
Bharti, A., Jain, B. P.,Verma, A. K. and
Bharti,O. A. Genetic variability,
heritability and genetic advance in
tomato (<i>Lycopersicon </i> <i>esculentum</i>
Mill.).<i>J. Res., Birsa Agri. Uni</i>., 14(2):
249-252 (2002).
Brar, G. S., Singh, S., Cheema, D. S. and
Dhaliwal, M. S. Studies on variability,
heritability and genetic advance for
yield and component characters in
tomato (<i>Lycopersicon </i> <i>esculentum</i>
Mill<i>).J. Res.Punjab Agric. Uni</i>.,37(3/4):
190-193 (2000).
Burton and Devane Estimating heritability in
tall Fesscue from replicated clonal
marterial<i>. Agron. J.</i>, 45: 474-481(1953).
Burton, G. W. Quantitative inheritance in
grass. <i>Proc. 6thInt. Grassland Cong.,</i>1:
227-283 (1955).
Dar, R. A. and Sharma, J. P. Genetic
variability studies of yield and quality
traits in tomato (<i>Lycopersicon </i>
<i>esculentum </i>Mill). <i>International J. Plant </i>
<i>Breeding and Genetic, </i> 5(2): 168-174
(2011).
Golani, I. J., Mehta, D. R., Purohit, V. L.,
Pandya, H. M. and Kanzariya, M. V.
Genetic variability, correlation and path
coefficient studies in tomato. <i>Indian J. </i>
<i>Agric. Res.,</i>41(2): 146 – 149 (2007).
Haydar, A, Mandal, M.A, Ahmed, M.B,
Hannan, M.M, Karim, R, Razvy, M.A,
Roy, U.K and Salahin, M. Studies on
Genetic Variability and
Interrelationship among the different
traits in tomato <i>(Solanum lycopersicum </i>
<i>L.).</i> <i>Middle-East Journal of Scientific </i>
<i>Research.</i> 2 (3-4): 139-142 (2007)<i>.</i>
Islam, M.S, Mohanta, H.C, Rafii, M.Y and
</div>
<!--links-->
Báo cáo khoa học: Phytoene synthase genes in tomato (Solanum lycopersicum L.) – new data on the structures, the deduced amino acid sequences and the expression patterns doc
- 9
- 607
- 0


.push({});</script> </div> </div> </div> <div class="vf_link_relate px-2 my-2"> <h2 class="vf_doc_relate text-2xl font-bold my-4">Tài liệu liên quan</h2> <ul class="grid grid-cols-12 gap-2"> <li class="col-span-6 md:col-span-2"> <div class="card-doc " onclick="actionDocRelated(this)"> <a class="card-doc-img" href="https://text.123docz.net/document/1104484-bao-cao-khoa-hoc-phytoene-synthase-genes-in-tomato-solanum-lycopersicum-l-new-data-on-the-structures-the-deduced-amino-acid-sequences-and-the-expression-patterns-doc.htm" title="Báo cáo khoa học: Phytoene synthase genes in tomato (Solanum lycopersicum L.) – new data on the structures, the deduced amino acid sequences and the expression patterns doc"> <i class="icon i_type_doc i_type_doc2"></i> <img class="lazy" src="data:image/gif;base64,R0lGODlhAQABAIAAAP///wAAACH5BAEAAAAALAAAAAABAAEAAAICRAEAOw==" data-src="https://media.store123doc.com/images/document/14/rc/yk/medium_yko1394144410.jpg" width="124" height="179" alt="Báo cáo khoa học: Phytoene synthase genes in tomato (Solanum lycopersicum L.) – new data on the structures, the deduced amino acid sequences and the expression patterns doc" onerror="this.src=)