- Trang chủ >>
- Văn Mẫu >>
- Văn Miêu Tả
Effect of physico-chemical conditions on the structure and composition of the phytoplankton community at Jatinangor, Indonesia - Trường Đại học Công nghiệp Thực phẩm Tp. Hồ Chí Minh
Bạn đang xem bản rút gọn của tài liệu. Xem và tải ngay bản đầy đủ của tài liệu tại đây (216.76 KB, 7 trang )
<span class='text_page_counter'>(1)</span><div class='page_container' data-page=1>
<i><b>Int.J.Curr.Microbiol.App.Sci </b></i><b>(2017)</b><i><b> 6</b></i><b>(11): 4188-4195 </b>
4188
<b>Original Research Article </b>
<b>Effect of Physico-Chemical Conditions on the Structure and Composition of </b>
<b>the Phytoplankton Community at Jatinangor, Indonesia </b>
<b>R.A. Yousif1*, Masyamsir2, Dhahiyat2, Sunarto2 and Zahidah2</b>
1
Department of Fisheries and Wildlife Science, Sudan University of Science and Technology,
P.O.BOX204, Khartoum, Sudan
2
Faculty of Fisheries and Marine Science, Universitas Padjadjaran, Jl.21.Jatinangor, Indonesia
<i>*Corresponding author </i>
<i><b> </b></i> <i><b> </b></i><b>A B S T R A C T </b>
<i><b> </b></i>
<b>Introduction </b>
Phytoplankton is a key component of the
waterbody biota in general, because it forms
the base of the pyramid of productivity.
Assuming that any increase in nutrient inputs
leads to enhanced primary productivity,
phytoplankton may serve as a relevant
indicator of the trophic state in water
(Szeląg-Wasielewska, 2006). Phytoplankton is the
chief primary producer of the aquatic
environment which fixes solar energy by
process of photosynthesis, assimilating carbon
dioxide and water to produce carbohydrates.
Phytoplanktonic species have different
physiological requirements and thus show
diverse responses to physical and chemical
parameters such as light, temperature and
nutrient regime. Their sensitivity and
variations in species composition are often a
<i>International Journal of Current Microbiology and Applied Sciences </i>
<i><b>ISSN: 2319-7706</b></i><b> Volume 6 Number 11 (2017) pp. 4188-4195 </b>
Journal homepage:
This study was conducted to evaluate the impact of activities in campus Universitas
Padjadjaran (UNPAD) on the water quality as a result of the entery and discharge of
pollution materials from laboratories, food courts, agriculture and domestic waste in
campus UNPAD to Check dam UNPAD, Ciparanje and Cikuda River. Very limited
information is available on the phytoplankton status and the effect of water pollution on
the phytoplankton population of this area. Thus the present study was undertaken to study
the seasonal diversity and the physico-chemical properties of water for five sampling
localities were selected for the present study depending upon the anthropogenic activities
around the Campus UNPAD, water samples at selected points were analysed for pH
ranged from 5.45- 8.97, DO 4.3-8.9 mg L-1, BOD 0.27 - 15.78 mg L-1, PO4 0.080-0.611 mg
L-1, NH3-N 0.0001-1.150 mg L-1, NO3-N 0.333-2.820 mg L-1. Spatial and temporal
distribution of phytoplankton was studied in detail, the results showed that, the total
number of phytoplankton classes were 8 in five different stations studied which comprises
42 different genera, the genus are represented by 10 genus Chlorophyceae, 14 genus
Bacillariophyceae, 10 genus Cyanophyceae, 4 genus Euglenophyceae, 1 genus
Coscinodiscophyceae, 1 genus Florideophyceae, 1 genus Xanthophyceae and 1 genus
Zygnematophyceae. Among phytoplankton various species of Bacillariophyceae were
dominant throughout the study period, with changes in temperature and phytoplankton
composition density of phytoplankton exhibited during the dry season.
<b>K e y w o r d s </b>
Pollution, Water
Quality, Check dam
UNPAD, Cikuda
River.
<i><b>Accepted: </b></i>
28 September 2017
</div>
<span class='text_page_counter'>(2)</span><div class='page_container' data-page=2>
<i><b>Int.J.Curr.Microbiol.App.Sci </b></i><b>(2017)</b><i><b> 6</b></i><b>(11): 4188-4195 </b>
4189
reflection of significant alteration in ambient
condition within an ecosystem (Devassy and
Goes, 1988, 1989). Hence before any
utilization of lake resources comes into
consideration, plankton study is of primary
interest. Earlier studies on phytoplankton
diversity (Pieterse and Van, 1988; Vaulot,
2001; Pongswat <i>et al.,</i> 2000; Kendirim, 2001;
Millman <i>et al.,</i> 2005; Tiwari and Chauhan,
2006; Sridhar <i>et al.,</i> 2006; Tas and Gonulol,
2007; Senthilkumar and Sivakumar, 2008;
Ganai <i>et al.,</i> 2010), revealed the importance
of this type of study. Studies showed that
most of the phytoplankton was a great deal
sensitive to the varying environment
condition. That is to say, a negative change in
phytoplankton composing the primary
productivity affects all living creatures.
Therefore, phytoplankton that is composed of
the first ring of food chain should be
examined taxo-nomically and ecologically.
Algae are a large and diverse group of simple
plants ranging from unicellular to
multicellular form. These are considered as
the first autotrophic (photosynthetic) plants of
the planet. Algae are ubiquitous, that occur in
almost all habitats, ranging from marine and
freshwater to desert sands and from hot
springs to snow.
The habitats occupied by fresh water algae are
divided into lotic (running) and lentic
(stagnant) water types (Lone <i>et al.,</i> 2016).
Due to the growth of algae in different
habitats, they may be variable and highly
diversified group of green plants i.e.,
phytoplanktonic (free floating), benthos
(attached to sediments), epiphytic (on plants),
epilithic (on stones), epipelic (on sand),
endophytic (inside the plant), epizoic (on
shells), and endozoic (inside sponge). They
have enormous economic implications, not
only as primary producers and pollution
indicators but also as a source of several
natural products, biofertilizers, fine chemicals
(Lone <i>et al.,</i> 2013; Chisti, 2007).
<b>Materials and Methods </b>
The present study results from limnological
investigation undertaken during the dry
season (July-September 2015) and wet season
(December 2015-February 2016), on Check
dam UNPAD, Bandung, Indonesia (Inlet S
06° 55’ 51.26” E 107° 46’ 24.35”, Centre S
06° 55’ 52.24” E 107° 46’ 26.85, Outlet S 06°
55’ 54.94” E 107° 46’ 27.01”, Cikuda River S
06° 55’ 44.78” E 107° 46’ 53.52” and
Ciparanje S 06° 54’ 37.14” E 107° 46’
13.17”). The Check dam UNPAD is chiefly
fed by streams which flows from Campus
UNPAD. The water samples were collected
from selected sites during morning hours in
two liters polythene bottles for
physico-chemical parameters between 7:00 A.M. to
11:00 A.M. Water temperature, pH,
transparency and DO were determined on the
sampling sites, while BOD, NH3, NO3 and
PO4 were analyzed in the laboratory by using
standard methods of APHA, (2005).
For the plankton analysis, the samples were
collected by filtering 10 liters of water filtered
through plankton net of 20μ pore size filtering
cloth and concentrated up to 100 ml. The
concentrated plankton samples were
preserved immediately with the help of 5 ml
of Lugol’s Iodine solution (Edmondson,
1959). The samples were observed under the
microscope and identified phytoplankton
using standard keys and published literature.
The phytoplankton species have been
identified by using keys - Edmondson,
W.T.(1959) and Adoni, A. D. <i>et al.,</i> (1985).
Counting was made by putting one drop of
concentrate on a slide and observing the
content under inverted microscope (Metzer).
Results were expressed in No. /ml.
</div>
<span class='text_page_counter'>(3)</span><div class='page_container' data-page=3>
<i><b>Int.J.Curr.Microbiol.App.Sci </b></i><b>(2017)</b><i><b> 6</b></i><b>(11): 4188-4195 </b>
4190
Shannon - Wiener Index (H) = Σni/N In ni/N
Where:
H = Shannon -Weaver index of diversity;
ni = total numbers of individuals of species,
N = total number of individual of all species.
<b>Results and Discussion </b>
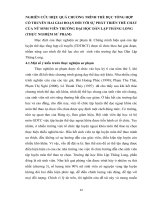
Species composition of phytoplankton its
varied during this research that is depend on
the location and also the seasonility. The
results showed that, the total number of
phytoplankton classes were 8 in five different
stations studied which comprises 42 different
genera, the genus are represented by 10 genus
Chlorophyceae, 14 genus Bacillariophyceae,
10 genus Cyanophyceae, 4 genus
Euglenophyceae, 1 genus
Coscinodis-cophyceae, 1 genus Florideophyceae, 1 genus
Xanthophyceae and 1 genus
Zygnematophyceae (Figure 1).
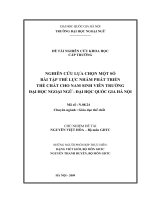
The seasonal variation in the species diversity
index (H') have been calculated and presented
in (Table 3) for all the Five stations. The
abundance of phytoplankton during the dry
and wet season ranged from 700-10912.5Cell
L-1. The low abundance of phytoplankton
during the wet season due to low amount of
nutrients and also the entry of fresh rain water
into the Check dam UNPAD, Cikuda River
and Ciparanje. Succession of phytoplankton
communities is affected by strong seasonal
influence (Fig. 2).
Occurrence of phytoplankton groups shows a
gradual increase from July to September
during the dry months, with a peak in
September. The population slowly declines
till February at all stations. This may be due
to the changes in temperature.
The high biomass in dry season could be the
result of higher temperature and quantity of
essential nutrients. Changes in the
composition of plankton biomass perhaps are
affected by predation and grazing which
complicates the interpretation of population
dynamics of phytoplankton in the Ckeck dam
UNPAD, Cikuda River and Ciparanje (Fig. 3
and 4).
<b>Table.1 The average of physico-chemical parameters in water during the period of this study </b>
<b>Seasons </b>
<b>Parameters </b> <b>Dry season </b> <b>Wet season </b> <b>Average </b>
Temperature 23.90±1.35 25.63±1.64 24.77±1.22
Transparency 38.17±4.48 72.90±9.19 55.54±2456
pH 7.19±0.45 7.86±0.39 7.53±0.47
DO 5.61±1.25 5.42±0.59 5.52±0.13
BOD 5.05±2.47 2.64±0.56 3.85±1.70
Orthophosphate 0.194±0.037 0.346±0.067 0.270±0.107
Ammonia (NH3) 0.0014±0.0007 0.0662±0.0436 0.0338±0.0458
Nitrate (NO3-N) 0.675±0.360 1.130±0.432 0.903±0.322
Heavy Metals
</div>
<span class='text_page_counter'>(4)</span><div class='page_container' data-page=4>
<i><b>Int.J.Curr.Microbiol.App.Sci </b></i><b>(2017)</b><i><b> 6</b></i><b>(11): 4188-4195 </b>
4191
<b>Table.2 Abundance of phytoplankton during the different season </b>
<b>Stations </b>
<b>The abundance of phytoplankton (Cell L-1) </b>
<b>Average </b>
<b>Dry Season </b> <b>Wet Season </b>
Inlet 6198.3 1400 3799.15
Center 3245.83 2833.3 3039.57
Outlet 1833.3 1137.5 1485.40
Cikuda 2770.83 1554.2 2162.52
Ciparanje 10912.5 700 5806.25
<b>Table.3 Average of Shannon-Wiener Diversity Index (H') of Phytoplankton during the </b>
different season
<b>Stations </b>
<b>(H</b>'<b>) </b>
<b>Dry Season </b> <b>Wet Season </b>
Inlet 1.34 1.48
Center 1.49 1.44
Outlet 1.51 1.08
Cikuda 1.84 1.64
Ciparanje 1.41 1.85
<b>Fig.1 Total genus of phytoplankton during the study </b>
</div>
<span class='text_page_counter'>(5)</span><div class='page_container' data-page=5>
<i><b>Int.J.Curr.Microbiol.App.Sci </b></i><b>(2017)</b><i><b> 6</b></i><b>(11): 4188-4195 </b>
4192
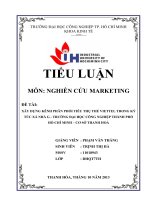
<b>Fig.3 Average of Diversity Index (H') of Phytoplankton during the different season </b>
<b>Fig.4 Distribution of chlorophyll-a (mg L</b>-1) during the dry and wet season
<b>Species abundance </b>
Phytoplankton density in the five sampling
areas (Inlet Check dam UNPAD, Center
Check dam UNPAD, Outlet Check dam
UNPAD, Cikuda River and Ciparanje) during
dry months (July to September 2015) and wet
season (December to February 2016) are
shown in Table 2 of the 8 major groups
identified, Bacillariophyceae were the most
abundant phytoplankton in all stations for the
five sampling areas in both seasons, followed
by the Chlorophyceae and Cyanophyceae.
The abundance of Chlorophyceae was also
reported by in Yeldari reservoir of Nanded
</div>
<span class='text_page_counter'>(6)</span><div class='page_container' data-page=6>
<i><b>Int.J.Curr.Microbiol.App.Sci </b></i><b>(2017)</b><i><b> 6</b></i><b>(11): 4188-4195 </b>
4193
was dominated by <i>Oscillatoria</i> sp. and
<i>Surirella elegans,</i> <i>Fragilaria capucina</i> and
<i>Spirogyr</i>a sp. respectively the high biomass in
dry season could be the result of higher
temperature and quantity of essential nutrients
(phosphate and nitrate). In the wet season the
abundance of phytoplankton was decreased
that is may be due to low amount of nutrients
and also the entry of the rain water into the
research stations, in the wet months the highly
biomass were found in the Center Check dam
UNPAD 2833.3 cells L-1 and Cikuda River
1554.2 cells L-1 which was dominated by
<i>Merismopedia</i> sp. and <i>Gomphonema</i> sp. and
<i>Fragilaria capucina. </i>
Shannon-Wiener diversity index (H’) were
calculated by using the data on phytoplankton
species and numerical abundance (cell
number). The greater species diversity means
larger food chain and more cases of
inter-specific interactions and greater possibilities
for negative feedback control which reduced
oscillations and hence increases the stability
of the community (Ludwick and Reynold,
1998). Seasonal changes in phytoplankton
cell numbers and diversity indices are shown
in Table 3. The highest values were 1.85 (wet
season in Ciparanje) for Shannon-Wiener
diversity index in wet season (Ciparanje),
when the highest number of species was
determined. The lowest values were 1.08 (H')
in the wet season in Outlet Check dam
UNPAD, when a low number of species and a
high number of individuals were determined,
comparison of diversity in the five sampling
areas in both the wet and dry seasons, Outlet
Check dam UNPAD in the wet season was
found to be least diverse based on the
Shannon-Wiener diversity index (H') (Fig. 3).
In the present study, this index of diversity
(H’) shows a value below to 3 for all stations
during the study period mention in Table 3.
This indicates a low specific structure of these
groups indeed, a low diversity characterizes,
young settlements of species, while a great
diversity indicates mature settlements. The
low diversity shows a weak internal structure
of population (Le Bris and Glemarec, 1995).
Seasonal variation in diversity index (H') of
plankton of Check dam, Cikuda and Ciparanje
during the dry season was ranged from
(1.34-1.84) and during the wet season (1.08-1.85).
The results of this study indicate seasonal
variations in diversity, phytoplankton
diversity is high during the dry season. Many
studies on phytoplankton diversity showed no
direct relationship between nutrient
concentration and abundance. It was shown
that abundance of phytoplankton during the
dry season in waters is negatively correlated
with nutrient concentration (Poliat and Isik,
2002). This is attributed to a depletion of
nutrients as these were utilized by the
phytoplankton for photosynthesis increasing
their population size. The results of this study
however indicate that increase in abundance
during the dry season than in the wet season
can be due to continuous supply of high level
of nutrients in the water as a result of
continuous water run-off from the land and
campus UNPAD that it may contain high
amount of phosphate and nitrate during the
dry months.
<b>Acknowledgments </b>
The authors are grateful to the Dean, College
of Fisheries and Marine Science, Universitas
Padjadjaran, Indonesia, for providing
necessary laboratory facilities and we also
gratefully acknowledge the financial
assistance of University Grant Commissions
awarded by Rector Univeritas Padjadjaran for
supporting this study through ALG project.
<b>References </b>
</div>
<span class='text_page_counter'>(7)</span><div class='page_container' data-page=7>
<i><b>Int.J.Curr.Microbiol.App.Sci </b></i><b>(2017)</b><i><b> 6</b></i><b>(11): 4188-4195 </b>
4194
Gour Nagar, Sagar, India.
APHA., Eaton, A.D., Mary, A. and Franson,
H. (2005) Standard Methods for the
Examination of Water and Wastewater.
American Water Works Association.
Chisti Y. (2007). Biodiesel from microalgae.
Biotechnology Advances. 2007; 25:
294-306.
Devassy V. P. and Goes J. I. (1988)
Phytoplankton community structure and
succession in a tropical estuarine
complex (central west coast of India);
<i>Estuarine, Coastal and ShelfScience </i>27
671–685.
Devassy V. P. and Goes J. I. (1989) Seasonal
patterns of phytoplankton biomass and
productivity in a tropical estuarine
complex (west coast of India);
<i>Proceedings of the Indian</i> <i>Academy of </i>
<i>Sciences (Plant Sciences) </i>99 485–501.
Edmondson WT (1959). Ward and Whipple’s
Freshwater Biology. 2nd Ed. Johan
Wiley & Sons Inc., New York,
pp.1-1248.
Ganai AH, Parveen S, Khan AA, Maryam H
(2010). Phytoplankton diversity at
Watlab Ghat in Wular lake, Kashmir.
Jour. Eco. Nat. Environ. 2(8):140-146.
Kendrim EC (2001). Check list of
phytoplankton of Shedam reservoir in
Plateau state. Nigerian.J. Aquatic Sci.
16:61-66.
Le Bris, H. and Glemarec, M., (1995), Stands
macrozoobenthiques a coastal
ecosystem under-saturated with oxygen:
the Bay of Vilaine (South Brittany),
Oceanologica Acta, 18, pp 573-581.
Lone JA, Kumar A, Kundu S, Lone FA,
Suseela MR. (2013). Characterization of
tolerance limit in Spirulina platensis in
relation to nanoparticles. Water Air Soil
Pollut., 2013; 224:1670-6.
Lone, J. A., Lone, F.A., Suseela, M.R. and
Toppo, K. (2016). Phycological Studies
in Himalayan Dal Lake Ecosystem:
Seasonal Composition and Role of
Physico-chemical parameters.
<i>International </i> <i>Journal </i> <i>of </i> <i>Current </i>
<i>Research</i> Vol. 8, Issue, 05,
pp.30147-30155, May, 2016.
Ludwik JA, Reynolds JF (1998). Statistical
ecology a primer on methods and
computing A Wiley-Interscience
publication. New York, 1998; 1-337.
Malik DS, Bharti Umesh (2012). Status of
plankton diversity and biological
productivity of Sahastradhara stream at
Uttarakhand, India J. Appl. Nat. Sci.
2012; 4(1):96-103.
Millman M, Cherrier C, Ramastack J (2005).
The seasonal succession of the
phytoplankton community in Ada
Hayden lake, North Basin, Ames,
Lowa. Limnology laboratory, Lowa
state university, Ames, Lowa.
Pawar SK, Pulle JS, Shendge KM. (2006).
The study on phytoplankton of
Pethwadaj Dam, Taluka Kandhar,
District Nanded, Maharashtra. J. of
Aquat. Biol. 21(1):6-7.
Pieterse AJH, Van Zyl JM (1988).
Observation on the relation between
phytoplankton diversity and
environmental factors in the vaal river
at balkfontien, South Africa.
Hydrobiologia 169:199-207.
Polat, S. and Işık, O. (2002). Phytoplankton
distribution, diversity and nutrients at
the northeastern Mediterranean coast of
Turkey (Karataş-Adana). Turk. J.
Botany 26: 77-86.
Pongswat, S., Thammathaworn, S.,
Peerapornpisal, Y., Thanee, N. and
Somsiri, C. (2004). Diversity of
phytoplankton in the Rama IX lake, a
manmade lake, Pathumthani province,
Thailand. Science Asia, 30: 261-267.
Senthilkumar R, Sivakumar K (2008). Studies
</div>
<!--links-->
Cải cách trong quản trị trường đại học công lập nhằm nâng cao chất lượng đào tạo: những điều việt nam có thể học hỏi từ thực tiễn trên thế giới
- 48
- 975
- 4


.push({});</script> </div> </div> </div> <div class="vf_link_relate px-2 my-2"> <h2 class="vf_doc_relate text-2xl font-bold my-4">Tài liệu liên quan</h2> <ul class="grid grid-cols-12 gap-2"> <li class="col-span-6 md:col-span-2"> <div class="card-doc " onclick="actionDocRelated(this)"> <a class="card-doc-img" href="https://text.123docz.net/document/140852-cai-cach-trong-quan-tri-truong-dai-hoc-cong-lap-nham-nang-cao-chat-luong-dao-tao-nhung-dieu-viet-nam-co-the-hoc-hoi-tu-thuc-tien-tren-the-gioi.htm" title="Cải cách trong quản trị trường đại học công lập nhằm nâng cao chất lượng đào tạo: những điều việt nam có thể học hỏi từ thực tiễn trên thế giới"> <i class="icon i_type_doc i_type_doc5"></i> <img class="lazy" src="data:image/gif;base64,R0lGODlhAQABAIAAAP///wAAACH5BAEAAAAALAAAAAABAAEAAAICRAEAOw==" data-src="https://media.store123doc.com/images/document/13/nu/hq/medium_kMVBJ9Qf73.jpg" width="124" height="179" alt="Cải cách trong quản trị trường đại học công lập nhằm nâng cao chất lượng đào tạo: những điều việt nam có thể học hỏi từ thực tiễn trên thế giới" onerror="this.src=)