So sánh giá trị các xét nghiệm AMH, AFC và FSH trong dự đoán đáp ứng buồng trứng trên bệnh nhân làm thụ tinh trong ống nghiệm_Tiếng Anh
Bạn đang xem bản rút gọn của tài liệu. Xem và tải ngay bản đầy đủ của tài liệu tại đây (600.08 KB, 23 trang )
<span class='text_page_counter'>(1)</span><div class='page_container' data-page=1>
<b>COMPARISON OF THE VALUE OF AMH, AFC </b>
<b>AND FSH FOR INDENTIFYING </b>
<b>OVARIAN-RESPONSE IN IN-VITRO FERTILIZATION </b>
<b>IN HAI PHONG HOSPITAL </b>
<b>OF OBSTETRICS AND GYNECOLOGY </b>
</div>
<span class='text_page_counter'>(2)</span><div class='page_container' data-page=2>
<b>Ovarian response </b>
<b>Ovarian response </b> <b>Oocytes retrieved </b>
<b>Poor </b> <b>< 4 oocytes </b>
<b>Normal </b> <b>5 - 15 oocytes </b>
<b>High </b> <b>> 15 oocytes </b>
</div>
<span class='text_page_counter'>(3)</span><div class='page_container' data-page=3>
<b>Ovarian reserve </b>
<b>Ovarian reserve </b> <b>refers </b> <b>to </b> <b>a </b> <b>woman’s </b>
<b>reproductive potential, reflected as the </b>
<b>quantity and quality of the ovarian follicle </b>
<b>pool at any given time. </b>
</div>
<span class='text_page_counter'>(4)</span><div class='page_container' data-page=4>
<b>Ovarian reserve makers </b>
<b>Basal follicile stimulating hormon </b>
<b>Antral follicle count </b>
<b>AMH </b>
</div>
<span class='text_page_counter'>(5)</span><div class='page_container' data-page=5>
<b>Basal follicile stimulating hormon </b>
<b> - Measured on day 2-3 of the menstrual cycle </b>
<b> - An increase in FSH leves occurrsdue to </b>
<b>follicle depletion </b>
<b>AFC </b>
<b> - AFC are measured by transvaginal </b>
<b>ultrasonography in the early follicular phase </b>
<b> - Predicting both poor and hyper ovarian </b>
<b>response </b>
</div>
<span class='text_page_counter'>(6)</span><div class='page_container' data-page=6>
<b>AMH </b>
<b>- AMH(anti mullerian </b>
<b>hormone ) is a </b>
<b>glycoprotein </b>
<b>hormone. </b>
<b>- AMH reflects the </b>
<b>continued growth </b>
<b>of small follicles </b>
</div>
<span class='text_page_counter'>(7)</span><div class='page_container' data-page=7>
<b> - An AMH test can be done at any time in the </b>
<b>menstrual cycle </b>
<b> - AMH levels decline with age. </b>
<b> - AMH levels are not influenced by birth control pills </b>
<b>or GnRH agonists </b>
<b> - Predicting both poor and hyper ovarian response </b>
</div>
<span class='text_page_counter'>(8)</span><div class='page_container' data-page=8>
<b>Objectives </b>
</div>
<span class='text_page_counter'>(9)</span><div class='page_container' data-page=9>
<b>Patients & Methods </b>
<b>- A prospective study was conducted 507 </b>
<b>patients in Haiphong hospital of obstetrics </b>
<b>and gynecology from 1/2017 to 1/2018. </b>
</div>
<span class='text_page_counter'>(10)</span><div class='page_container' data-page=10>
<b>Results </b>
<b>Patients’ characteristics </b>
<b>Age </b>
<b>Age (years) </b> <b>n </b> <b>% </b>
<b>≤ 25 </b> <b>41 </b> <b>8,1 </b>
<b>26 – 30 </b> <b>139 </b> <b>27,4 </b>
<b>31 – 35 </b> <b>196 </b> <b>38,7 </b>
<b>>35 </b> <b>131 </b> <b>25,8 </b>
<b>Sum </b> <b><sub>507 </sub></b> <b>100 </b>
<b>Mean ± SD ( Min – Max ) 32.58 ± 5.03 (19 – 48) </b>
</div>
<span class='text_page_counter'>(11)</span><div class='page_container' data-page=11>
<b>Type of infertility </b>
<b>Type of infertility </b> <b>n </b> <b>% </b>
<b>Primary </b> <b>233 </b> <b>46 </b>
<b>Secondary </b> <b>274 </b> <b>54 </b>
<b>Sum </b> <b>507 </b> <b>100% </b>
</div>
<span class='text_page_counter'>(12)</span><div class='page_container' data-page=12>
<b>Duration of infertility </b>
<b>Duration of infertility (years) </b> <b>n </b> <b>% </b>
<b><5 </b> <b>315 </b> <b>62.1 </b>
<b>5 – 10 </b> <b>175 </b> <b>34.5 </b>
<b>>10 </b> <b>17 </b> <b>3.4 </b>
<b>Sum </b> <b><sub>507 </sub></b> <b>100 </b>
<b>Mean ± SD ( Min – Max ) 4,25 ± 3,09 (1 – 20 ) </b>
</div>
<span class='text_page_counter'>(13)</span><div class='page_container' data-page=13>
<b>Results</b>
<b>Indication for IVF </b>
<b>Indication </b> <b>n </b> <b>% </b>
<b>Male factor </b> <b>192 </b> <b>37.9 </b>
<b>Tubor factor </b> <b>112 </b> <b>22.1 </b>
<b>Ovulation disorder </b> <b>15 </b> <b>3 </b>
<b>Both male and female factor </b> <b>41 </b> <b>8.1 </b>
<b>Endometriosis </b> <b>29 </b> <b>5.7 </b>
<b>Others </b> <b>118 </b> <b>23.3 </b>
</div>
<span class='text_page_counter'>(14)</span><div class='page_container' data-page=14>
<b>Ovarian response </b>
<b>14,40% </b>
<b>67,90% </b>
<b>17,70% </b>
</div>
<span class='text_page_counter'>(15)</span><div class='page_container' data-page=15>
<b>Correlations between markers and retrieved oocytes </b>
<b>Markers </b> <b>R </b> <b>P </b>
<b>AMH </b> <b>0,7 </b> <b>< 0,01 </b>
<b>AFC </b> <b>0,6 </b> <b>< 0,01 </b>
<b>FSH </b> <b>- 0,26 </b> <b>< 0,01 </b>
</div>
<span class='text_page_counter'>(16)</span><div class='page_container' data-page=16>
<b>Comparison of the value of amh, afc and fsh </b>
<b>for indentifying poor ovarian-response </b>
<b>Markers </b> <b>AUC (95%CI) </b> <b>p </b>
<b>AMH </b> <b>0.88 </b>
<b>(0.84 – 0.92) </b>
<b>< 0,01 </b>
<b>AFC </b> <b>0.85 </b>
<b>(0,8 -0,9) </b>
<b>FSH </b> <b>0.69 </b>
<b>(0,62 – 0,76) </b>
</div>
<span class='text_page_counter'>(17)</span><div class='page_container' data-page=17>
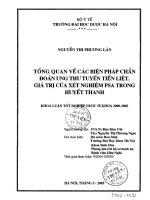
<b>ROC curves for AMH, FSH, AFC for </b>
<b>prediction of poor ovarian response </b>
0
20
40
60
80
100
</div>
<span class='text_page_counter'>(18)</span><div class='page_container' data-page=18>
<b>Performance of AMH, FSH and AFC values in </b>
<b>predicting poor avarion response </b>
<b>Markers </b> <b>Cut-off values </b> <b>Sensitivity </b> <b>Specificity </b>
<b>AMH </b> <b>1,31 ng/ml </b> <b>74% </b> <b>86,9% </b>
<b>AFC </b> <b>< 8 oocytes </b> <b>74% </b> <b>79,5% </b>
<b>FSH </b> <b>7.07 IU/L </b> <b>67,1% </b> <b>68,7% </b>
</div>
<span class='text_page_counter'>(19)</span><div class='page_container' data-page=19>
<b>Comparison of the value of amh, afc and fsh for </b>
<b>indentifying high ovarian-response </b>
<b>Markers </b> <b>AUC(95%CI) </b> <b>P </b>
<b>AMH </b> <b>0.85 </b>
<b>(0.81 – 0.88) </b>
<b>< 0,01 </b>
<b>AFC </b> <b>0.83 </b>
<b>(0,78 -0,87) </b>
<b>FSH </b> <b>0.64 </b>
<b>(0,59–0,71) </b>
</div>
<span class='text_page_counter'>(20)</span><div class='page_container' data-page=20>
<b>ROC curves for AMH, FSH, AFC for prediction of high </b>
<b>ovarian response </b>
0
20
40
60
80
100
</div>
<span class='text_page_counter'>(21)</span><div class='page_container' data-page=21>
<b>Performance of AMH, FSH and AFC values in </b>
<b>predicting high ovarion response </b>
<b>Makers </b> <b>Cut-off </b>
<b>values </b> <b>Sensitivity </b> <b>Specificity </b>
<b>AMH </b> <b>3.31 ng/ml </b> <b>85,6% </b> <b>71,9% </b>
<b>AFC </b> <b>> 12 oocytes </b> <b>81,1% </b> <b>64,3% </b>
<b>FSH </b> <b>5,72 IU/L </b> <b>52,2% </b> <b>70,3% </b>
</div>
<span class='text_page_counter'>(22)</span><div class='page_container' data-page=22>
<b>Conclusions </b>
<b>AMH test has the best predictive value for predicting both </b>
<b>poor and high ovarian response, followed by AFC and </b>
<b>FSH. </b>
<b>AMH </b> <b>≤ 1.31 ng/ml (Sen: 74%, Spec: 86.9%), AFC < 8 </b>
<b>oocytes( Sen 74% and Spec 79,5%), FSH ≥ 7.07IU/L (Sen </b>
<b>67.1% and Spec: 68.7%) predicted poor-response. </b>
</div>
<span class='text_page_counter'>(23)</span><div class='page_container' data-page=23></div>
<!--links-->