Utilizing remote sensing data for assessing the effect of land use changes on urban heat island in taipei city
Bạn đang xem bản rút gọn của tài liệu. Xem và tải ngay bản đầy đủ của tài liệu tại đây (934.46 KB, 51 trang )
THAI NGUYEN UNIVERSITY
UNIVERSITY OF AGRICULTURAL AND FORESTRY
NGUYEN TRUNG ANH
UTILIZING REMOTE SENSING DATA FOR ASSESSING THE EFFECT OF
LAND USE CHANGES ON URBAN HEAT ISLAND IN TAIPEI CITY
BACHELOR THESIS
Study Mode
: Full - Time
Major
: Environmental Science and Management
Faculty
: International Training and Development Center
Batch
: K43 – AEP
THAI NGUYEN - 30/09/2015
i
Thai Nguyen University of Agriculture and Forestry
Degree program
Bachelor of Environmental Science and Management
Full name
NGUYEN TRUNG ANH
Student ID
DTN1153110166
Thesis title
Supervisor
Utilizing remote sensing data for assessing the effect of land
use changes on Urban Heat Island in Taipei City.
Assoc. Prof. Tang-Huang Lin and Assoc. Prof. Nguyen The
Hung
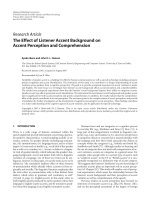
ABSTRACT
Land surface temperature (LST) is an important parameter to human living
environment and the pattern of regional weather. The changes of LST might be caused
from seasonal variation, weather patterns as well as land cover and land use (LCLU)
alterations. For the urban area, the type of LCLU according to urban development
could increase LST thus enhanced the urban heat island (UHI) effect.
Taipei City has urbanized rapidly since 1967, and urban warming appeared from
1980s. The effects of urbanization on local weather and climate change resulted in a
remarkable increase in mean and minimum temperatures. However, urbanization
resulted in little change in maximum temperature in Taipei City. The increase in
minimum temperature in summer is significant in Taipei City
The frame work of national land surface temperature is presented with remote
sensing data. The proposed system uses the features of existing widely used
classification approaches that are amenable to data derived from remote sensing
sources.
Keywords
Taipei, Taiwan, Land surface temperature, Urbanization,
Land cover change, Remote sensing;
Number of pages
47
Date of submission
September 30, 2015
i
ACKNOWLEDGEMENT
First and foremost, we wish to express our sincere thanks to Center for Space
and Remote Sensing Research (CSRSR) of National Central University (NCU) for
providing us all the necessary facilities and all the students who help me the scientific
knowledge to complete this thesis. In particular, we would like to thank our principal
research adviser Assoc. Prof. Tang-Huang Lin and Assoc. Prof. Nguyen The Hung
guided me wholeheartedly when we implement this thesis.
With qualifications, experience and time is limited to topics inevitable
shortcomings. I would like to receive the only protection, input of teachers so that I
can complete your project.
I also want to say thank to International Training and Development Center –
Thai Nguyen University of Agriculture and Forestry which has facilitated me the
chance to come here to study and get more knowledge exchange.
Finally yet important, i take this opportunity to express our deepest appreciation
to our families, relatives, friends who encouraged and supported us unceasingly and all
who directly or indirectly, have lent their helping hand in this venture.
Thank you very much!
Thai Nguyen September 30, 2015
Author
Nguyen Trung Anh
ii
TABLE OF CONTENTS
LIST OF FIGURES ........................................................................................................ 1
LIST OF TABLES ......................................................................................................... 2
LIST OF ABBREVIATIONS ........................................................................................ 3
PART I. INTRODUCTION ........................................................................................... 4
1.1. Background ..................................................................................................... 4
1.2. The purpose of thesis ...................................................................................... 6
1.3. The significant of thesis. ................................................................................. 6
PART II. LITERATURE REVIEW ............................................................................... 7
2.1.Theoretical basis .............................................................................................. 7
2.1.1. Satellite data (images) .................................................................................. 7
2.1.2. Definitions of land surface temperature ...................................................... 9
2.1.3. The land cover types .................................................................................. 11
2.2 Geographic information systems ................................................................... 12
2.2.1. Definition .................................................................................................. 12
2.2.2. GIS Application Areas. ............................................................................. 13
2.3.1. Definition. .................................................................................................. 14
2.3.2. Basics of EMR/Atmospheric Affects Foundations of Remote Sensing ... 14
2.3.3. Applications of Remote Sensing Technology ......................................... 15
2.4. Practical basis .............................................................................................. 16
2.4.1. The research on land surface temperature in the world ............................ 16
2.4.2. The research on land surface temperature in Viet Nam ........................... 18
PART III. METHODOLOGY ...................................................................................... 20
iii
3.1. The objects of research ................................................................................. 20
3.2. Location and research time. .......................................................................... 20
3.3. Research content. .......................................................................................... 20
3.4. Methods ........................................................................................................ 20
3.4.1. Collecting and selecting data. .................................................................... 20
3.4.2 Describes methods of calculation FAR, BCR, UHI intensity .................... 21
PART IV. RESULTS ................................................................................................... 24
4.1. The natural conditions and socioeconomic in study area ............................. 24
4.1.1. Natural conditions ...................................................................................... 24
4.1.2 Probabilistic risk analyses ........................................................................... 29
4.1.3 Economic .................................................................................................... 30
4.1.4 Education .................................................................................................... 30
4.2. Process of determining land surface temperature, land cover and land use
and their interaction ...................................................................................................... 33
4.2.1. Pre-Processing .......................................................................................... 33
4.3. Results from determining land surface temperature, land cover and land use
and their interaction ...................................................................................................... 34
4.3.1. Brightness temperature map ...................................................................... 34
4.3.2. Floor Area Ratio (FAR) and Building coverage ratio ............................... 35
PART V. DISCUSSION AND CONCLUSION .......................................................... 41
5.1. Discussion ..................................................................................................... 41
5.2. Conclusion .................................................................................................... 42
iv
LIST OF FIGURES
Figure 2.1. Process of landsat data .................................................................................8
Figure 2.2. Land cover mapping of the global .............................................................. 12
Figure 3.1. The land surface temperature process .........................................................21
Figure 3.2. Flow chart of land surface temperature ......................................................23
Firgure 4.1. The map of Taipei City ..............................................................................25
Figure 4.2. Map of location and geographic environment of Taipei City. ....................26
Figure 4.3. Estimate of affected population under various rainfall intensities in Shilin
District of Taipei City ....................................................................................................29
Figure 4.4. Population growth of Taipei City and neighboring areas, and floor area
increase of newly constructed houses (1945–2009). Source: Taiwan City Statistical
Year Book 2010 and Banciao City Household Registration Office, Taipei County.....31
Figure 4.5. Data pre – Processing ..................................................................................33
Figure 4.6. Process of landsat data into indicators of land surface temperature (UHII)
and land cover and land use (BCR and FAR) ............................................................... 34
Figure 4.7. Brightness temperature map........................................................................34
Figure 4.8. Floor Area Ratio (FAR) ..............................................................................35
Figure 4.9. Building Coverage Ratio (BCR) .................................................................36
Figure 4.10. Relationship between BCR and UHII .......................................................38
Figure 4.11. Relationship between FAR and UHII .......................................................38
1
LIST OF TABLES
Table 4.1. Satellite image ................................................................................................9
Table 4.2. Statistics on Land and Climate for Taipei City ............................................32
2
LIST OF ABBREVIATIONS
BCR
Building Coverage Ratio
FAR
Floor Area Ratio
GIS
Geographic Information Systems
LCCS
Land Cover Classification System
LST
Land surface temperature
RS
Remote sensing
TIR
Thermal infrared
UHI
Urban Heat Island
UHII
Urban Heat Island Intensity
TOA
Top of Atmospheric
TB
Brightness temperature
OLI
Operational Land Imager
NDVI
Normalized Difference Vegetation Index
FVC
Fracting of Vegetation
LCLU
Land Cover and Land use
3
PART I. INTRODUCTION
1.1. Background
Land surface temperature is how hot the “surface” of the Earth would feel to the
touch in a particular location. From a satellite’s point of view, the “surface” is
whatever it sees when it looks through the atmosphere to the ground. It could be snow
and ice, the grass on a lawn, the roof of a building, or the leaves in the canopy of a
forest. Thus, land surface temperature is not the same as the spatial uniformity of air
temperature that is included in the daily weather report.
It becomes more important to monitor land surface temperature because the
warmth rising off Earth’s landscapes influences (and is influenced by) our world’s
weather and climate patterns. Scientists want to understand how increasing
atmospheric greenhouse gases affect land surface temperature, and how rising land
surface temperatures affect glaciers, ice sheets, permafrost, and the vegetation in
Earth’s ecosystems.
Commercial farmers may also use land surface temperature maps like these to
evaluate water requirements for their crops during the summer, when they are prone to
heat stress. Conversely, in winter, these maps can help citrus farmers to determine
where and when orange groves could have been exposed to damaging frost.
Land surface temperature (LST) is one of the key parameters in the physics of
land surface processes from local through global scales. The importance of LST is
being increasingly recognized and there is a strong interest in developing
methodologies to measure LST from space. However, retrieving LST is still a
challenging task since the LST retrieval problem is ill-posed. This paper reviews the
4
current status of selected remote sensing algorithms for estimating LST from thermal
infrared (TIR) data. A brief theoretical background of the subject is presented along
with a survey of the algorithms employed for obtaining LST from space-based TIR
measurements. The discussion focuses on TIR data acquired from polar-orbiting
satellites because of their widespread use, global applicability and higher spatial
resolution compared to geostationary satellites. The theoretical framework and
methodologies used to derive the LST from the data are reviewed followed by the
methodologies for validating satellite-derived LST. Directions for future research to
improve the accuracy of satellite-derived LST are then suggested.
Taipei City is located in a subtropical basin. Because of the unique landforms of
the geological basin in this typhoon area, the typhoon-fed floods are enormous in these
areas. In a recent study, Wang et al. (2008) documented that a strong warming trend in
the Taipei basin (two times higher than the world average) was observed in the period
from 1897 to 2006, which accelerated after 1980. The UHI intensity of the Taipei
basin reveals an increasing trend with a monthly average of 0.011°C during 1994–
2006, and during 2002–2006, the UHI anomalies show the most significant increases.
However, the nocturnal and diurnal UHI phenomenon were not described in those
previous studies, due to the lack of detailed record from an adequate network of
observations in the city. So i want to do about:'' Utilizing Remote Sensing data for
assessing the effect of land surface temperature changes on Urban Heat Island in
Taipei City''
5
1.2 The purpose of thesis
- Use remote sensing data for mapping Urban Heat Island Intensity and its
variation over time.
- Find out the natural conditions and situation of socio - economic in recent
years of Taipei City.
- To assess the change of land surface temperature with LCLU change
accordingly.
1.3 The significant of thesis.
- Thesis will be the bridge between knowledge studying and practices, the
access to reality to better understand the nature of the problem.
- Through the thesis I knew how to do GIS software to mapping data and
analyzing data and practice.
- Doing the thesis is the basis for the selection and application of GIS software
for assessing the effect of land surface temperature changes on Urban Heat Island in
Taipei City.
The actual meaning:
- The completed research will help people to understand the natural conditions,
the development of economy and society in recent years of Taipei City.
- Helped people gain knowledge about assessing the impact of land surface
temperatures changed in Taipei City in particular, as well as other cities in Vietnam in
general.
6
PART II. LITERATURE REVIEW
2.1. Theoretical basis
2.1.1. Satellite data (images)
Introduce Landsat image:
Satellite- data based thermal infrared (TIR) data is directly linked to the LST
through the radiative transfer equation. The retrieval of the LST from remotely sensed
TIR data has attracted much attention, and its history dates back to the 1970s
(McMillin, 1975). To better understand the Earth system at the regional scale and to
get the evapotranspiration with an accuracy better than 10%, LST must be retrieved at
an accuracy of 1 K or better (Kustas and Norman, 1996; Moran and Jackson,
1991 ; Wan and Dozier, 1996).
Five LANDSAT satellites have been successfully launched commencing with
LANDSAT 1 in July 1972. All 5 satellites have operated from a repetitive, circular,
sun-synchronous, near-polar orbit and on each day-s
ide pass, scan a ground swath
185km wide beneath the satellite. The first three satellites carried the Multispectral
Scanner (MSS) as the main imaging instrument with a Return Beam Videocon (RBV)
as a subsidiary. The paths of these satellites were inclined 99 degrees with an 18 day
repeat cycle and an equatorial crossing of between 8:50 and 9:30am local time. The
last two satellites (LANDSATs 4-5) had the Thematic Mapper (TM) sensor as well as
the MSS, are inclined 98 degrees, have a repeat cycle of 16 days and have an
equatorial crossing of 9:45am local time. The nominal altitude of the satellites was
920km for LANDSATs 1-3 and 705km for LANDSATs 4-5.
The RBV system on LANDSAT 1-2 consisted of three cameras which took
simultaneous images of the earth in different spectral bands. The area covered was
similar to the MSS images. LANDSAT 6 was to represent a departure from the earlier
7
satellites with an enhanced Thematic Mapper and no MSS. Unfortunately this satellite,
launched in early 1993, and was lost on launch without any backup.
The next satellite in the LANDSAT series will be LANDSAT 7 and is likely to
be a joint project between NASA, NOAA and the USGS. The prime instrument on
board the satellite will be the Enhanced Thematic Mapper (ETM+). This instrument
has a similar 7 bands multispectral capability as the LANDSATs 4-5 but with a 15
meter resolution panchromatic band (0.5 to 0.9 micrometers, visible green to near IR),
which is co-registered with the multispectral data. The ETM+ will be capable of
collecting 250 day-lit, land mass scenes per day and transmitting these scenes to
ground stations via a 150Mbps X-band link. The spacecraft will also have 375GB of
solid state memory, sufficient for 100 ETM+ scenes, for delayed transmission.
Landsat 7 is not expected to be launched until 1998.
Landsat Data
(Multi – spectral & tempora
Infrared
visible
Brightness
Temperature
Land cover
Classification
Remote
Sensing
Imagery
Brightness
Temperature
Land cover
Classification
Emission Characteristics
Of Land Cover Type
Interation between
UHI & ISA
Figure 2.1: Process of landsat data
8
Table 2.1 Satellite image
Landsat 5
TM
Band 6
1991/08/26
Landsat 7
ETM+
Band 6
2002/08/16
Landsat 5
TM
Band 6
2005/09/17
Landsat 5
TM
Band 6
2007/07/21
2.1.2. Definitions of land surface temperature
2.1.1.1. Land surface temperature
As the direct driving force in the exchange of long-wave radiation and turbulent
heat fluxes at the surface–atmosphere interface, land surface temperature (LST) is one
of the most important parameters in the physical processes of surface energy and water
balance at local through global scales (Anderson, 2008; Brunsell and Gillies,
2003,Karnieli, 2010; Kustas and Anderson, 2009 and Zhang, 2008). Land Surface
Temperature (LST) is the radioactive skin temperature over land. LST plays an
important role in the physics of land surface as it is involved in the processes of energy
and water exchange with the atmosphere. LST is useful for the scientific community,
namely for those dealing with meteorological and climate models. Accurate values of
LST are also of special interest in a wide range of areas related to land surface
processes, including meteorology, hydrology, agro meteorology, climatology and
environmental studies. Land Surface Emissivity (EM), a crucial parameter for LST
retrieval from space, is independently estimated as a function of (satellite derived)
Fraction of Vegetation Cover (FVC) and land cover classification.
9
Land surface temperature (LST) is an important parameter highly responsive to
surface energy fluxes and has become valuable to many disciplines. Prior to the advent
of satellites, it was difficult to obtain LSTs over extensive areas. Even today, as a
result of the resolution tradeoffs involved in using satellite data, it is difficult, and
sometimes impossible, to acquire satellite LSTs with high spatial and temporal
resolutions. This low resolution results in a thermal mixture effect, where the
resolution cells are larger than the thermal elements.
Land Surface Temperature (LST) is the radioactive skin temperature of the land
derived from solar radiation. A simplified definition would be how hot the "surface" of
the Earth would feel to the touch in a particular location. From a satellite's point of
view, the "surface" is whatever it sees when it looks through the atmosphere to the
ground. It could be snow and ice, the grass on a lawn, the roof of a building or the
leaves in the canopy of a forest. Land surface temperature is not the same as the air
temperature that is included in the daily weather report.
LST is a basic determinant of the terrestrial thermal behavior, as it controls the
effective radiating temperature of the Earth's surface. However, because of the extreme
heterogeneity of most natural land surface, this parameter is difficult to estimate and
validate. Several factors can fundamentally influence the derivation of LST including:
- Temperature variations with angles
- Sub-pixel in-homogeneities in temperature and cover
- Surface spectral emissivity at the channel wavelengths
- Atmospheric temperature and humidity variations
- Clouds and large aerosol particles such as dust.
10
2.1.1.2. The current state of land surface temperatures in the city Taipei.
Taipei is the political, economic, educational, and cultural center of Taiwan.
Urban thermal environments were complex systems, and the formations were
influenced by many factors. Nevertheless, when analyze development-related thermal
environment changes that compare surface temperatures of thermal environment
before and after land development. Taipei city Taiwan for example, we analyzed the
data of remote thermal sensor from the satellite images, to calculate the difference of
surface temperatures between the undeveloped status in 1990 and developed status in
2009. It showed urban temperature would increase 0.08∼2.39 °C due to anthropogenic
heat emission.
2.1.3. The land cover types
The definition of land cover is fundamental, because in many existing
classifications and legends it is confused with land use(M. C. Hansen, 2000, E.
Bartholomé, 2005, Peng Gong, 2013) It is defined as:
Land cover is the observed (bio) physical cover on the earth's surface. When
considering land cover in a very pure and strict sense it should be confined to describe
vegetation and man-made features. Consequently, areas where the surface consists of
bare rock or bare soil are describing land itself rather than land cover. Also, it is
disputable whether water surfaces are real land cover. However, in practice, the
scientific community usually describes those aspects under the term land cover.
Land use is characterized by the arrangements, activities and inputs people
undertake in a certain land cover type to produce, change or maintain it. Definition of
11
land use in this way establishes a direct link between land cover and the actions of
people in their environment.
The following examples are a further illustration of the above definitions:
"Grassland" is a cover term, while "rangeland" or "tennis court" refer to the use
of a grass cover.
"Recreation area" is a land use term that may be applicable to different land
cover types: for instance sandy surfaces like a beach; a built-up area like a pleasure
park; woodlands; etc.
Figure 2.2. Land cover mapping of the global
2.2 Geographic information systems
2.2.1 Definition
A Geographic Information System or GIS is a computer system that allows you
to map, model, query, and analyze large quantities of data within a single database
12
according to their location disseminating information about areas of the earth. (Dueker
and Kjerne 1989, pp. 7-8). GIS gives you the power to:
GIS is a tool used by individuals and organizations, schools, governments, and
businesses seeking innovative ways to solve their problems9 and others emphasize
applications such as decision support (Maguire 1991; Chrisman 1999).
. GIS stores information about the world as a collection of layers that can be
linked together by a common locational component such as latitude and longitude, a
postal zip code, census tract name, or road name. These geographic references allow
you to locate features on the earth's surface for analysis of patterns and trends. Dozens
of map layers can be arrayed to display information about transportation networks,
hydrography, population characteristics, economic activity, and political jurisdictions.
2.2.2 GIS Application Areas.
GIS are now used extensively in government, business, and research for a wide
range of applications including environmental resource analysis, land use planning,
locational analysis, tax appraisal, utility and infrastructure planning, real estate analysis,
marketing and demographic analysis, habitat studies, and archaeological analysis.
One of the first major areas of application was in natural resources management,
including management of
wildlife habitat,
wild and scenic rivers,
recreation resources,
floodplains,
wetlands,
13
agricultural lands,
aquifers,
Forests.
2.3 Remote Sensing
2.3.1 Definition.
Remote sensing is the use of various technologies to make observations and
measurements at a target that is usually at a distance or on a scale beyond those
observable to the naked eye (Davis, S. M.; Landgrebe, D. A.; Phillips, T. L.; Swain, P.
H.; Hoffer, R. M.; Lindenlaub, J. C.; Silva, L. F.New York, McGraw-Hill International
Book Co., 1978. 405 p).
Remote sensing technologies include: LiDAR, radar, infrared radiation (IR),
thermal, seismic, sonar, electric field sensing and GPS. Depending on what is being
detected, these various sensors might be mounted to a satellite, airplane, boat,
submarine or UAV drone or from another convenient observation point such as a
building top (Remote sensing. 1978 pp. 426 pp.)
The data gathered by remote sensing is used for a large and growing number of
applications including cartography, resource exploration, atmospheric chemical
measurements, healthcare monitoring, surveillance, navigation and GPS tracking.
Remote sensing is one of the basic enabling technologies for the Internet of
Things (IoT), in which almost any imaginable entity can be equipped with unique
identifiers and the ability to transfer data over a network autonomously.
2.3.2 Basics of EMR/Atmospheric Affects Foundations of Remote Sensing
+) The Electromagnetic Spectrum
14
USGS defines the electromagnetic spectrum in the following manner:
"Electromagnetic radiation is energy propagated through space between electric
and magnetic fields. The electromagnetic spectrum is the extent of that energy ranging
from cosmic rays, gamma rays, X-rays to ultraviolet, visible and infrared radiation
including microwave energy."
+) Electromagnetic Waves
Electromagnetic waves may be classified by frequency or wavelength.
- The velocity of ALL electromagnetic waves is equal to the speed of light "c"
c = 299,792,458 meters per second
*3.28 ft/m*1/5280 mi/ft = 186,234 miles/sec *60 sec/min*60 min/hr =
670,444,951 miles per hour
+) Wave Phenomena Concepts
Electromagnetic waves are generated by hydrogen fusion taking place in the
sun. When the electromagnetic energy encounters anything, even a very tiny object
like a molecule of air or water, one of three reactions will occur. The radiation will
either be reflected off the object, be absorbed by it or it could be transmitted through
because the energy manifested by electromagnetic waves can behave both like a
particle (the proton) and like a wave (the oscillating electric/magnetic fields).
2.3.3 Applications of Remote Sensing Technology
• Agriculture
• Disaster monitoring and mitigation
• Surveying and urban planning
• Water resource management
15
• Environmental monitoring
• National spatial data infrastructure
• Infrastructure development planning and monitoring
• Mineral exploration
• Telecommunication
• Coastal eco-system monitoring
2.4 Practical basis
2.4.1 The research on land surface temperature in the world
Land-surface temperature (LST) is one of the key parameters in the physics of
land-surface processes on regional and global scales, combining the results of all
surface–atmosphere interactions and energy fluxes between the atmosphere and the
ground Mannstein, 1987 and Sellers et al., 1988. One of the most important potential
applications of the LST retrieved from satellite data is to validate and improve the
global
meteorological
model
prediction
after
appropriate
aggregation
and
parameterization Price, 1982 and Diak & Whipple, 1993. Besides its necessity in the
LST retrieval, the surface emissivity can be used to discriminate senescent vegetation
(French, Schmugge, & Kustas, 2000a). The remotely sensed LST has been used in
land cover and land-cover change analysis Ehrlich & Lambin, 1996 and Lambin &
Ehrlich, 1997 and in the production of the Moderate Resolution Imaging
Spectroradiometer (MODIS) land cover product, in estimation and parameterization of
surface fluxes Brutsaert et al., 1993 and French et al., 2000b, and in estimating the
diurnal cycle (Jin & Dickinson, 1999). LST can be also used to monitor drought and
estimate surface soil moisture Feldhake et al., 1996 and McVicar & Jupp, 1998, to
16
evaluate water requirements of wheat (Jackson, Reginato, & Idso, 1977) and to
determine frosts in orange groves (Caselles & Sobrino, 1989).
Remote sensing of sea-surface temperature (SST) has been a primary function
of satellite infrared radiometers since their inception. And starting from 1982, the SST
derived from NOAA Advanced Very High Resolution Radiometer (AVHRR) data has
been included in the high-resolution global SST climatology data set for global change
studies Brown et al., 1991 and Smith & Reynolds, 1998. In comparison, there is no
standard global LST data product derived from satellite remote sensing data even
though the use of thermal–infrared (TIR) measurements for analysis of land
biophysical conditions has been under investigation for more than three decades
(Fuchs & Tanner, 1966) and the AVHRR data have been used to produce LST data in
the development of LST algorithms for two decades. It is well known that simple
extension of the SST methods to LST for AVHRR data would lead to unacceptable
errors Price, 1984 and Becker, 1987 because of the difficulty in cloud detection with
AVHRR data over land (especially for thin cirrus) and the intrinsic difficulties in the
LST retrieval (Wan & Dozier, 1989).
The MODIS (Salomonson, Barnes, Maymon, Montgomery, & Ostrow, 1989)
onboard the first Earth Observing System (EOS) platform (called Terra), which was
successfully launched on December 18, 1999, provides a new opportunity for global
studies of atmosphere, land, and ocean processes King et al., 1992, Justice et al., 1998
and Esaias et al., 1998, and for satellite measurements of global LST. The strengths of
MODIS include its global coverage, high radiometric resolution and dynamic ranges
suitable for atmosphere, land, or ocean studies, and accurate calibration in multiple
17
TIR bands designed for retrievals of SST, LST and atmospheric properties.
Specifically, band 26 will be used to detect cirrus clouds (Gao & Kaufman, 1995),
band 21 for fire detection (Kaufman et al., 1998), all other TIR channels will be used
to retrieve atmospheric temperature and water vapor profiles (Smith, Woolf, &
Schriener, 1985), and TIR bands 20, 22, 23, 29, 31–33 will correct for atmospheric
effects and retrieve surface emissivity and temperature (Wan & Li, 1997). This paper
will present the heritage of LST algorithms, the MODIS LST algorithms, a summary
of performance of MODIS TIR bands and its impact on the accuracy of retrieved LST,
a brief description of the MODIS LST products, and the LST validation results in the
following sections
2.4.2 The research on land surface temperature in Viet Nam
Study of the Impact of Urban Development on Surface Temperature Using
Remote Sensing in Ho Chi Minh City, Southern Vietnam by Tran Thi Van and Ha
Duong Xuan Bao. The case study was carried out in the northern part of Ho Chi Minh
City, which has experienced accelerated urban development since the late 1980s.
Landsat and Aster images were used to calculate variations in urban impervious
surfaces from 1989 to 2006. Thermal bands were processed to obtain radiant surface
temperatures for investigating the urban heat island effect associated with increasing
impervious surfaces, both spatially and temporally. Impacts of urban development on
surface temperature were shown by investigating the surface urban heat island effect
intensity. The results show that the built-up area in the northern part of Ho Chi Minh
City expanded by 6.5 times between 1989 and 2006.
18
Application the MODIS images to monitor the change of land surface
temperature and drought situation in the Mekong Delta by Truong Chi Quang, Tran
Thanh Dan and Huynh Thi Thu Huong. The MODIS data with high temporal
resolution provided by NASA is available in global coverage, enables to research
fluctuation of land surface temperature with multi-temporal and multispectral data. In
this research, we used MOD11A2 (1-km spatial resolutions, 8-day composite) from
2000 to 2010 for initially calculating and assessing fluctuation of Land surface
temperature (LST), Temperature/Vegetation Dryness Index (TVDI) in Mekong River
delta combining agricultural household interview in the study area. The research has
developed a completed process for calculating the Land surface temperature and
Temperature/Vegetation Dryness Index for the Mekong Delta by using MODIS
images. The executed temperature data from this process has high reliability by means
of high correlation with the measured data from meteorological stations. In addition,
the areas with high TVDI corresponded with field survey of current land use at the
same time. These results show that applications of Moderate Resolution Imaging
Spectroradiometer (MODIS) with low spatial resolution (1km) and high temporal
resolution (8 days) to monitor and forecast drought of Mekong Delta is appropriate.
The results will contribute a new approach to resolve the determination of drought
related to climate change at present.
19
PART III. METHODOLOGY
3.1 The objects of research
The applications of remote sensing and GIS software for assessing the effect of
land surface temperature changes on Urban Heat Island in Taipei City
3.2 Location and research time.
The research location in Taipei City, Taiwan.
Time: since March 2015 – June 2015
3.3 Research content.
- Assessing of natural conditions, social economic conditions and social culture
of Taipei City
- Studying how to application of GIS and remote sensing for mapping the land
surface temperature of Taipei city.
- Assessing the change of land surface temperature in comparation with FAR
and BCR?
3.4. Methods
3.4.1. Collecting and selecting data.
- Collecting data related to research area, research object (natural conditions,
socio-economic conditions) from website of Taipei City.
- Collecting the information, data that need to evaluating and mapping Building
Coverage ratio (BCR), Floor Area ratio (FAR), relationship between FAR and BCR,
BCR and and Land surface temperature.
20