first principles calculations of thermodynamic quantities and phase diagrams of high temperature bcc taw and mota alloys
Bạn đang xem bản rút gọn của tài liệu. Xem và tải ngay bản đầy đủ của tài liệu tại đây (458.97 KB, 4 trang )
<span class='text_page_counter'>(1)</span><div class='page_container' data-page=1>
First Principles Calculations of Thermodynamic Quantities and Phase
Diagrams of High Temperature BCC Ta-W and Mo-Ta Alloys
K. Masuda-Jindo
1,a*, Vu Van Hung
2,band P.E.A Turchi
3,c1
Department of Materials Science and Engineering, Tokyo Institute of Technology,
Nagatsuta 4259, Midori-ku, Yokohama 226-8503, Japan
2
Department of Physics, Hanoi National Pedagogic University, km8 Hanoi-Sontay Highway, Hanoi,
Vietnam
3
Lawrence Livermore National laboratory, PO Box 808, L-353 LLNL, Livermore CA 94551 U.S.A.
a
, b , c
Keywords: statistical moment method, cluster variation method, TB-LMTO method, coherent
potential approximation, Ta-W and Mo-Ta alloys
Abstract. The thermodynamic properties of high temperature metals and alloys are studied using
the statistical moment method, going beyond the quasi-harmonic approximations. Including the
power moments of the atomic displacements up to the fourth order, the Helmholtz free energies and
the related thermodynamic quantities are derived explicitly in closed analytic forms. The
configurational entropy term is taken into account by using the tetrahedron cluster approximation of
the cluster variation method (CVM). The energetics of the binary (Ta-W and Mo-Ta) alloys are
treated within the framework of the first-principles TB-LMTO (tight-binding linear muffin tin
orbital) method coupled to CPA (coherent potential approximation) and GPM (generalized
perturbation method). The equilibrium phase diagrams are calculated for the refractory Ta-W and
Mo-Ta bcc alloys.
1. Introduction
The calculations of the thermodynamic quantities and the equilibrium phase diagrams are of
great importance for the purpose of materials designs and developments of high temperature
technological alloys. It is the purpose of the present article to study the thermodynamic quantities of
metals and alloys using the moment method in the quantum statistical mechanics, hereafter referred
to as the statistical moment method (SMM) [1-4]. We firstly derive the Helmholtz free energy
Ψ(V,T), of metals and alloys using the fourth order moment approximation, and then calculate the
thermodynamic quantities, such as the thermal lattice expansions, root mean square atomic
displacements, specific heats, Grüneisen constants and elastic moduli. The application calculations
using the SMM will be done for the high temperature bcc alloys, like Ta-W and Mo-Ta systems.
Recently, much attention has been paid to alloy systems made of refractory metals of columns VB
and VIB of the Periodic Table [5,6], and in particular, Nb, Mo, Ta, and W that display high melting
temperature suitable for space and nuclear applications. In view of this, we calculate the equilibrium
phase diagram of Ta-W and Mo-Ta alloys including the effects of thermal lattice vibrations.
2. Theory
We derive the thermodynamic quantities of metals and alloys, taking into account the higher
(fourth) order anharmonic contributions of the thermal lattice vibrations which goes beyond the
quasi-harmonic (QH) approximation [7]. Within the fourth order moments approximation of the
SMM the free energy of the system is given by
<i>Advanced Materials Research Vols. 26-28 (2007) pp. 205-208</i>
<i>online at </i>
<i>© (2007) Trans Tech Publications, Switzerland</i>
<i>Online available since 2007/10/02</i>
</div>
<span class='text_page_counter'>(2)</span><div class='page_container' data-page=2>
(
)
(
)
(
)
2
2 2 2
0 2 2 1
3
2
2 1 1 2
4
2 coth
3 1 3 coth 1 ,
3 2
2 4 coth coth
coth 1 2 2 1 1 coth
3 2 2
X X X
U N X n e N X X
k
X X X X
X X X X
k
θ
θ γ γ
θ <sub>γ</sub> <sub>γ γ</sub> <sub>γ</sub>
−
Ψ = + <sub></sub> + − <sub></sub>+ <sub></sub> <sub></sub> − <sub></sub> + <sub></sub><sub></sub>
+ <sub></sub> <sub></sub> + <sub></sub>− + <sub></sub> + <sub></sub> + <sub></sub><sub></sub>
l
(1)
where X = hω θ/ 2 , θ being kBT. k and γi are second and fourth order vibrational constants [1-10],
respectively. With the aid of the free energy formula Ψ=E-TS, one can find the thermodynamic
quantities of metals and alloy systems. The specific heats and elastic moduli at temperature T are
directly derived from the free energy Ψ of the system.
The configurational entropies of bcc alloys are calculated using the tetrahedron cluster
approximation of the cluster variation method (CVM) [8,9]. The nearest-neighbour and
next-nearest-neighbour pair probabilities are taken into account in accordance with the effective
pair interaction energies derived from the TB-LMTO-CPA formalism. The entropy expression S (N)
for bcc lattice is given by
( )
(
{ }
)
{
}
{
}
(
) {
(
}
)
(
{
}
)
12
4 3
6
Point
exp .
Ttrh 1 Pr 2 Pr
N
N N
st nd
N N N
S
k <sub>n</sub> <sub>n</sub>
∆
=
(2)
In the present study, we will use the so-called generalized perturbation method (GPM) for the
energetics of the bcc alloys composed of Ta, Mo and W elements [5,6]. Within the GPM, only the
configuration-dependent contribution to the total energy is expressed by an expansion in terms of
effective pairwise and multisite interactions. Then, the ordering contribution to the total energy of
an A-B alloy is given by
{ }
( )
i( )
( )
{ }
in dis ord n
E p =E c + ∆E p , (3)
{ }
(
)
(2) (3), , , , ,
, ,
1 1
2 3
ij i j ijk i j k
ord n nm n m nml n m l
ij ij
n m n m n l m
n m m l n l
E p V c c V c c c
N δ δ N δ δ δ
≠
≠ ≠ ≠
∆ =
∑
+∑
+L<sub>, </sub> <sub>(4) </sub>( ) ( )
1
Im EF ,
ij
s s s ij ij
V dE G Gλµ µλ tλ tµ
λµ
π
= −
<sub>∫</sub>
∑
∆ ∆ K (5)where
i
n
c
δ refers to the fluctuation of concentration on site ni, δcn<sub>i</sub> = pn<sub>i</sub> −c , (c is the
concentration in B species), and pi is an occupation number associated with site ni, equal to 1 or 0
depending on whether or not site ni is occupied by a B species. The ( )<sub>1</sub>, <sub>k</sub>
k
n n
V L corresponds to a
kth-order effective cluster interaction (ECI) involving a cluster of k sites.
3. Results and Discussions
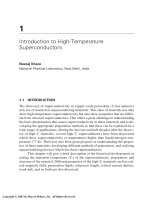
In Fig.1(a) we show the thermal expansion coefficients, αv, of bcc Mo, Ta and W crystals at zero
pressure as a function of temperature T, together with the experimental results [10]. The thermal
expansion coefficients αv of bcc Mo, Ta and W crystals are shown by dot-dashed, solid and dashed
lines, respectively, and they are in good agreement with the corresponding experimental results. In
particular, the calculated thermal expansion coefficients of the bcc Ta crystals are in fairly good
agreement with the experimental results expect for higher temperature region than ~2000K. For this
higher temperature region, experimental results, by symbols ×, show the anomalous increase of the
thermal expansion coefficients as the temperature increases (which might be attributed to the
extrinsic causes such as the oxidiation of the specimen). Instead, the present SMM calculations of
the thermal lattice expansion coefficients of bcc Ta crystal (solid curve) are in good agreement with
the ab initio theoretical calculations of Ref.[11], symbols ○, using the anharmonic PIC (particle in a
cell) model.
<b>Advanced Materials and Processing</b>
</div>
<span class='text_page_counter'>(3)</span><div class='page_container' data-page=3>
Fig.1 a) Thermal lattice expansion coefficients calculated for bcc Mo, Ta (×) and W (▲) crystals.
b) Temperature dependence of root mean square displacements u2<sub>j</sub> (solid lines) and root
mean square relative displacements σ (dashed lines) for bcc Mo, Ta and W crystals. 2<sub>j</sub>
In Fig.1 (b), we present the calculated root mean square atomic displacements u2<sub>j</sub> , by solid
lines, and root mean square relative displacements 2
j
σ , by dashed lines, for bcc Mo, Ta and W
crystals, as a function of the temperature. The relative magnitudes of 2
j
u and 2
j
σ among the
bcc elements are such that u2j <sub>Ta</sub> > u2j <sub>Mo</sub> > u2j <sub>W</sub> and
2 2 2
j <sub>Ta</sub> j <sub>Mo</sub> j <sub>W</sub>
σ > σ > σ . For the lower
temperature region, i.e., T <1500K
% , both
2
j
u and σ2<sub>j</sub> have the linear temperature
dependence, but for higher temperature region, they increase nonlinearly as the temperature
increases. The nonlinear increases of u2<sub>j</sub> and σ2<sub>j</sub> indicate the importance of the
anharmonicity of thermal lattice vibrations in the higher temperature region.
To calculate the thermodynamic quantities and the equilibrium phase diagram of bcc Mo-Ta and
Ta-W alloys, we use the cluster variation method (CVM) [8,9] and the first-principles TB-LMTO
method coupled to the coherent potential approximation (CPA) and the generalized perturbation
method (GPM) [5,6]. We calculate the change in the free energy ∆Ψ(eV/atom) due to the inclusion
of the thermal vibration effects of bcc Mo-Ta and Ta-W bcc alloys as a function of the temperature
T; the concentrations of tantalum are chosen to be 0.0, 0.1, 0.2, 0.25, 0.3, 0.33, 0.4 0.5, 0.6, 0.67,
0.7, 0.8, 0.9 and 1.0. Here, the change in the free energy ∆Ψ corresponds to the ordering (free)
energy defined by "∆Ψ<sub>ord</sub> = Ψ + Ψ<sub>AA</sub> <sub>BB</sub>- 2Ψ " as in the conventional treatments without thermal <sub>AB</sub>
lattice vibration effects.
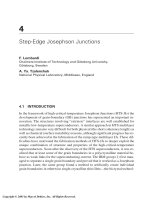
The resulting equilibrium phase diagrams of bcc Ta-W alloys are presented in Fig.2. The dark
circles connected by solid lines in Fig.2(a) represent the phase boundaries between B2 and A2
phases of bcc Ta-W alloys, including the thermal lattice vibration effects (cal-2) while the white
circles connected by dashed lines are the phase boundaries without including the thermal lattice
vibration effects (cal-1) [5,6]. It can be seen in Fig.2(a) that the B2 phases of Ta-W alloys are
stabilized more strongly by including the anharmonicity effects of thermal lattice vibrations at the
higher Ta concentration. The similar tendencies are more prominent for Mo-Ta alloys, as can be
seen in Fig.2(b). This type of theoretical findings is of great interest since the inclusion of the
thermal lattice vibration effects is believed in most cases to destabilize the ordered phases as in the
CuAu alloys [12]. In addition, we have calculated the melting temperatures Tm (critical temperature
of the crystalline stability) of the disordered Mo-Ta and Ta-W alloys using the SMM [1-4], and the
results of melting temperatures Tm of Ta-W and Mo-Ta alloys are presented in Fig.2, in comparison
with the experimental liquidus (dashed line) and solidus (solid line) curves. Although the direct
comparison between the theoretical Tm and experimental liquidus and solidus curves is not possible,
one sees that there are good correlations between the calculation and experimental results.
</div>
<span class='text_page_counter'>(4)</span><div class='page_container' data-page=4>
Fig.2 The calculated equilibrium phase diagram and melting temperatures of Ta-W alloys (a) and
Mo-Ta alloys (b): cal-2 (or cal-1) represents the phase boundaries between B2 and A2 phases,
calculated by including (or not including) the effects of thermal lattice vibrations.
4. Conclusions
We have presented the SMM formalism combined with the CVM and investigated the
thermodynamic properties of high temperature bcc metals and alloys composed of Mo, Ta and W
elements. The linear thermal expansion coefficients, bulk modulus and root-mean-square atomic
displacements are calculated as a function of the temperature as well as a function of the alloy
compositions. The calculated results of the thermodynamic quantities are in good agreement with
the corresponding experimental results. The equilibrium phase diagrams are calculated for bcc
Ta-Mo and Ta-W alloys, including the anharmonicity of thermal lattice vibrations. It has been
shown that the B2 phases of Ta-W alloys are stabilized more strongly by including the
anharmonicity of thermal lattice vibrations for higher Ta concentration region. The similar tendency
has also seen found for Ta-Mo alloys.
References
[1] K. Masuda-Jindo, V. V. Hung and P. D. Tam, Phys. Rev. B67, 094301 (2003)
[2] K. Masuda-Jindo, S. R. Nishitani and V. V. Hung, Phys. Rev. B70, 184122 (2004)
[3] V. V. Hung, K. Masuda-Jindo and P. H. M. Hanh, J. Phys.: Condens. Matter 18, 283 (2006).
[4] V. V. Hung, J. Lee and K. Masuda-Jindo, J. Phys. Chem. Solids, 67, 682 (2006).
[5] P. E. A. Turchi, A. Gonis, V. Drchal and J. Kudrnocsky, Phys. Rev. B64, 085112 (2001)
[6] P. E. A. Turchi, V. Drchal, J. Kudmocský, C. Colinet, Larry Kaufman and Zi-Kui Liu, Phys.
Rev. B71, 094206 (2005)
[7] V. L. Moruzzi, J. F. Janak and K. Schwarz, Phys. Rev. B37, 790 (1988)
[8] R. Kikuchi, Phys, Rev. 81, 988 (1951).
[9] R. Kikuchi and K. Masuda-Jindo, Comp. Mat. Sci. 8, 1 (1997).
[10] Y. S. Touloukian, R. K. Kirby, R. E. Taylor, and P. D. Desai, Thermophysical properties of
Matter ( Thermal Expansion-Metallic Elements and Alloys, Vol. 12) (Plenum Press, New York,
1975).
[11] R. E. Cohen and O. Gülseren, Phys. Rev. B63, 224101 (2001).
[12] T. Horiuchi, S. Takizawa, T. Suzuki and T. Mohri, Metall. Mater. Trans. 26, 11 (1995)
<b>Advanced Materials and Processing</b>
</div>
<!--links-->
<a href=''>written permission of the publisher: Trans Tech Publications Ltd, Switzerland, www.ttp.net</a>