Bài giảng [DOC] Bài tập cá nhân mẫu EN
Bạn đang xem bản rút gọn của tài liệu. Xem và tải ngay bản đầy đủ của tài liệu tại đây (573.21 KB, 11 trang )
INTERNATIONAL MASTER OF BUSINESS PROGRAM
Website: www.griggs.edu.vn Email:
Subject: BUAD555 Decision Science and Statistic for Managers
Class: GaMBA01.C02
Student: Truong Minh Chien, ID # 113408
Final Individual Assessment
TOPIC: APPLIED STATISTIC FOR BUSINESS AND
ORGANIZATION
INTRODUCTION
1 – Background :
Statistics in the business application is the performance of statistics probability theory to the realistic
business environment in order to serve purposes such as collection - data processing, sample surveys,
studies the relationship between phenomena, predict and help the CEO decision-making within the
specific business scene. As we all know in statistics business, it includes descriptive statistics and
statistical inference. Actually, in limited of this article, I only apply statistical inference to solve
problems specific topic request.
2 - Purpose
Applying statistical theory to solve exercises 2.2, 5.16 and 8.3 of the textbook. Since then draw the
lessons of experience and practical help for the operation of Son Trang Ly Limited Company.
3 - Progress
This report is realized bases upon below steps :
i. Understand and gather information
ii. Calculated and solve the Regression Equation
iii. Applied Excel and SPSS version 17
iv. Applied the Estimation Theory in Statistic
v. Draw the plots
1/ 12
INTERNATIONAL MASTER OF BUSINESS PROGRAM
Website: www.griggs.edu.vn Email:
APPLIED STATISTIC AND ESTIMATION THEORY FOR ORGANIZATION
Execercise 2.2 The below information are data on the age of the patients visit the hospital A on
08/20/2008
32 45 53 60 79 73
73 53 61 48 51 49
62 72 37 70 38 66
52 33 78 45 65 47
64 47 61 75 57 64
Request :
a. Stem & Leaf display representing
b. Construct table of frequency distribution and cumulative percentage distribution
c. Draw the frequency plot
d. Comments on the age distribution of patients above
Solve
a. Stem & Leaf display
Frequency Stem & Leaf
2.0 3 . 2 3
2.0 3 . 7 8
6.0 4 . 5 5 7 7 8 9
4.0 5 . 1 2 3 3
1.0 5 . 7
6.0 6 . 0 1 1 2 4 4
2.0 6 . 5 6
4.0 7 . 0 2 3 3
3.0 7 . 5 8 9
Width of Stem : 10.00
Each Leaf includes : 1 case(s).
b. Table of frequency and cumulative frequency
Table 1 Descriptive frequency, percentage table
Age-grade Frequency Percentage (%) Cumulative
frequency
Cumulative Percentage (%)
30-35 2 6.67 2 6.67
35-40 2 6.67 4 13.33
40-45 0 0 4 13.33
45-50 6 20 10 33.33
50-55 4 13.33 14 46.67
55-60 1 3.33 15 50
60-65 6 20 21 70
65-70 4 6.67 23 76.67
70-75 2 13.33 27 90
75-80 3 10 30 100
Total 30 100 / /
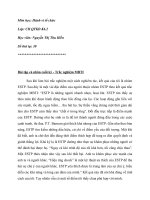
c. Histogram, and other frequency plots
2/ 12
INTERNATIONAL MASTER OF BUSINESS PROGRAM
Website: www.griggs.edu.vn Email:
d. Comments on the age distribution of patients
From the above frequency graph (Frequency Histogram), we easily see the majority of patients visit
the hospital A on 20/8/2008 are greater than 45 years of age and under 65 years old. The amount of
patients under 40 years old and is at least 65 years of patient accounting for a small amount.
Particularly of patients from 45 to 50 years old and the patients age 60 to 65 increased sharply higher.
It shows the hospital A on health care for middle-aged or older and retired people or those who were
too old working age. Basing oneself on above frequency histogram, we can imagine more value-
added services for Hospital A such as life insurance for elderly people or drugs on specific diseases of
the elderly such as heart tonic, hypertension, diabetes doses drugs to increase market power or other
drugs increases the digestibility of etc ...
3/ 12
INTERNATIONAL MASTER OF BUSINESS PROGRAM
Website: www.griggs.edu.vn Email:
Exercise 5.16 The consumer rate of a local product at district A is 60%. After the marketing
campaign believed that the rate has increased. To test this idea, we randomly interviewed 400 people
and has 250 consumers found that product category. With the 0.05 significant make meaningful
conclusions about the comments above.
Solve
The rate of customer consumption of products before advertising campaign is: p
0
= 60% = 0.6
The rate of customer consumption of products after the advertising campaign : p
Set theory: H
0
: p = p
0
= 0.6
H
1
: p ˃ p
0
After implementation of advertising campaigns, the amount consumers are: p
*
= 250/400 = 0.625
= 62.5%
From above equation :
In other hand :
Comments : Because that we accept the theory H
0
: p = p
0
= 0.6, it means after the advertising
campaign that the percentage of customers used the product is less than or equal before advertising
campaign. Thus, the advertising campaign is a failure in district A because after doing the advertisng
campaign that the rate of customer consumption would not rise as expected and tends to decrease
(significant at 5%).
Exercise 8.3 The following data is the number of readers of a local newspaper (thousand person):
Year :
1996 1997 1998 1999 2000 2001 2002 2003 2004 2005 2006 2007
Readers :
53 65 74 85 92 105 120 128 144 158 179 195
Made a Least-Squares Trend Function and forecasts the total readers in 2008 and 2009 with 95%
confident interval.
Solve
Table 2 Readers of the newspaper related to time.
Năm t (time) y (x1000) t.y t
2
t
2
.y t
3
t
3
.y t
4
t
4
.y
1996 1 53 53 1 53 1 53 1 53
1997 2 65 130 4 260 8 520 16 1040
1998 3 74 222 9 666 27 1998 81 5994
1999 4 85 340 16 1360 64 5440 256 21760
2000 5 92 460 25 2300 125 11500 625 57500
2001 6 105 630 36 3780 216 22680 1296 136080
2002 7 120 840 49 5880 343 41160 2401 288120
2003 8 128 1024 64 8192 512 65536 4096 524288
4/ 12
INTERNATIONAL MASTER OF BUSINESS PROGRAM
Website: www.griggs.edu.vn Email:
2004 9 144 1296 81 11664 729 104976 6561 944784
2005 10 158 1580 100 15800 1000 158000 10000 1580000
2006 11 179 1969 121 21659 1331 238249 14641 2620739
2007 12 195 2340 144 28080 1728 336960 20736 4043520
Total 78 1398 10884 650 99694 474552 987072 60710 10223878
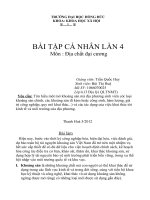
I have graphs show audience of the newspaper in 12 years from 1996 to 2007 as follows:
From table 2 above, we calculate the means value of t and y as follows:
As the graph represented by the function y t above, we easily see t and y is a linear relationship.
Applied Linear-Trend model for with variables y and t, we get :
From above equation, we get :
5/ 12

![Bài giảng [DOC] Bài tập cá nhân mẫu EN](https://media.store123doc.com/images/document/13/ve/bq/medium_NrPuZMN8BK.jpg)
![Bài soạn [DOC] Bài tập cá nhân mẫu VN](https://media.store123doc.com/images/document/13/ve/fq/medium_RmDXvNOExu.jpg)