Câu hỏi GIS, viễn thám, mô hình toán
Bạn đang xem bản rút gọn của tài liệu. Xem và tải ngay bản đầy đủ của tài liệu tại đây (178.47 KB, 2 trang )
<span class='text_page_counter'>(1)</span><div class='page_container' data-page=1>
51
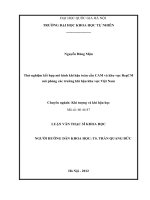
A Simple Model for Atmospheric Carbon Dioxide
The graph to the left shows the 'Keeling Curve' which plots the increase in
atmospheric carbon dioxide between 1958-2005. The average net annual rate is
about 11 gigatons/year. The figure to the right shows a simplified view of the
sources and sinks of the element carbon on Earth. Note that, for every 44
gigatons of the carbon dioxide molecule, there are 12 gigatons of the element
carbon.
<b>Problem 1 - What are the sources of carbon increases to the atmosphere in the </b>
above diagram? What are the sinks of carbon?
<b>Problem 2 - From the values of the sources and sinks, and assuming they are </b>
constant in time, create a simple differential equation that gives the
rate-of-change of atmospheric carbon in gigatons.
<b>Problem 3 - Integrate the equation in Problem 2, assuming that C(2005) = 730 </b>
gigatons, and derive A) the simple equation describing the total amount of carbon
in the atmosphere as a function of time; B) the equation for the total amount of
carbon dioxide.
<b>Problem 4 - What does your model predict for the amount of carbon in the </b>
atmosphere in 2050 if the above source and sink rates remain the same?
<b>Problem 5 - If the current carbon dioxide abundance is 384 ppm, what does your </b>
model predict for the carbon dioxide abundance in 2050?
<b>Problem 6 - Does your answer for the net change in Problem 2 match up with the </b>
Keeling Curve data that indicates a net annual increase of carbon dioxide of +11
gigatons/year?
</div>
<span class='text_page_counter'>(2)</span><div class='page_container' data-page=2>
Answer Key
<b>Problem 1</b> - Answer: The sources of the carbon (arrow pointed into the atmosphere in the
figure) are Vegetation (+119.6 gigatons/yr), oceans (+88 gigatons/yr), human activity (+6.3
gigatons/yr) and changing land use (+1.7 gigatons/yr). The sinks remove carbon (the arrows
pointed down in the figure) and include vegetation (-120 gigatons/yr), oceans (-90 gigatons/yr),
and changing land use (-1.9 gigatons/yr).
<b>Problem 2</b> - From the values of the sources and sinks, and assuming they are constant in
time, create a simple differential equation that gives the rate-of-change of atmospheric carbon
dioxide, C(t), in gigatons.
Answer: dC(t)
--- = + 119 + 88 + 6.3 + 1.7 - 120 -90 - 1.9
dt
so d C(t)
--- = +3.1
dt
<b>Problem 3</b> - Answer: C(t) = 3.1 t + a where a is the constant of integration.
Since C(2005) = 730
730 = 3.1 (2005) + a and so a = -5500
C(t) = 3.1 t - 5500. for the total element carbon.
Since 44 gigatons of carbon dioxide contain 12 gigatons of carbon, the equation for the CO2
increase is 44/12 = 3.7x C(t) so that CO2(t) = 11.5 t - 20,300
<b>Problem 4</b> - What does your model predict for the amount of carbon dioxide in the atmosphere
in 2050 if the above source and sink rates remain the same?
Answer: C(2050) = 3.1 (2050) - 5500
C(2050) = 860 gigatons of carbon.
<b>Problem 5</b> - If the current carbon dioxide abundance is 384 ppm, what does your model
predict for the abundance in 2050? Answer: Since we are interested in the carbon dioxide
increase we use the equation
CO2(t) = 11.4 t - 20,300
For t = 2050 we get CO2(2050) = +3070 gigatons of CO2.
Since 384 ppm corresponds to 730 gigatons of CO2, by a simple proportion, 3275 gigatons
corresponds to 384 ppm x (3070/730) = 1,600 ppm of CO2.
<b>Problem 5</b> - Does your answer for the net change in Problem 2 match up with the Keeling
Curve data that indicates a net annual increase of carbon dioxide 11 gigatons/year?
Answer: Yes. The net change in Problem 2 was +3.1 gigatons/year of the element carbon.
Since for every 44 gigatons of carbon dioxide there are 12 gigatons of the element carbon, we
have + 3.1 x (44/12) = +11.4 gigatons of carbon dioxide increase, which is similar to the
annual average of the increase implied by the Keeling Curve. This means that our simple
model, based on the specified rates, provides a consistent picture of the atmospheric changes.
Note: This simple, linear, model is only valid over the time span of the Keeling Curve.
26
</div>
<!--links-->