Tài liệu Sams Microsoft SQL Server 2008- P7 ppt
Bạn đang xem bản rút gọn của tài liệu. Xem và tải ngay bản đầy đủ của tài liệu tại đây (2.39 MB, 50 trang )
ptg
281
Paging Report (Improved in 2008)
15
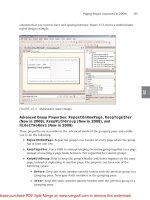
columns that you want to have and spacing between. Figure 15.3 shows a multicolumn
report design example.
Advanced Group Properties: RepeatOnNewPage, KeepTogether
(New in 2008), KeepWithGroup (New in 2008), and
HideIfNoRows (New in 2008)
These properties are accessible in the Advanced mode of the grouping pane and enable
you to do the following:
. RepeatOnNewPage: Repeat the group’s row header on every page where the group
has at least one row.
. KeepTogether: Force SSRS to attempt keeping the entire group together on a page,
instead of inserting a page break between. Not supported for column groups.
. KeepWithGroup: Help to keep the group’s header and footer together on the same
page, instead of orphaning to another page. The property can have one of the
following values:
. Before: Keep this static member (mostly footer) with the previous group in a
grouping pane. Note gray static members in the grouping pane.
. After: Keep this static member (mostly header) with the previous group in a
grouping pane.
FIGURE 15.3
Multicolumn report design.
From the Library of STEPHEN EISEMAN
Please purchase PDF Split-Merge on www.verypdf.com to remove this watermark.
ptg
282
CHAPTER 15 Advanced Report Formatting
. None: Let SSRS decide whether to use
Before
or
After
.
. HideIfNoRows: Hide a static element of a group when the group has no data. This
property overrides other
Visibility
properties.
To access the Advanced mode, display the grouping pane (if not shown, in BIDS select
Report, Grouping), and using the arrow on the right side of the grouping pane select
Advanced Mode, and then select Tablix where you want to set those properties.
Summary
SSRS supports a comprehensive set of formatting capabilities through the report item’s
properties, which control output appearance.
Some of the key properties are as follows:
. BackgroundColor: Controls the background color of the item. When a report
requires alternating colors for rows of output, this property can be used in conjunc-
tion with functions
RowNumber()
and
RunningValue
.
. Color: Controls the color of the text.
. Format: .NET Framework formatting string to apply to the item. The following are
examples of format strings:
.
###.##
formats a value of
012.30
to the output
12.3
.
.
(###)###-####
formats a value of
1234567890
to the output
(123)456-7890
,
which is typical presentation of a phone number.
.
C
formats a value of
1234.56
to a typical presentation of currency
$1,234.56
.
.
yyyy-MM-dd HH:mm
formats
11:59PM
on
1/2/2006
to
2003-01-02 23:59
.
. Language: Controls locale formatting. For example, when set to
English (United
Kingdom)
, the currency sign in formatting changes from
$
to
£
.
. PageBreak, KeepTogether, and KeepWithGroup: Control pagination before and
after an item.
. PageHeight and PageWidth: Control physical page sizing for PDF- and Image-
rendering extensions.
. RepeatOnNewPage and HideIfNoRows: Control the behavior of a group’s header
(footer) and visibility of a group when it has no rows.
. InteractiveHeight and InteractiveWidth: Control logical page sizing by the
HTML-, Word-, and Excel-rendering extensions.
The following chapter discusses functionality that SSRS provides to simplify navigation in
large reports and within the hierarchy of reports.
From the Library of STEPHEN EISEMAN
Please purchase PDF Split-Merge on www.verypdf.com to remove this watermark.
ptg
CHAPTER
16
Report Navigation
IN THIS CHAPTER
.
Hyperlink
(Go to URL)
Navigation
.
BookmarkLink
(Go to
Bookmark) Navigation
.
Drillthrough
(Go to Report)
Navigation
. Document Map
. Hide and Toggle Items
. Practical Application of Action
Items
O
ne of the main uses for navigation functionality is to
simplify navigation of large reports and navigation of report
hierarchies. To achieve this, report developers can add
hyperlink actions (or simply actions) to a report. Reporting
Services supports three types of actions:
. Drillthrough (Go to Report): Go to other reports.
This action also provides an opportunity to provide
parameters for the target report and the ability to
jump to the same report with different parameters.
This action is denoted with the
<Drillthrough>
element in a report’s Report Definition Language
(RDL).
. BookmarkLink (Go to Bookmark): Jump to other
areas (bookmarked) within the report. This action is
denoted with the
<BookmarkLink>
element in a
report’s RDL.
. Hyperlink (Go to URL): Jump to web pages and
other
HREF
constructs, such as mail and news. This
action is denoted with the
<Hyperlink>
element in a
report’s RDL.
Expressions can be used as a value for any action. Report
developers can add an action from either the Item
Properties (for example, Text Box Properties for a text box)
dialog box or from the Properties window.
To open the Properties dialog, right-click a report item,
select <Item Name> Properties from the shortcut menu, and
then click the Action tab and select one of the actions: Go
to Report, Go to Bookmark, or Go to URL.
From the Library of STEPHEN EISEMAN
Please purchase PDF Split-Merge on www.verypdf.com to remove this watermark.
ptg
284
CHAPTER 16 Report Navigation
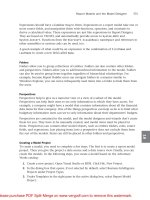
FIGURE 16.1
Action tab.
Alternatively, you can modify the
Action
property from Properties window by just clicking
the ellipsis to the right of the
Action
property (see Figure 16.1).
You can add actions to a Textbox, Image, Gauge, or Chart data series. Because a Tablix can
contain a Textbox, Image, Gauge, or Chart, those, in turn, can provide actionable items
within a Tablix.
Any Reporting Services item can have Bookmark and Document Map labels associated
with it. Those labels assist in navigation by providing “landing marks” for navigation
destinations. To illustrate this, imagine that you have a bookmark Bookmark10 located on
page 10 of your report and a table of contents (TOC) on page one of your report. One of
the TOC’s lines contains the
BookmarkLink
action involving Bookmark10. If you click this
action in the TOC, the focus of the view will switch to page 10. You can set
Bookmark
and
Document Map
via like-named properties in the Properties window.
TIP
Highlight an actionable item so that it is intuitive to a user that the item can be
clicked. Blue in color, underlined text items usually provide good highlights.
Hyperlink (Go to URL) Navigation
When a report developer adds the
Hyperlink
action, SSRS generates
HREF
to create a navi-
gable HTML link. For example, when you enter into a Go to
URL text box and set the value of
Textbox.Value
equal to
Visit Microsoft
, the following
is the link generated by SSRS when it renders the report to HTML format:
From the Library of STEPHEN EISEMAN
Please purchase PDF Split-Merge on www.verypdf.com to remove this watermark.
ptg
285
BookmarkLink (Go to Bookmark) Navigation
16
<a href=” style=”text-decoration:none;color:Black”
TARGET=”_top”>Visit Microsft</a>
Reporting Services allows navigation using other constructs valid for the
HREF
tag. For
example,
javascript:history.back()
enables you to emulate a browser’s Back button.
This particular construct relies on Java support by the browser (Netscape 2 or later and
Internet Explorer 3 or later) and enabled JavaScript. Other valid constructs are
.
mailto:
, which allows creating a link that launches an
email editor and places on the To line
.
to launch an FTP download
.
news:www.microsoft.com
to get to a newsreader
NOTE
Not all
HREF
constructs function in Preview mode. For example,
javascript:history.back()
will not deliver the action in Preview mode; also, this
construct will function after the report is deployed to a Report Server.
To create a
Hyperlink
(Go to URL) action, enter a valid (such as
or other described previously)
HREF
construct in the Go to URL action field. Figure 16.1
shows the Action property page that allows you to input the Go to URL action.
Action
has
the following corresponding RDL:
<Action>
<Hyperlink></Hyperlink>
</Action>
Or
<Action>
<Hyperlink>={Expression}</Hyperlink>
</Action>
In the preceding code fragment, an
{Expression}
is any expression that evaluates to a
valid
HREF
construct as described previously, such as .
BookmarkLink (Go to Bookmark) Navigation
BookmarkLink
(Go to Bookmark) simplifies navigation for large reports. This action allows
navigation to a bookmarked line or page of the report. Keep in mind that you can associ-
ate multiple actions with a single bookmark link.
From the Library of STEPHEN EISEMAN
Please purchase PDF Split-Merge on www.verypdf.com to remove this watermark.
ptg
286
To create a
BookmarkLink
navigation, the first step is to set a bookmark. A bookmark can
be set for any report item using the following:
. Properties window: The Properties window is normally docked in the lower-right
corner of Report Designer. If you do not see this window, press F4 or choose
Properties Window from the View menu.
. Navigation tab of an item’s Properties dialog box: The Properties dialog box
can be accessed by right-clicking a report item and selecting Item Properties from the
shortcut menu, where Item is the name of an item, such as Text Box. The Action tab
of an item’s Properties dialog box is shown in Figure 16.1.
After
Bookmark
is set, Report Designer adds the following RDL:
<Bookmark>
={Expression}
</Bookmark>
The next step is to create a
BookmarkLink
action, which performs the navigation to the
bookmark set in the previous step. The
BookmarkLink
action can be created for Textbox,
Image, Gauge, and Chart data series. To create a
BookmarkLink
action, open the Action tab
of an item’s Properties dialog box, select Go to Bookmark, and enter a bookmark’s
expression.
After the
BookmarkLink
action is set, Report Designer adds the following RDL:
<Action>
<BookmarkLink>
={Expression}
</BookmarkLink>
</Action>
Drillthrough (Go to Report) Navigation
This type of action is commonly used when there is a need to have master (parent) and
detail (child) reports. An action, which takes users to a detail report, is created on the
master report.
To create a
Drillthrough
navigation (action), you need to set the Go to Report expression
on the Action tab of the item’s Properties dialog box. The Go to Report expression must
evaluate to a name of a report.
You can also specify parameters to pass to a report by clicking the Add button under the
Use This Parameters to Run the Report section (which becomes visible once you select Go
CHAPTER 16 Report Navigation
From the Library of STEPHEN EISEMAN
Please purchase PDF Split-Merge on www.verypdf.com to remove this watermark.
ptg
287
Document Map
16
to Report action on the Action tab). In the Parameters dialog box, you can enter a
constant name of a parameter and an expression that will assign a value to the parameter.
The following is an example of the RDL for the
Drillthrough
action:
<Action>
<Drillthrough>
<ReportName>Product Detail</ReportName>
<Parameters>
<Parameter Name=”ProductNumber”>
<Value>=Fields!Name.Value</Value>
</Parameter>
</Parameters>
</Drillthrough>
</Action>
NOTE
The Back to Parent Report button on the Report Viewer’s toolbar provides a convenient
way to navigate back to a parent. This button is especially handy in Preview mode when
a Back browser button is not available.
Document Map
Much like bookmarks, the document map is designed to simplify navigation for large
reports. A document map is intended for interactive (HTML rendering) report viewing and
is displayed as a side panel on a report.
PDF, Word, and Excel rendering extensions have a different way of articulating a docu-
ment map. Excel rendering extension creates a separate worksheet with the name
Document Map, which provides links to a worksheet with the report’s data. PDF displays
the document map in the Bookmarks navigation tab.
Document map labels are set similarly to bookmarks as they relate to report items. To
create a document map for a report, you would fill the
DocumentMapLabel
property in the
Properties window for each report item them that you would like to include on the map.
When a report has at least one document map label, Reporting Services automatically
generates a document map and renders a treelike structure containing navigational items.
SSRS builds a document map entry when it sees the following RDL:
<Label>={Expression}</Label>
Document map labels from report items are displayed on the same level (next after the
root level) and ordered in the order of the report item’s appearance on a report. The order
is based first on the position of the top side (vertical ordering) of a report item and then
on the position of the left side (horizontal ordering) of the report item.
From the Library of STEPHEN EISEMAN
Please purchase PDF Split-Merge on www.verypdf.com to remove this watermark.
ptg
288
The document map also supports a hierarchical display of labels. SSRS creates a hierarchi-
cal view on a document map when you set Document Map and Recursive Parent expres-
sions using the Advanced tab of the Group Properties dialog box. PDF shows labels of a
document map in the Bookmarks navigation panel. (In Adobe Reader 9.0, the panel is
accessible from View, Navigation Panels, Bookmarks menu.) Note that early versions of the
Adobe Reader did not support hierarchical bookmarks.
The document map has the same name as the name of the report. This name is used for
the root node of a document map. There are no options that allow changing the name of
a document map and only one document map is allowed per report.
Rendering of a document map by the Word rendering extension is a bit trickier and you
have to perform a couple of additional steps. The steps are necessary because the Word
rendering extension renders the document map as table entry fields. You can see table
entry fields as
{TC “Text” [switches]}
if you show hidden fields (you can do this by
using Ctrl-* shortcut) while viewing a Word document. To create a table of contents (TOC)
from table entry fields, you would perform an “insert table of contents” action and set
appropriate options. In Word 2007, you select the References tab on the Ribbon, click the
Table of Contents button, and select Insert Table of Contents from the drop-down list. At
this point, a Table of Contents dialog opens. Click the Options button, and in the Table of
Contents Options dialog box unselect everything except the Table Entry Fields check box.
Click OK until the TOC is inserted into the exported document.
Hide and Toggle Items
Hiding and toggling functionality supports interactive visibility for sections of a report
and enables you to dynamically expand portions (of a report) that you want to see. This is
yet another option to simplify navigation. Hide and toggle functionality can be used, for
example, to implement master/detail functionality, category/subcategory functionality, or
to simply shorten a large report.
To implement this functionality, you would leverage several properties:
. InitialToggleState: The
InitialToggleState
property indicates an image that
is displayed for a toggle item: collapsed, expanded, or expression. Normally, the
toggle control is a plus or minus symbol, which indicates an expanded or collapsed
state, respectively. The
InitialToggleState
property only defines a picture of a state
image, but does not change the visibility of an item. If not specified, the default
toggle state is
False
(or collapsed). If a report developer clears the
InitialToggleState
property, the state reverts back to
False
.
. ToggleItem: A name of report item that will show or hide this report item.
. Hidden: Indicates an initial visibility of a report item.
NOTE
Note that the toggle state is not available for groups. It is available only for individual
items.
CHAPTER 16 Report Navigation
From the Library of STEPHEN EISEMAN
Please purchase PDF Split-Merge on www.verypdf.com to remove this watermark.
ptg
289
Practical Application of Action Items
16
BIDS adds the following RDL for the
InitialToggleState
:
<ToggleImage>
<InitialState>true</InitialState>
</ToggleImage>
Reporting Services adds the following RDL for
ToggleItem
and
Hidden
. (When the item is
visible, the
<Hidden>
tag is not included.)
<Visibility>
<ToggleItem>{ToggleItem}</ToggleItem>
<Hidden>={Expression}or {true}</Hidden>
</Visibility>
Practical Application of Action Items
For illustrative purposes, imagine that the Adventure Works Internet sales department
wants to create an interactive product catalog. The initial screen of a report should not be
larger than a single page. A report must provide effective navigation through the products
(items in the catalog). A user of the catalog must be able to navigate through the product
category and subcategory hierarchies.
Implementation
First, using any method described in earlier chapters, let’s create a new report (Navigation)
and a data set (you can name the data set
ProductCategories
) with the following query
using the
AdventureWorks
data source:
SELECT Production.ProductCategory.Name AS CategoryName,
Production.ProductSubcategory.Name AS SubCategoryName,
Production.Product.Name AS ProductName,
Production.ProductPhoto.ThumbNailPhoto,
Production.Product.ProductNumber
FROM
Production.ProductCategory
INNER JOIN
Production.ProductSubcategory ON Production.ProductCategory.ProductCategoryID =
Production.ProductSubcategory.ProductCategoryID
INNER JOIN Production.Product ON Production.ProductSubcategory.
ProductSubcategoryID = Production.Product.ProductSubcategoryID
INNER JOIN
Production.ProductProductPhoto ON Production.Product.ProductID =
Production.ProductProductPhoto.ProductID
INNER JOIN
Production.ProductPhoto ON Production.ProductProductPhoto.ProductPhotoID =
Production.ProductPhoto.ProductPhotoID
From the Library of STEPHEN EISEMAN
Please purchase PDF Split-Merge on www.verypdf.com to remove this watermark.
ptg
290
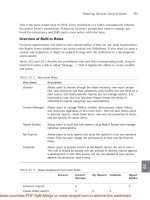
Text box
Table with 3 row groups,
including Details group
Row groups
Matrix with single column
group based on CategoryName
FIGURE 16.2
Navigation report Design view.
Create a report layout outline, as shown in Figure 16.2. This report uses Matrix (remember
that Matrix is a template for Tablix) to provide category navigation.
CHAPTER 16 Report Navigation
To show pictures from the database, add an Image report item from the toolbox to the last
column of the Details row in the table.
To show pictures from a database, right-click the cell with an image in it and select Image
Properties from the context menu. Set Select the Image Source to Database. Set Use This
Field to [ThumbNailPhoto] and set Use This MIME Type to image/jpeg.
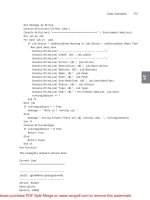
Right-click the Matrix’s cell with
CategoryName
value in it and select Text Box Properties
from the context menu. On the Action tab (see Figure 16.3), select Go to Bookmark and
select [CategoryName] from the drop-down list. This adds the following expression to the
Select Bookmark action:
=Fields!CategoryName.Value
This bookmark will allow users to access an appropriate category name on a report. Apply
formatting so that a user can tell that this is a clickable item. For example, in the Text Box
Properties dialog box (under the Font tab), select Italic, Blue, Underline font.
From the Library of STEPHEN EISEMAN
Please purchase PDF Split-Merge on www.verypdf.com to remove this watermark.
ptg
291
FIGURE 16.3
Go to Bookmark action.
Practical Application of Action Items
16
Right-click the text box with eMail Product Support in it and view the Text Box Properties
dialog box. On the Action tab, enter the following expression to the Go to URL action (see
Figure 16.4):
mailto:
This action starts the user’s email application and places in
the To line.
Click the table and then right-click SubcategoryGroup (first parent of the Details group) in
the grouping pane. Select Group Properties from the context menu and go to the
Advanced tab.
Select [CategoryName] from the Recursive Parent drop-down list or enter the following
expression as the recursive parent:
=Fields!CategoryName.Value
Select [SubCategoryName] from the Document Map drop-down list or enter the following
expression in the document map:
=Fields!SubCategoryName.Value
Note that we use [CategoryName] as the grouping expression for CategoryGroup and also
as a document map for the outer (parent) group (see Figure 16.5). Setting the recursive
parent and document map as we have done creates a hierarchy in a document map.
From the Library of STEPHEN EISEMAN
Please purchase PDF Split-Merge on www.verypdf.com to remove this watermark.
ptg
292
CHAPTER 16 Report Navigation
FIGURE 16.4
Go to URL action.
FIGURE 16.5
Document map and its hierarchy.
Click the text box that contains the [SubCategoryName] expression and a group indicator.
Note that because it was a part of the first group that we created it has the name Group1.
Let’s set its name to
SubCategoryGroupTxt
.
Similarly, rename the text box with [CategoryName] to
CategoryNameTxt
.
From the Library of STEPHEN EISEMAN
Please purchase PDF Split-Merge on www.verypdf.com to remove this watermark.
ptg
293
Practical Application of Action Items
16
In the grouping pane, right-click the Details group, select Group Properties from the
context menu, and go to the Visibility tab. Set the When the Report Is Initially Run
option (initial visibility) to Hide. Check the Display Can Be Toggled by This Report Item
check box, and select SubCategoryGroupTxt from the drop-down list. Visibility informa-
tion should look similar to Figure 16.6.
For a clean display, set the
Hidden
property (from the Properties window) to
True
and set
the
ToggleItem
property to
SubCategoryGroupTxt
for detail cells in the Product Name and
Thumb Nail Photo columns.
Add formatting to make the display more visually appealing.
Figure 16.7 shows the final product.
NOTE
A report can use a hidden parameter to prevent a casual user from viewing some infor-
mation, such as
HideCost
=
True
. However, when you create a
Drillthrough
action,
you can set the
HideCost
parameter to
False
and thus reveal cost information.
FIGURE 16.6
Setting item visibility.
From the Library of STEPHEN EISEMAN
Please purchase PDF Split-Merge on www.verypdf.com to remove this watermark.
ptg
294
CHAPTER 16 Report Navigation
FIGURE 16.7
Sample report with navigation.
Summary
Actions, document maps, and bookmarks simplify navigation of complex reports, report
hierarchies, and more. SSRS supports three types of actions:
Drillthrough
(or Go to
Report),
BookmarkLink
(or Go to Bookmark), and
Hyperlink
(or Go to URL; general web
navigation).
Actions can be added to a Textbox, Image, Gauge, or Chart data series. Because a Tablix
can contain a Textbox, Image, Gauge, or Chart, those, in turn, can provide actionable
items within Tablix.
Any Reporting Services item can have Bookmark and Document Map labels associated
with it. Those labels assist in navigation by providing “landing marks” for navigation
destinations.
After a report developer has defined
Document Map
labels, SSRS automatically renders a
document map. Document maps are supported by HTML, Excel, Word, and PDF rendering
extensions.
The next chapter explains how SSRS works with multidimensional data sources and how it
integrates with Analysis Services and data-mining features of SQL Server 2008.
From the Library of STEPHEN EISEMAN
Please purchase PDF Split-Merge on www.verypdf.com to remove this watermark.
ptg
CHAPTER
17
Working with
Multidimensional Data
Sources
IN THIS CHAPTER
. Analysis Services Concepts
. Data-Mining Concepts
. MDX and DMX
. Advanced OLAP Concepts
. Creating Data-Mining Reports
A
nalysis Services is a large subject and deserves an entire
book by itself. Although the details of Analysis Services are
beyond the scope of this book, a discussion of basic
concepts will help you to get the most out of this chapter.
Analysis Services Concepts
It is no surprise that during the course of business every
company accumulates data. It is common to divide data-
bases into two categories: transaction processing and data
warehouses.
Typical transaction-processing databases are used for current
processing, such as online sales, customer management,
employee management, production, and inventory manage-
ment. Transaction-processing databases are small in size,
usually less than 100GB, and tend to have only a small
amount of historical data that is directly relevant to
ongoing transaction processing. An online transaction
processing (OLTP) database is tuned for fast processing of
transactions, incurs many changes (volatile) throughout a
day, and is normally not used for reporting. An OLTP data-
base is typically normalized to optimize data storage and
retrieval for transactions.
A data warehouse (DW) is a database that is used for report-
ing and data analysis. It is possible to use an OLTP database
for reporting, but it often negatively impacts transactional
performance and is certain to make online users unhappy.
If an online purchasing transaction is slow, a user is likely
going to another site that offers better performance.
From the Library of STEPHEN EISEMAN
Please purchase PDF Split-Merge on www.verypdf.com to remove this watermark.
ptg
296
CHAPTER 17 Working with Multidimensional Data Sources
A DW usually has the following attributes:
. It is large in size (it is not uncommon to have multiterabyte data warehouses) and
might contain years of historical data. Part of the data might not be currently useful,
but provides a view into the company’s past and can be analyzed to determine why,
for example, online sales were successful in a certain time frame, or how well a
marketing campaign performed.
. It stores data in the matter understandable to business users as opposed to applica-
tions. In contrast, OLTP databases are designed to accommodate applications. A DW
is designed to answer business questions, such as sales numbers for a particular
region and time frame.
. It is updated on predetermined intervals (once daily, weekly, or monthly) from trans-
actional databases and ideally does not change previously stored historical data.
A subset of a DW is called a data mart. A DW usually contains data from a variety of
heterogeneous data sources. Data marts are designed to minimize the amount of data used
in processing and can contain a subset of data, based on, for example, time or geography.
Unified Data Model (UDM) was a new feature that first appeared in SQL Server 2005.
UDM greatly simplifies access to data and combines the best of relational and analytical
models.
UDM allows Reporting Services to get data from Analysis Services in a similar fashion as
from any relational data source. One way to think about UDM is as a view on data, which
allows “combining” data from various data sources (SQL Server relational and OLAP data-
bases, Oracle, Teradata, DB2, and so on), “defining” relationships between that data,
“defining” calculated fields, and mapping between original column names and newly
defined names that might be more understandable to users of UDM. Several words in the
previous sentence are included in double quotes (
””
). UDM does not really combine data,
but rather creates a metadata (data describing) view. This does not affect the source data
itself, but allows creating a metadata view that, for example, may have a “relationship”
between SQL Server and an Oracle table. Then UDM can be queried, like a database, and
UDM, in turn, will access original data sources to retrieve needed data. UDM blurs the
usual differentiation between OLTP and DW data. In the past, a DW stored denormalized
data for quick retrieval. This is standard in the industry, but with UDM, users no longer
have to denormalize their DWs.
Analysis Services consists of two components: Online Analytical Processing (OLAP) and
Data Mining (DM). OLAP is designed to summarize data, and DM is designed to look for
patterns and trends in data.
Let’s look at the example in which a manager wants to analyze sales by country. It is
certainly possible to use aggregate functions such as
SUM()
in a query or in SSRS to calcu-
late summaries by country, but for the large amounts of data, it is not very efficient.
Depending on the amount of data, summarization could be slow, which would be unsatis-
factory to online users.
From the Library of STEPHEN EISEMAN
Please purchase PDF Split-Merge on www.verypdf.com to remove this watermark.
ptg
297
Analysis Services Concepts
17
Reporting Services provides caching mechanisms that enable you to prepare a summary
report and then display it to a user in real time without waiting for data retrieval.
However, OLAP provides a better choice when a user is looking for summarized (or aggre-
gated) data. This is because OLAP is specially tuned to perform aggregations. One of the
most useful OLAP modes is Multidimensional OLAP (MOLAP). MOLAP stores aggregated
data in an Analysis Services multidimensional structure, called a cube, which is highly
optimized to maximize query performance.
NOTE
This chapter discusses default OLAP aggregation mode: MOLAP. Analysis Services pro-
vides two modes in addition to MOLAP: Relational OLAP (ROLAP), which does not store
summaries and queries relational data for each Multidimensional Expressions (MDX)
query; and Hybrid OLAP (HOLAP, a combination of MOLAP and ROLAP). Details of vari-
ous modes are beyond this book’s scope.
A Transact-SQL (T-SQL) query against the AdventureWorks DW database to get a summary
by country would look like the following:
SELECT DimSalesTerritory.SalesTerritoryCountry AS [Country-Region],
SUM(FactInternetSales.SalesAmount) AS [Internet Sales-Sales Amount]
FROM DimSalesTerritory INNER JOIN FactInternetSales ON
DimSalesTerritory.SalesTerritoryKey = FactInternetSales.SalesTerritoryKey
GROUP BY DimSalesTerritory.SalesTerritoryCountry
A comparative multidimensional (or MDX; you can find more about MDX later in this
chapter) query to retrieve the same result would look like the following:
SELECT NON EMPTY
{ [Measures].[Internet Sales Amount]} ON COLUMNS,
NON EMPTY { [Customer].[Customer Geography].[Country]}
DIMENSION PROPERTIES
MEMBER_CAPTION,
MEMBER_UNIQUE_NAME ON ROWS
FROM [Adventure Works]
As you can see, for a simple aggregation the complexity of either query is fairly compara-
ble. The key difference is in the underlying structures that each query accesses.
At this point, you should not be concerned if you are not familiar with MDX. SQL Server
2008 has an extremely capable visual designer that makes creation of an MDX query a
fairly easy endeavor.
The result of both queries is the same and is shown in Table 17.1 (OLAP).
From the Library of STEPHEN EISEMAN
Please purchase PDF Split-Merge on www.verypdf.com to remove this watermark.
ptg
298
CHAPTER 17 Working with Multidimensional Data Sources
The duration of either query is not significantly different if the amount of data is small.
For large amounts of data, the MDX query is going to be significantly faster because a
cube stores aggregate data. Aggregation of data can be done on multiple levels, such as
country, state, and city, and can be subsequently stored in the cube. Thus, MOLAP does
not have to query a large DW to generate needed summaries. All that needs to be queried
is the cube. MOLAP summarizes and stores data when the cube is processed.
Data-Mining Concepts
Data mining is designed to analyze trends and patterns in the data. For example, a
manager at Adventure Works wants to analyze purchasing patterns of Adventure Works
customers and determine how to up-sell and cross-sell shoppers online and wants to deter-
mine how to best design a marketing (mailing) campaign. Multiple attributes of a customer
can be analyzed (age, geographic location, number of cars, number of children, gender, and
marital status). There are potential patterns of attributes that determine whether the
customer is likely to purchase a certain product. Based on determined patterns, a manager
can target likely shoppers with promotions. Data mining derives knowledge from data by
examining it using mathematical models for predictions and statistical analysis.
Conversely to data mining, OLAP usability for trend analysis is limited. A user would have
to come up with a hypothesis that he needs to verify by looking through the data and
determining whether the hypothesis is true. If the number of attributes that needs to be
taken into account is large, some would likely be missed by an analyst. Large amounts of
data increase complexity of analysis and require additional manpower to analyze the data.
A case table is one of the main constructs in data mining. Case encapsulates everything
about an entity that is being categorized, classified, or analyzed for trends. A simple case is,
for example, a customer, who has the following attributes: age, martial status, and wealth.
Creating a Data-Mining Model
Before creating a new model, you should do the following:
. Define the problem. What columns or attributes should the model predict?
. Determine the location of the data to be analyzed. The source of data could be a SQL
Server database or a cube.
TABLE 17.1
Query Results
Country-Region Internet Sales-Sales Amount
Australia 9061000.5844
Canada 1977844.8621
France 2644017.7143
Germany 2894312.3382
United Kingdom 3391712.2109
United States 9389789.5108
From the Library of STEPHEN EISEMAN
Please purchase PDF Split-Merge on www.verypdf.com to remove this watermark.
ptg
299
Data-Mining Concepts
17
. Decide the data-mining algorithm the model should use.
The data-mining model (DMM) designed to analyze the probability of a bike purchase for
a customer of a certain age could be created with the following code:
CREATE MINING MODEL [BikePurchasePrediction]
(
CustomerKey LONG KEY,
BikeBuyer DOUBLE DISCRETE PREDICT,
Age DOUBLE CONTINUOUS
)
Training DMM
To train DMM, “feed” it with data for which attributes to be predicted are known. For
example
INSERT INTO [BikePurchasePrediction] ( CustomerKey, BikeBuyer, Age) OPENQUERY
( [Adventure Works DW], ‘SELECT CustomerKey, BikeBuyer, Age FROM vTargetMail’)
NOTE
The first parameter for
OPENQUERY
is a named data source that exists on the Microsoft
SQL Server 2005 Analysis Services (SSAS) database, such as
[Adventure Works DW]
used in this example.
DMM does not, usually, store inserted data; instead, it builds a statistical model (statistical
patterns that the mining algorithm detected in the data). This statistical model is stored in
a truth table, which contains each possible combination of examined parameters and the
probability of each combination. In a “nutshell,” a truth table looks similar to Table 17.2.
As needed, DMM can be retrained or incrementally refined by using
TRUNCATE TABLE
and
DROP TABLE
statements.
Querying DMM
To query a DMM, you need to have input data that you want to analyze and a trained
DMM. A query maps information between input data and a DMM and needs to specify
what has to be predicted.
TABLE 17.2
Truth Table
Age Probability of Buying a Bike
40 70%
From the Library of STEPHEN EISEMAN
Please purchase PDF Split-Merge on www.verypdf.com to remove this watermark.
ptg
300
CHAPTER 17 Working with Multidimensional Data Sources
TABLE 17.3
Two-Dimensional Data
Internet Sales
Amount
Calendar
Year
Country-Region 2001 2002 2003 2004 Grand Total
Australia 1,309,047 2,174,285 3,033,784 2,563,884 9,061,000
Canada 146,830 621,602 535,784 673,628 1,977,844
France 180,572 514,942 1,026,325 922,179 2,644,018
Germany 237,785 521,231 1,058,406 1,076,891 2,894,312
For example
SELECT
age, PredictProbability([Bike Buyer])
FROM BikePurchasePrediction PREDICTION JOIN ProspectiveBuyer
ON BikePurchasePrediction.age = ProspectiveBuyer.age
MDX and DMX
MDX is an acronym for Multidimensional Expressions. It is a statement-based scripting
language used to define, manipulate, and retrieve data from multidimensional objects in
SSAS. MDX is similar in many ways to the familiar Structured Query Language (SQL)
syntax typically used with relational databases, but it is not an extension of SQL.
Data Mining Extensions (DMX) is a language that you can use to create and work with
DMMs in SSAS. You can use DMX to create new DMMs, to train these models, and to
browse, manage, and predict using those models. The DMX language is an extension of
SQL, to create and work with models.
Advanced OLAP Concepts
First, you should understand a couple of definitions to become familiar with Analysis
Services lingo. Measure or fact is a numeric value used to monitor (measure) business. Sales
amount is an example of a measure. Dimension is an independent group of attributes of a
measure. Each attribute within a group is called a member. Dimension has to be meaning-
ful for business aggregations. For the member to be included in dimension, it should have
a meaningful relationship to the dimension. Geography, date/time, and customer are
examples of dimensions.
Measure can be analyzed by one or multiple dimensions. Table 17.1 earlier in this chapter
is a simple example of aggregations or an OLAP report. In Table 17.1, Internet Sales-Sales
Amount is a measure and Country-Region is a dimension. Therefore, the data in Table
17.1 is analyzed and aggregated by a single dimension. Data can also be analyzed by two
dimensions, such as date and geography, as shown in Table 17.3.
From the Library of STEPHEN EISEMAN
Please purchase PDF Split-Merge on www.verypdf.com to remove this watermark.