Tài liệu Sams Microsoft SQL Server 2008- P8 pptx
Bạn đang xem bản rút gọn của tài liệu. Xem và tải ngay bản đầy đủ của tài liệu tại đây (2.6 MB, 50 trang )
ptg
331
Report Models and the Model Designer
18
Expressions should have a familiar ring to them. Expressions in a report model take one or
more source fields, and manipulate them with functions, operators, and constants to
derive a calculated value. These expressions are just like expressions in Report Designer.
They are based on VB.NET, and automatically provide access to
System.Math
and
System.Convert
. Functions from the
Microsoft.VisualBasic
namespace and references to
other assemblies or custom code can be used, too.
A good example of what could be an expression is the combination of
FirstName
and
LastName
to create a new field called
Name
.
Folders
Folders allow you to group collections of entities. Folders can also contain other folders
and perspectives. Folders allow you to add hierarchical information to the model. Folders
can also be used to group items together regardless of hierarchical relationships. For
example, because Report Builder users can navigate folders in a manner similar to
Windows Explorer, you can move infrequently used items into a folder to hide them from
the users.
Perspectives
Perspectives help to give us a narrower view or a view of a subset of the model.
Perspectives can help limit users to see only information to which they have access. For
example, a company might have a model that contains information about all the financial
data items for that company. One of the things perspectives can help us do is to limit what
budgetary information users can see to only information about their departments’ budgets.
Perspectives are contained in the model, and the model designers and wizards don’t create
them for you. They have to be manually created, and model items must be placed in
them. Perspectives can contain other model objects, such as entities folders, roles, source
fields, and expressions. Just placing items into a perspective does not exclude them from
the rest of the models. Items can still be placed in other folders and perspectives.
Creating a Model Project
To create a model, you need to complete a few steps. The first is to create a report model
project. Then you give the project a data source and a data source view. Finally, you can
create the models. In the following steps, you create a model based on the Adventure
Works catalog:
1. Create a new project. Open Visual Studio or BIDS. Click File, New Project.
2. In the dialog box that opens, if not selected by default, select Business Intelligence
Projects under Project Types.
3. Under Templates in the right pane in the active dialog box, select Report Model
Project.
From the Library of STEPHEN EISEMAN
Please purchase PDF Split-Merge on www.verypdf.com to remove this watermark.
ptg
332
CHAPTER 18 Ad Hoc Reporting
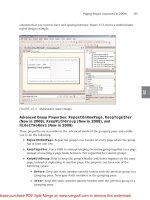
FIGURE 18.1
Creating new business intelligence projects.
4. Call the project
First Model
. Make sure Create Directory for Solution is checked (see
Figure 18.1).
Creating a Data Source
Now that you have an empty project, the next thing to do is connect it to a data source.
Remember the data source has to be SQL Server (or abstracted through linked servers or
UDM).
Unlike Report Designer, no other data sources are accepted directly:
1. Open Solution Explorer and right-click the Data Sources folder. Click Add New Data
Source. This launches the New Data Source Wizard.
2. Skip the Welcome page by clicking Next.
3. On the next page, select Create a Data Source Based on an Existing or New
Connection, and then click New.
4. Enter
localhost
as the name of the server to connect to.
5. Select Windows Authentication.
6. From the Select or Enter a Database Name list, select Adventure Works.
7. Click Test Connection; if you get an OK dialog box, click OK. If not, try to resolve
the error using the debug information given, and then try again.
8. Click OK. At this point, you should have a screen that looks similar to Figure 18.2
(Data Source Wizard).
9. Click Next.
10. At this point, you could change the name of the data source. If it is not already, call
the new data source
Adventure Works
.
From the Library of STEPHEN EISEMAN
Please purchase PDF Split-Merge on www.verypdf.com to remove this watermark.
ptg
333
Report Models and the Model Designer
18
FIGURE 18.2
Defining the connection.
11. Click Finish.
A new data source called Adventure Works should appear in the Data Sources folder in
Solution Explorer.
Creating a Data Source View
The next step in the creation of a model is the creation of the data source view. Recall,
from earlier, that the data source view contains information about the physical layout of
the database. To create a data source view, complete the following steps:
1. Open Solution Explorer and right-click the Data Source Views folder. Click Add New
Data Source View. This launches the New Data Source View Wizard.
2. Select the Adventure Works data source and click Next.
3. The next screen asks you to select the tables and views that are going to be included
in the semantic model. Click the >> button to move all the objects from the
Available Objects list box to the Included Objects list box (see Figure 18.3).
4. Click Next.
5. Name the data source view
Adventure Works DSV
.
6. Click Finish.
A new data source view called Adventure Works DSV should appear in the Data Source
Views folder in Solution Explorer.
The wizard is smart enough to detect whether the underlying data source has no foreign
key constraints. In this case, the wizard gives you an extra screen before selecting which
tables to include in the data source view. The screen gives you three types of matching
logic so that it can infer relationships in the data store. If your DBMS does not follow any
of these conventions, you will have to add the data source relationships yourself. Figure
18.4 shows the Name Matching screen.
From the Library of STEPHEN EISEMAN
Please purchase PDF Split-Merge on www.verypdf.com to remove this watermark.
ptg
334
CHAPTER 18 Ad Hoc Reporting
FIGURE 18.3
Selecting the tables and views.
FIGURE 18.4
Name Matching screen of the Data Source View Wizard.
After the wizard is complete, double-click the
Adventure Works DSV.dsv
file in Solution
Explorer. This opens a document showing you the relationships that the wizard has just
inferred (see Figure 18.5).
To get the document to fit on one page, you might have to click the View menu, point to
Zoom, and then click To Fit.
Creating a Report Model
Finally, you can create the actual model. To create the model, complete the following
steps:
1. Open Solution Explorer and right-click the Report Models folder. Click Add New
Report Model. This launches the New Report Model Wizard.
From the Library of STEPHEN EISEMAN
Please purchase PDF Split-Merge on www.verypdf.com to remove this watermark.
ptg
335
Report Models and the Model Designer
18
FIGURE 18.5
Data source view.
2. Click Next on the Welcome screen.
3. The next screen is the screen to select data source views. At this point, only the
Adventure Works DSV should show up. Select this, and then click Next.
4. The next screen is the Model Generation Rules screen, which is shown in Figure
18.6. From this screen, you can select from a predefined set of rules to ease the
model-generation process. For our purposes, the defaults are fine. Click Next.
FIGURE 18.6
Selecting report model generation rules.
From the Library of STEPHEN EISEMAN
Please purchase PDF Split-Merge on www.verypdf.com to remove this watermark.
ptg
336
CHAPTER 18 Ad Hoc Reporting
FIGURE 18.7
Collect Model Statistics screen of the Report Model Wizard.
FIGURE 18.8
Completing the Wizard screen of the Report Model Wizard.
5. The next screen asks you to create statistics. Because Report Builder uses database
statistics to aid it in the model-generation process, it is important to make sure your
statistics are up-to-date. Otherwise, it might miscalculate some factors, such as drill
down and aggregates. It is recommended to update statistics whenever the data
source or data source views have changed. Click Update Model Statistics Before
Generating, if necessary, on the Collect Model Statistics screen.
Click Next (see Figure 18.7).
6. Name the model
Adventure Works Model
, and then click Run. Figure 18.8 shows the
resulting screen.
From the Library of STEPHEN EISEMAN
Please purchase PDF Split-Merge on www.verypdf.com to remove this watermark.
ptg
337
Report Models and the Model Designer
18
7. Click Finish. Figure 18.9 shows the completed model.
Modifying Items in the Model
The way entities show up in the Model Designer reflects how they will show up in Report
Builder. To make things more meaningful for the end user, many of the properties or enti-
ties can be customized. Working with the model involves some of the same basic concepts
as working with Report Designer. The properties of any object can be modified from the
Properties window.
Things you can customize include sorting, instance selection, and inheritance. What this
means is that attributes can be set to come from other entities or that users can see a
filtered list of instances of an entity. Entities can also predefine formatting of their attrib-
utes. For example, attributes that reflect currency can be formatted as currency depending
on the user’s localized settings. The order in which things appear in the entity browser can
also be customized. By default, entities appear sorted in alphabetic order, but you can
move certain entities to the top if users are going to report off them frequently.
To modify items in the model, it is just a matter of right-clicking in the tree view or list
view. The Report Model menu in the Model Designer also gives the same menu options.
To delete any item, just navigate to the item, right-click it, and choose Delete from the
shortcut menu.
To add an entity, folder, or perspective, do the following:
1. Navigate to the top of the tree view.
FIGURE 18.9
Completed database model.
From the Library of STEPHEN EISEMAN
Please purchase PDF Split-Merge on www.verypdf.com to remove this watermark.
ptg
338
CHAPTER 18 Ad Hoc Reporting
2. From the Report Model menu, select New Entity, New Perspective, or New Folder.
From this point, each of these items has its own caveats.
If you choose to add a new entity, the name given to the entity is simply NewEntity. You
must navigate to NewEntity, right-click it, select Rename from the shortcut menu, and
rename it to what you want. To be effective, the binding information has to be set, too.
When adding folders, a similar process has to be followed. You must navigate to the entity
or to the top entity in the tree, right-click it, and select New Folder. A new folder called
New Folder is created. The location of the new folder is dependent on where you were
when you right-clicked to add the new folder. You must right-click it and select Rename
from the shortcut menu to rename it.
To add a new role, attribute, or source field, click any detail item, and then select the
option you need from the Report Model menu. When you add a new role, a pop-up
appears with a list of entities. Select an entity, and then assign the bindings in the
Properties window. Role bindings are nothing more than a list of relations defined in the
data source view. When adding or modifying an expression, the Expression Editor is
shown. From here, you can design the expression and name it. When adding a source
field, select New Source Field from the Report Model menu. After adding the source field,
you must rename it and set the bindings from the Properties window. Source field bind-
ings refer to a list of columns from the data source view Model menu.
When you are adding or modifying perspectives, a specialized dialog box opens that
enables you to add/remove items from the perspective.
When adding and removing perspectives, you might notice that adding one object seems
to add others, and removing it removes other objects, too. This is because of the hierarchi-
cal nature of the items. When a parent item, such as a folder or attribute, with variations
gets added or removed, all of its children get added and removed, too. The same thing
applies for roles and identifying attributes. When a role is selected, the corresponding role
is selected along with the entity it leads to. The reverse is also true. When an identifying
attribute is deselected, any other entities that use that identifying attribute get deselected,
too. To reselect those entities, the identifying attribute must get reselected.
Publishing the Model
When you are done creating or updating the model, you can publish the model just as
you would a report. In a published model, the data source and the SMDL file are placed
in the Report Server. Because the information in the data source view is incorporated into
the semantic model, the data source view does not get published. If the information in
the data source view, or for that matter, anything in the semantic model, needs to be
updated, just publish an updated model.
After the model is published, it can be secured using Reporting Services role-based security.
To use the model in Report Builder, a user must have access to it.
When you are ready to deploy the semantic model, the deployment steps closely resemble
the deployment steps in Report Designer:
1. Right-click the project file in Solution Explorer, and select Properties.
From the Library of STEPHEN EISEMAN
Please purchase PDF Split-Merge on www.verypdf.com to remove this watermark.
ptg
339
Report Models and the Model Designer
18
2. Review the target folder’s properties. There is one target folder for the data sources,
and there is another target folder for the semantic models.
3. Verify that the Overwrite Data Sources option is on the intended setting. This option
is similar in name and function to the one in Report Designer.
4. Click OK.
To deploy the model and data source, right-click the project file in Solution Explorer and
select Deploy from the shortcut menu. To deploy just the model file, right-click the
semantic model and click Deploy.
Creating Models from Report Designer
A second way to create a model is from Report Manager. Report Manager can take any SQL
Server or Analysis Services data source and generate a model from it. You can complete the
following steps to generate a model from Report Manager:
1. Go to the Report Manager web page. By default, it is located at
http://localhost/Reports.
2. Click the New Data Source button.
3. Enter a name for this data source. Call this
AdventureWorks DS
. You can also enter a
brief description.
4. Enter a connection type of
Microsoft SQL Server
.
5. Make sure that the Enable This Data Source check box is checked.
6. Enter
Data Source=localhost;Initial Catalog=AdventureWorks
in the Connection
String text box.
7. Select Windows Integrated Security.
8. Click OK. You should return to the Folder View screen. Click the data source you just
created (AdventureWorks DS).
9. Click the Generate Model button.
10. Enter a name for this model. Call it Adventure Works DS Model. If you want to, you
can change where the model is located and give it a description. For now, just leave
these fields blank.
11. Click OK.
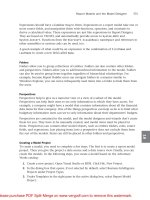
Features of Report Builder
Report Builder is the second part of the two-part solution for end-user reporting. As previ-
ously mentioned, Report Builder is a click-once, client-side .NET application that can be
launched from the Report Manager website. Report Builder uses Microsoft Office para-
digms, so it should be easy for end users who use Microsoft Office to start using it, yet it
still creates reports using standard Report Definition Language (RDL). Figure 18.10 shows
how to access Report Builder.
From the Library of STEPHEN EISEMAN
Please purchase PDF Split-Merge on www.verypdf.com to remove this watermark.
ptg
340
CHAPTER 18 Ad Hoc Reporting
FIGURE 18.10
Starting Report Builder from the Report Manager web interface.
Report Builder uses the models stored on the Report Server. Report Builder calls these
models. Through Report Builder, the end user knows nothing of the actual data source
used by the model. End users will most likely be referring to the model as the data source,
as shown in Figure 18.11. Keep in mind that because the models are secured by the Report
Server, users will not be able to access models to use as data sources for their report if the
appropriate permissions have not been set.
Report Builder has predefined templates available for matrix, table, and chart report
layouts. Note that lists and rectangles are not supported. To use a template, the user just
has to click a template in the left pane. Figure 18.12 shows the Report Builder interface.
After selecting a template, the end user simply has to drag and drop fields from the Report
Data Explorer onto the data region provided. Report Data Explorer is nothing more than
the entity explorer. Attributes and expressions make up the fields that are usable from
within the entity explorer.
Some basic features are also available through Report Builder. Formatting can be done to
any text box on the report layout. Data can be filtered, sorted, and grouped. A full range of
export formats, such as PDF, TIFF, Excel, HTML, XML, CSV, and TIFF are also available to
end users.
Report Builder saves reports to the Report Server. After being published, the reports can be
managed like any other reports.
From the Library of STEPHEN EISEMAN
Please purchase PDF Split-Merge on www.verypdf.com to remove this watermark.
ptg
341
Report Models and the Model Designer
18
FIGURE 18.11
Selecting a model to use with Report Builder.
FIGURE 18.12
Report Builder after the model selection.
From the Library of STEPHEN EISEMAN
Please purchase PDF Split-Merge on www.verypdf.com to remove this watermark.
ptg
342
CHAPTER 18 Ad Hoc Reporting
Building Reports with Report Builder
Building reports with Report Builder is fairly simple compared to Report Designer. The
complexities of connecting to the data source and SQL Server are taken care of by the
model. All that needs to be selected are attributes and expressions from the entity explorer.
First, launch Report Builder. After you launch Report Builder, a list of models appears that
are available for you to use as your data source (see Figures 18.11 and 18.12). After you
select the data source, Report Builder opens up to the report layout section. Figure 18.12
shows what the screen should look like in the default table view.
On the left side is the entity explorer. Below the entity explorer is the list of attributes and
fields. On the right side is the list of style templates: Table, Matrix, and Chart. By clicking
one of these templates, you can create a new report with that layout.
Now, let’s try to build a simple report with Report Builder.
The requirements for this sample report are as follows: The marketing department wants
to see the breakdown of subtotals for sales orders by quarter and by year. They are not sure
what mechanism would be best to display the data, so they request it in tabular format
and in a pivot table.
Tabular Report
Complete following steps to produce the report:
1. Select Table Report from the Report Layout menu on the right side.
2. Select Sales Territory from the entity explorer.
3. Under the Explorer pane, though still on the left side, is the list of fields and attrib-
utes. Select Name and drag it over to the layout view where it says Drag and Drop
Column Fields.
4. After you drag Name over to the layout view, the entity explorer should have
switched to entities that have a role relating to sales territory. From this list, select
Sales Order Headers.
5. From the Attribute Fields menu, drag Order Year, which is located under Order Date,
over next to the Sales Territory name. The mouse cursor should turn blue to signify
that the table is ready to add a column.
NOTE
The Model Builder automatically creates expressions based on dates. These expres-
sions are usually date parts.
Certain entities and attributes also might have a
#of <Entity>
expression. The rules
chosen during the wizard are the driving factor behind these. The Model Builder also
chooses whether to include a distinct count of values based on database statistics.
6. Drag Order Quarter (also located under Order Date) over next to Order Year.
From the Library of STEPHEN EISEMAN
Please purchase PDF Split-Merge on www.verypdf.com to remove this watermark.
ptg
343
Report Models and the Model Designer
18
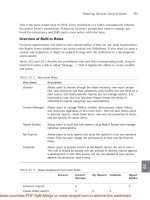
7. Drag Total Sub Total over next to Order Quarter. After doing this, notice three total
lines that appeared. One of the nice features of Report Builder is that it automati-
cally groups and sums data for you.
8. Enter
Total Product Sales by Quarter by Territory
in the text box above the
table where it says Click to Add Title.
Figure 18.13 shows what your report should look like.
The report can be previewed by clicking the Run Report button on the toolbar.
Clickthrough Reports
When the report is in Preview mode, the end user can hover over the Sum of Sales Totals
number and notice that it is actually a link to another report. This type of report is called
a clickthrough report and is automatically generated by Report Builder.
Clickthrough reports are based on roles. After a user has selected to display a certain type
of aggregate attribute, if the attribute has roles linking over to another entity, Report
Builder automatically generates a report listing the contents of that aggregate. You could
potentially drill down to the lowest level, and at each stage Report Builder will generate a
report based on that entity. This feature is called infinite drill down. It is one of the bene-
fits of putting work into generating models that contain information about all the rela-
tionships in the DBMS.
FIGURE 18.13
View of a report in Report Builder.
From the Library of STEPHEN EISEMAN
Please purchase PDF Split-Merge on www.verypdf.com to remove this watermark.
ptg
344
CHAPTER 18 Ad Hoc Reporting
Saving/Publishing Reports
Now that you have completed this basic report, let’s try to save it. Unlike in Visual Studio,
the RDL file that has been generated by Report Builder cannot be saved on the user’s hard
drive. To save client-side reports, users must have access to publish reports in at least one
folder on the Report Server. An easy way to enable this access is to enable the My Reports
option on the Report Server.
This gives users permissions to their own My Report folder.
After enabling My Reports, saving a report is a simple matter. The menu options inside
Report Builder are similar to the same commands in Microsoft Office. The only difference
is that you are saving to the Report Server and not a file server. To save the existing report
to the Report Server and call it Sales by Territory—Table, follow these steps:
1. Choose Save As from the File menu.
2. In the root folder of the Report Server, enter the filename
Sales by Territory—
Table
, and then click OK.
Matrix/Pivot Table Report
Now, let’s go on to make the same report using a pivot table or matrix. The concepts are
the same; just the data region is different.
1. If you have already closed Report Builder, reopen it.
2. Select the Matrix Report style from the Report Layout section on the right pane.
3. From the entity explorer, select Sales Territory, and drag the Name attribute over to
the matrix where it says Drag and Drop Row Groups.
4. From the entity explorer, select Sales Order Headers, and drag the Order Year under
Order Date to the matrix layout where it says Drag and Drop Column Groups.
5. Similarly, select Order Quarter and drag it over to the matrix columns groups. Place
it under Order Year. The mouse cursor should turn blue when it is ready to add a
column group.
6. Select Total Sub Total and drag it to the Detail section of the matrix where it says
Drag and Drop Totals.
7. Add a title to the report; call it
Sales by Territory
.
8. To make things easier to see, let’s use some basic formatting to separate the quarters
from the years. Right-click the inner 0, and select Format from the shortcut menu.
9. Go to the Fill tab and select Gold as the color. Then go to the Alignment tab and
choose Center for the horizontal alignment. Do the same for the Adjoining Total
text box. This should make all quarters-related information headers gold.
10. Do the same thing to the upper 0 and the adjoining total, except select Green as the
color. Select Center for the horizontal alignment. On the Border tab, click the
Outline button to put an outline border around the year.
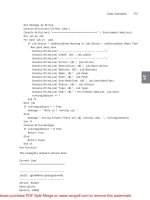
11. When the report is previewed, it looks similar to Figure 18.14.
Save this report on the Report Server as
Sales by Territory Matrix
.
From the Library of STEPHEN EISEMAN
Please purchase PDF Split-Merge on www.verypdf.com to remove this watermark.
ptg
345
Report Builder 2.0
18
FIGURE 18.14
Preview of the report in Report Designer.
12. Right-click the Sum Sub Total text box, select Format from the shortcut menu, go to
the Number tab, and select the currency format.
When everything is complete, your report design should look similar to Figure 18.15.
Report Builder 2.0
Report Builder 2.0 is a new client-side tool that can be installed on the end-user desktop.
The design of Report Builder 2.0 takes a different take on ad hoc reporting. Report Builder
2.0 does not rely exclusively on report models for use as data sources. You can use data
from SQL Server, Analysis Services, other OLE DB data sources, ODBC, SAP, SAP BI,
NetWeaver, Hyperion Essbase, and Oracle. Connecting to a data source is a lot like when
using BIDS. You can use either a shared data source or a report-specific data source.
Report Builder 2.0 can be used to create tabular, matrix, free-form and chart reports. The
nice thing about it is that you can use Report Builder 2.0’s Ribbon interface to place the
data regions onto the layout surface. Report Builder 2.0 is a lot closer to being a full-
featured report designer. Data can be manipulated by filtering, sorting, and grouping with
queries or expressions. Rendering is also fairly open. Reports can be rendered and exported
to HTML, Excel, Word, PDF, and TIFF.
From the Library of STEPHEN EISEMAN
Please purchase PDF Split-Merge on www.verypdf.com to remove this watermark.
ptg
346
CHAPTER 18 Ad Hoc Reporting
FIGURE 18.15
Finalized report design.
Report Builder 2.0 Features
Let’s take a look at some of the features of Report Builder 2.0. A number of the features
listed here are not part of Report Builder 1.0. Report Builder 2.0 is intended to be a full-
featured report designer more akin to BIDS. (A lot of the differences between Report
Builder 1.0 and Report Builder 2.0 can be attributed to that.)
. Multiple data sources: Report Builder 2.0 can use native SSRS data sources.
Therefore, just as with reports you build in BIDS, you can use any OLE DB or ODBC
data source. You can also use multidimensional data sources like Analysis Services or
Essbase. You can also use XML data sources.
. Report data regions: You can use Report Builder 2.0 to create tabular, matrix, and
free-form reports. You can also use charts, gauges, and all the features of the new
SSRS Tablix feature.
. Ad hoc reporting: You can create and save reports and choose to save them directly
to the Report Server or to your local desktop
. Link to subreports: With Report Builder, you can link to subreports and use report
parameters just as you can with BIDS. This allows a certain level of interactivity. If
you use a report model, you can use infinite clickthrough.
. Rendering formats: Report Builder 2.0 allows all rendering extensions used by SSRS.
These include HTML, PDF, CSV, XML, TIFF, Word, and Excel.
. Custom report items: Custom report items can be used in Report Builder 2.0. Of
course, this requires a certain amount of configuration.
From the Library of STEPHEN EISEMAN
Please purchase PDF Split-Merge on www.verypdf.com to remove this watermark.
ptg
347
Report Builder 2.0
18
. Report navigation: You can use document maps and add bookmarks to reports.
. Graphics: You can embed custom images and other resources into reports.
. Aggregations: You can group and summarize data in groups using either fields or
expressions.
Installing Report Builder 2.0
Because Report Builder 2.0 comes with the feature pack, it must be installed outside of the
normal installation. Remember that Report Builder 2.0 targets the end user or advanced
analyst, so it does not get installed on the server, but on the end user’s desktop.
The installation is fairly straightforward. The installation file is called
ReportBuilder.msi
.
Here are the steps to install Report Builder 2.0:
1. Double-click
ReportBuilder.msi
to start the install process.
2. Click Next on the first dialog box to start the install.
3. Accept the license agreement.
4. Enter the registration information.
5. For feature selection, make sure the Report Builder 2.0 feature is going to be installed
completely, and then click Next (see Figure 18.16).
6. Now we have to pick the default target server. This is the server where Report Builder
will automatically try to save to, and Report Builder will also look to this server for
FIGURE 18.16
Report Builder 2.0 feature dialog box.
From the Library of STEPHEN EISEMAN
Please purchase PDF Split-Merge on www.verypdf.com to remove this watermark.
ptg
348
CHAPTER 18 Ad Hoc Reporting
FIGURE 18.17
Report Builder 2.0 Default Target Server screen.
shared data sources. Enter
http://localhost/ReportServer
(see Figure 18.17). Click
Next.
7. Click Install.
8. Click Finish when install completes.
When the install is complete, you can launch Report Builder 2.0 by clicking the Report
Builder 2.0 shortcut in the Start menu. The program group is called Microsoft SQL Server
2008 Report Builder 2.0.
Design Surface
The design surface of Report Builder 2.0 is where most of the work of report authoring
takes place. Similar to other report designers, this is where you add data regions, modify
groupings, edit expressions, change visibility, and format reports.
Items from the data pane or from the Ribbon can be dragged onto the design surface. You
can right-click anywhere on the design surface to edit report properties, and you can right-
click any item to pull up its properties.
Page Size
One of the biggest issues faced by new users is reconciling page size with the printable
page size. The page size on the design surface is based on the total available page size.
However, the printing page size subtracts the margins from the total page size. You can use
the Ruler from the Ribbons to get an idea about how large your reports are. Click the View
From the Library of STEPHEN EISEMAN
Please purchase PDF Split-Merge on www.verypdf.com to remove this watermark.
ptg
349
Report Builder 2.0
18
tab on the Ribbon, and then check the Ruler check box. To set up the page size, click the
Page Setup button in Preview mode.
To sum it up, if you have a printable page size of 8.5 x 11, and you use standard margins
of 1 inch on all sides, your report body’s size has to be 6.5 x 9. Therefore, you have to take
1 inch off of the page size from the right and left sides of the page, and 1 inch from the
top and bottom.
Ribbons
One of the nice new features in Report Builder 2.0 is the intuitive Ribbons interface of
Office 2007. There are four main tabs in the Report Builder 2.0 interface: Home, Insert,
View, and Run.
The Home tab, as shown in Figure 18.18, contains useful commands to help design
reports on the design surface. From this tab, you can run the report and change fonts,
paragraph alignment, borders, and number formatting. Just like in BIDS, executing the
report with the
run
command displays for you the report in HTML values. When you
execute the report, you end up in the Run tab.
The Insert tab, shown in Figure 18.19, contains commands for adding report items. This
Ribbon contains common data regions like Table, Matrix, Chart, Gauge, and List. It also
FIGURE 18.18
Home tab.
From the Library of STEPHEN EISEMAN
Please purchase PDF Split-Merge on www.verypdf.com to remove this watermark.
ptg
350
CHAPTER 18 Ad Hoc Reporting
FIGURE 18.19
Insert tab.
contains common items such as Textbox, Image, Line, and Rectangle. In addition, you can
add subreports and add a header and footer.
The View tab, shown in Figure 18.20, contains items to help design reports. From this tab,
you can turn off and on dialog boxes (for example, the Report Data, Grouping, Ruler, and
the Properties dialog boxes).
From the Run tab, shown in Figure 18.21, you can get to crucial tools, such as the Print
Layout, Page Setup, and Print functions. You can also use the Run tab and click the Export
button to export into different rendering formats, such as XML, CSV, TIFF, PDF, MHTML,
Excel, and Word. Clicking the Design button will send you back into design view.
Other Dialog Boxes
The data pane is there to manage data sources and data sets. From the data pane, you can
also drag fields from common fields, or from the data sets.
The Properties dialog box enables you to modify properties for individual report items.
You have to enable the dialog box from the View tab in the Ribbon. After you enable it,
when you click any report item, modifiable properties will display. You can sometimes
modify the properties just by editing text, or selecting a valid value from a drop-down.
Other times, a custom dialog box may pop up.
The grouping pane in Report Builder 2.0 is similar to the grouping pane in BIDS. It
contains two main groups: Row Groups and Column Groups. Groups can be created by
From the Library of STEPHEN EISEMAN
Please purchase PDF Split-Merge on www.verypdf.com to remove this watermark.